
My Sketch
Important Note: The dataset is HUGE and sometimes it takes a couple of seconds for the sketch to load. Please do not SPAM the checkboxes, and kindly wait 1 to 2 seconds before clicking/unclicking a checkbox.
My concept
I was inspired by the demo of world population we did in class and I really wanted to try something similar yet still distinct. The moment I thought of flight pathways, I knew I had to do this. I love traveling and flying and I knew that visualizing all the flight pathways could create the outline of the world map, and create a neural-network-looking artwork.
One of the difficulties I had was searching for a comprehensive dataset. I simply wanted the coordinates of the starting point and coordinates of the ending point for every flight, but most datasets I found organized the data a bit differently. I asked ChatGPT to help me find a dataset that has the structure I was looking for, and it suggested me this dataset on DataBazaar, which I end up did using.
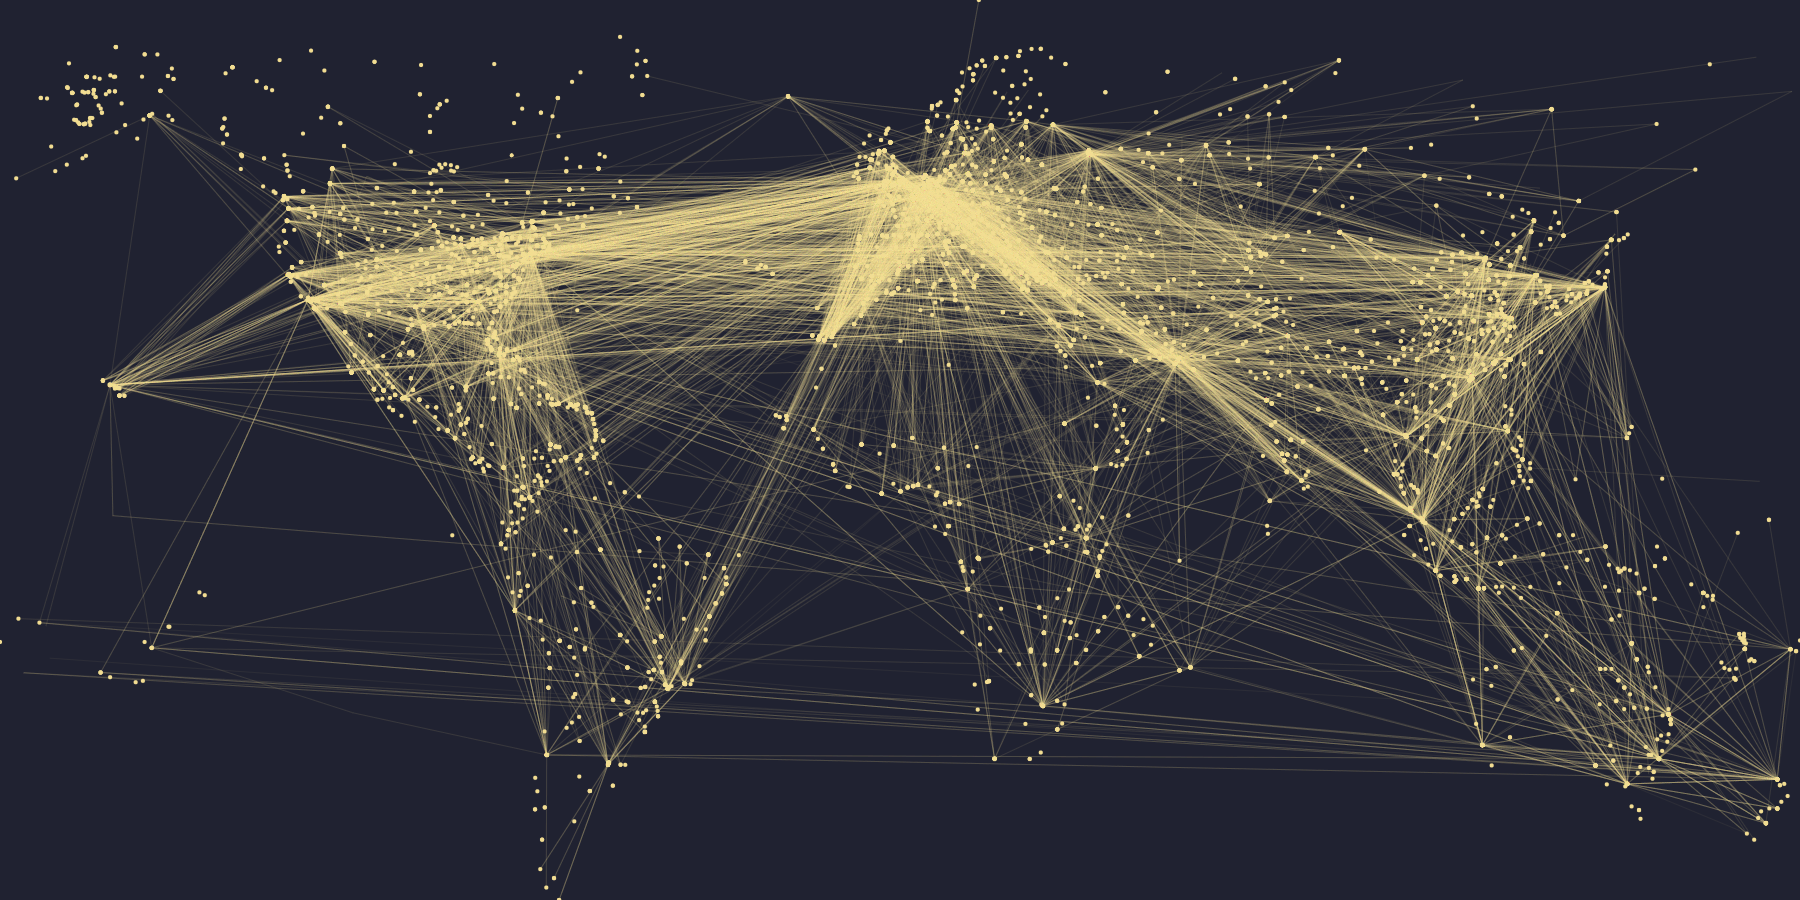
My highlight code
The highlight of my code is my checkboxes and how they function. There are 2 checkboxes, one to show the airports (as dots) and one to show the flight routes (lines). You can check none, one, or both. The checkboxes are in the setup() function, and I essentially want the map to change depending on which box(es) are checked.
check_routes = createCheckbox("SHOW ROUTES", true);
check_routes.changed(() => {
    loop();
  });
Normally, I could have if check_routes.checked() in the draw() function to indicate what I want to happen based on the status of the boxes. However, I have a noLoop() at the end of the draw(), otherwise it would be too computationally expensive to have dots and lines being mapped out and drawn 60 times every second. But because I had noLoop(), the draw() function only draws once and stops, which means that checking the checkboxes does not have any effects. This was also a major bug in my code, so I had to ask ChatGPT for help and it taught me about the changed() function! So, when the checkboxes are changed (aka clicked/unclicked), the sketch draw() will resume in looping. It has a noLoop at the end though, so technically it only loop once.
How this was made
My dataset has 4 columns: the longitude and latitude for the start, and the longitude and latitude for the end (destination). I extract each column into their respective arrays: start_lng, start_lat, dest_lng, dest_lat.
The next step was to find the maximum and minimum of the latitudes and longitude. Because I had 2 arrays for latitudes and 2 arrays for longitude, I had to repeat this process 3 times for each value. For example, in the code below, I find the maximum latitude value in start_lat and the maximum latitude value in dest_lat, then comparing them to get the actual maximum latitude. This process is then repeat for min_lat, max_lng, min_lng.
let max_start_lat = max(start_lat);
let max_dest_lat = max(dest_lat);
let max_lat = max(max_dest_lat, max_start_lat);
Then, with these values, I can draw the flight lines and airport endpoints using the map() function. I loop from 0 to the numRoutes (the number of rows = the number of flight paths in the dataset) and in every iteration, I extract the coordinates into x1, x2, y1, y2. These x and y variables are then used to draw a line that resembles one flight route.
if (check_routes.checked()) {
    //loop every entry in numRoutes
    for (let i = 0; i < numRoutes; i++) {
      //save the coordinates in a variable and print the line connecting the points
      let x1 = map(start_lng[i], min_lng, max_lng, 0, width);
      let y1 = map(start_lat[i], min_lat, max_lat, height, 0);
      let x2 = map(dest_lng[i], min_lng, max_lng, 0, width);
      let y2 = map(dest_lat[i], min_lat, max_lat, height, 0);
      line(x1, y1, x2, y2);
    }
  }
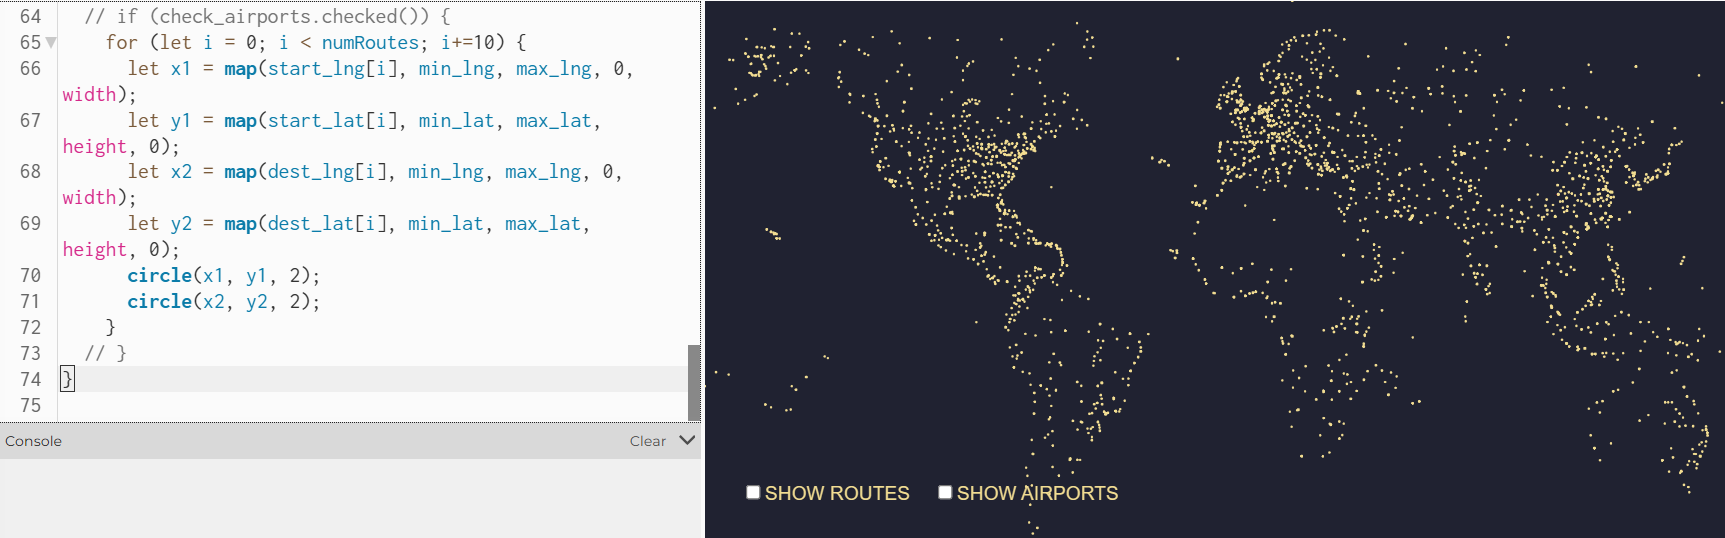
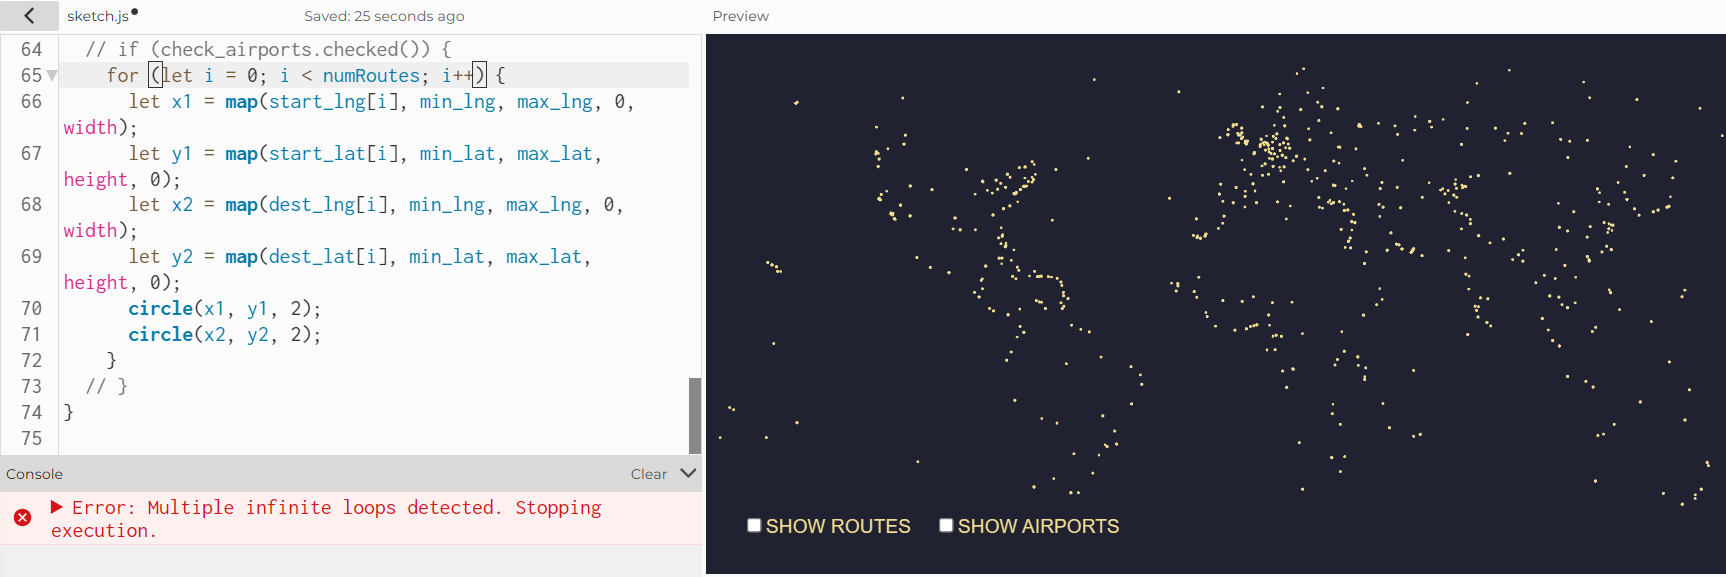
The block of code to draw airports is also very similar; instead of drawing the line, I draw 2 circles with radius of 2, whose centers uses (x1, y1) and (x2, y2). There was one bug, though. For some reason, the p5 editor is unable to handle the amount of iterations in the drawing of the circles. If the loop had i increment by 1 (i++), the p5 would only draw some of the circles. When I changed it to i+=10, I reduced the number of circles it has to draw by 1/10, and ironically it displays more circles than when I had i++. I decided to keep it at i+=10, and I think this bug is most likely because my dataset has ~66K rows, which is a lot to handle.
Reflection
I think it looks incredibly cool, and I personally like how abstract the sketch is with just the routes mapped. I was a bit worried that my assignment would be quite similar to what we did in class initially, so I incorporated the checkboxes as a way to 1) challenge myself and take the visualization a step further, 2) encourage meaningful interactivity, and 3) create an opportunity to learn about new things. Compared to the demo population example you have us in class, drawing the flight pathways is also quite different. Most importantly, I learned new things in the process of this assignment, which is always a win :))
If I had more time, I would love to have a search bar where the user types in the code of the departure and arrival airport (e.g.: DXB, JFK, LAX), and the sketch would make that route a different color if a direct flight is available. I think that this is feasible, since the original dataset does come with airport codes. It would be quite complex though, since it involves searching, I think.
Resources I Used
Original Dataset: https://www.databazaar.io/datasets/71f62319-b8c7-42f1-be03-c7eb69308335
My edited dataset (via Google Sheets): https://docs.google.com/spreadsheets/d/187gIhSrk3LXHEgqG_BxJ3_Gz9WVtgrXmvUJ0kJV333s/edit?gid=2055795158#gid=2055795158
https://p5js.org/reference/p5/createCheckbox/
How Artificial Intelligence was used:
- to find my original dataset
- suggested to me the
changed()function which I used for the checkboxes insetup()
Artificial Intelligence was not used in any other part of this assignment.