1. Concept
My final project helps users, especially beginners, to learn how to play the piano and learn how to jam to the blues music style. I created a mini-piano consisting of 2 octaves plus one key (spanning notes C4 to C6), which is a welcoming size for beginners. A visualization of a piano is displayed on the p5js sketch, which can be helpful for the piano player to see an animated pressed key and listen to the relevant audio for that pressed key.
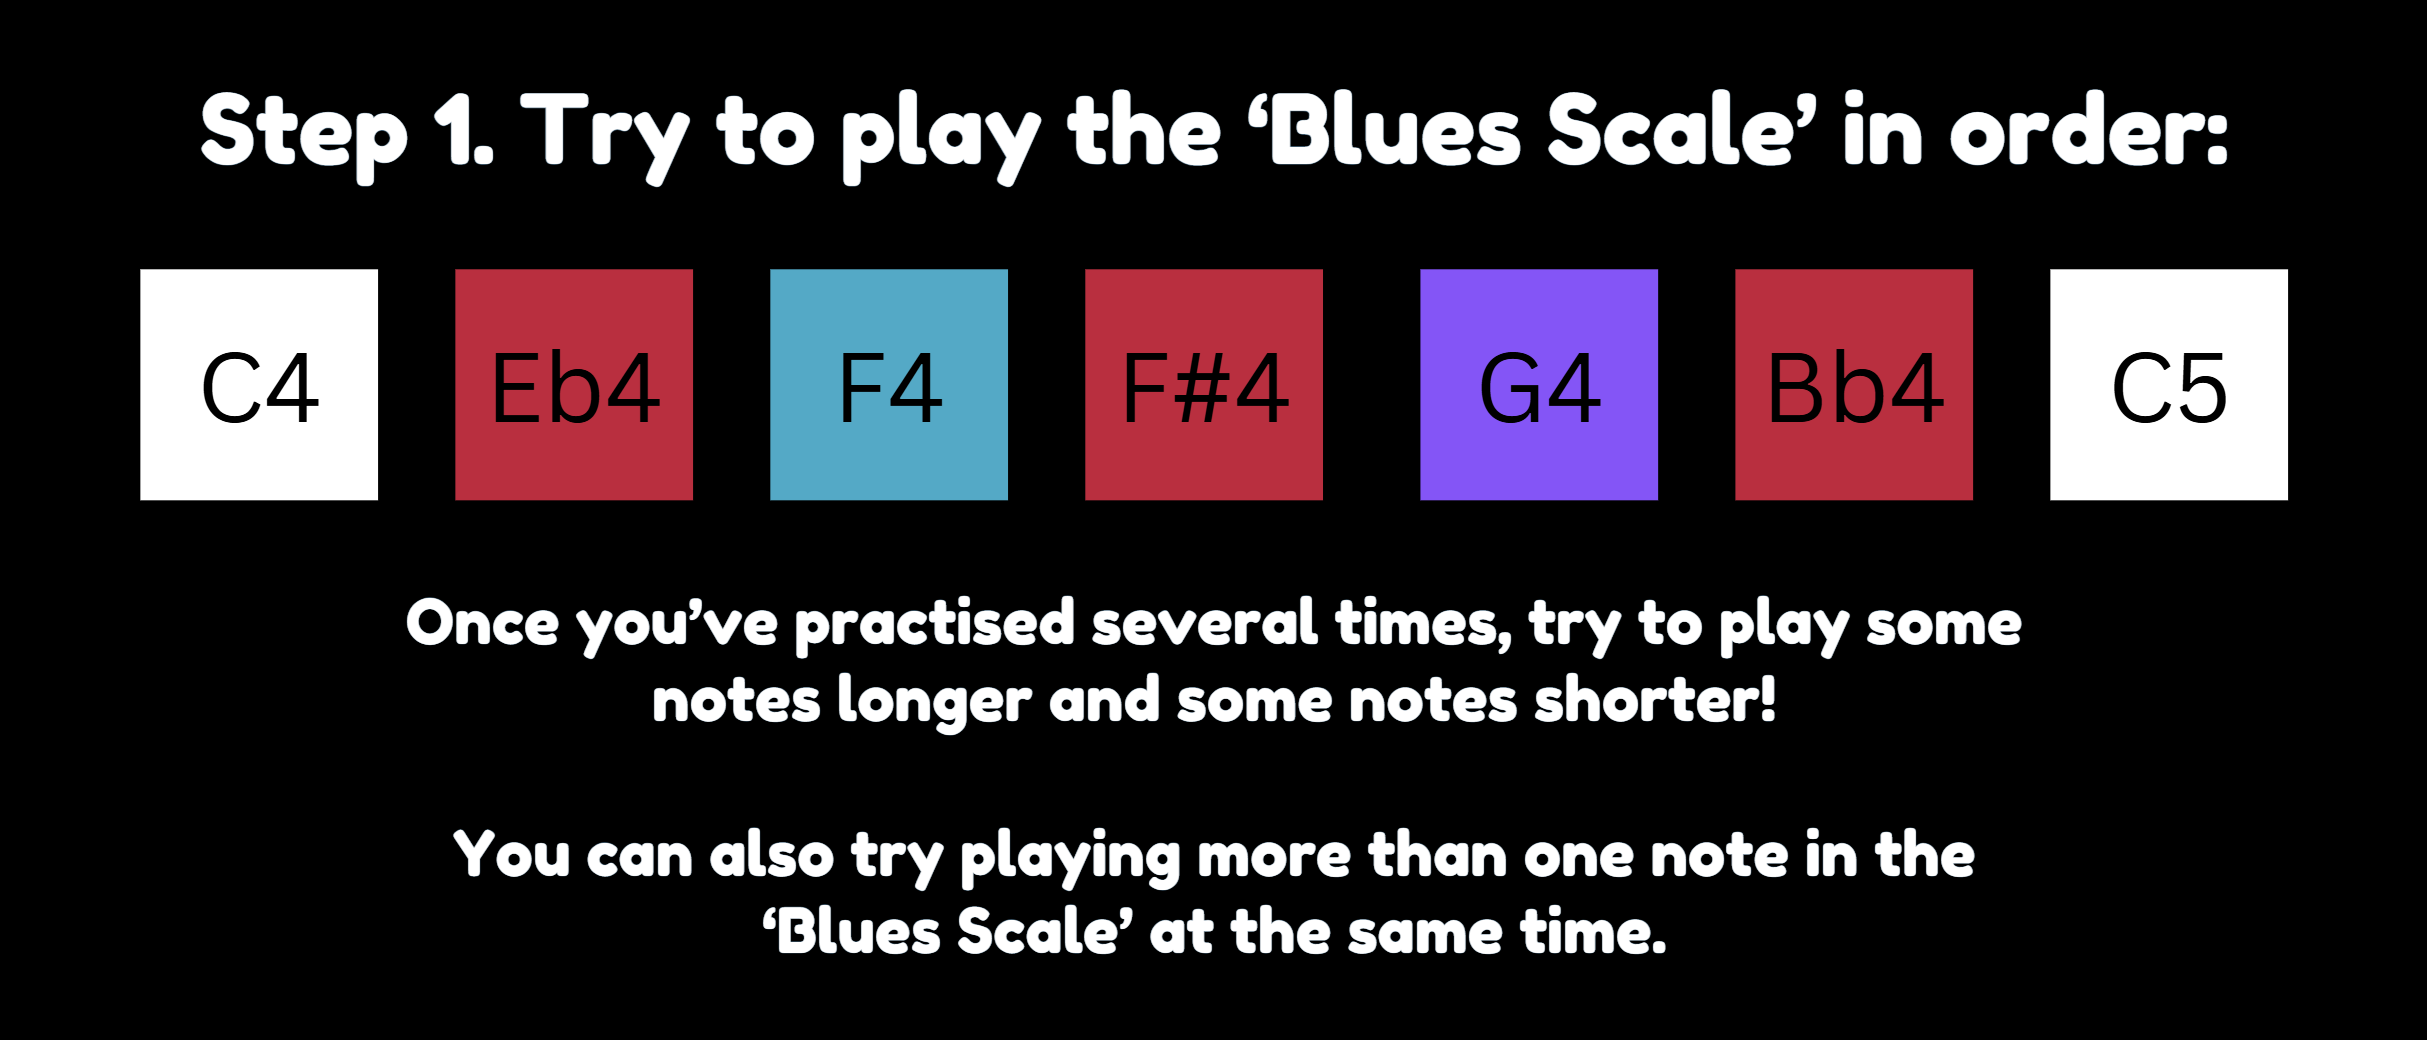
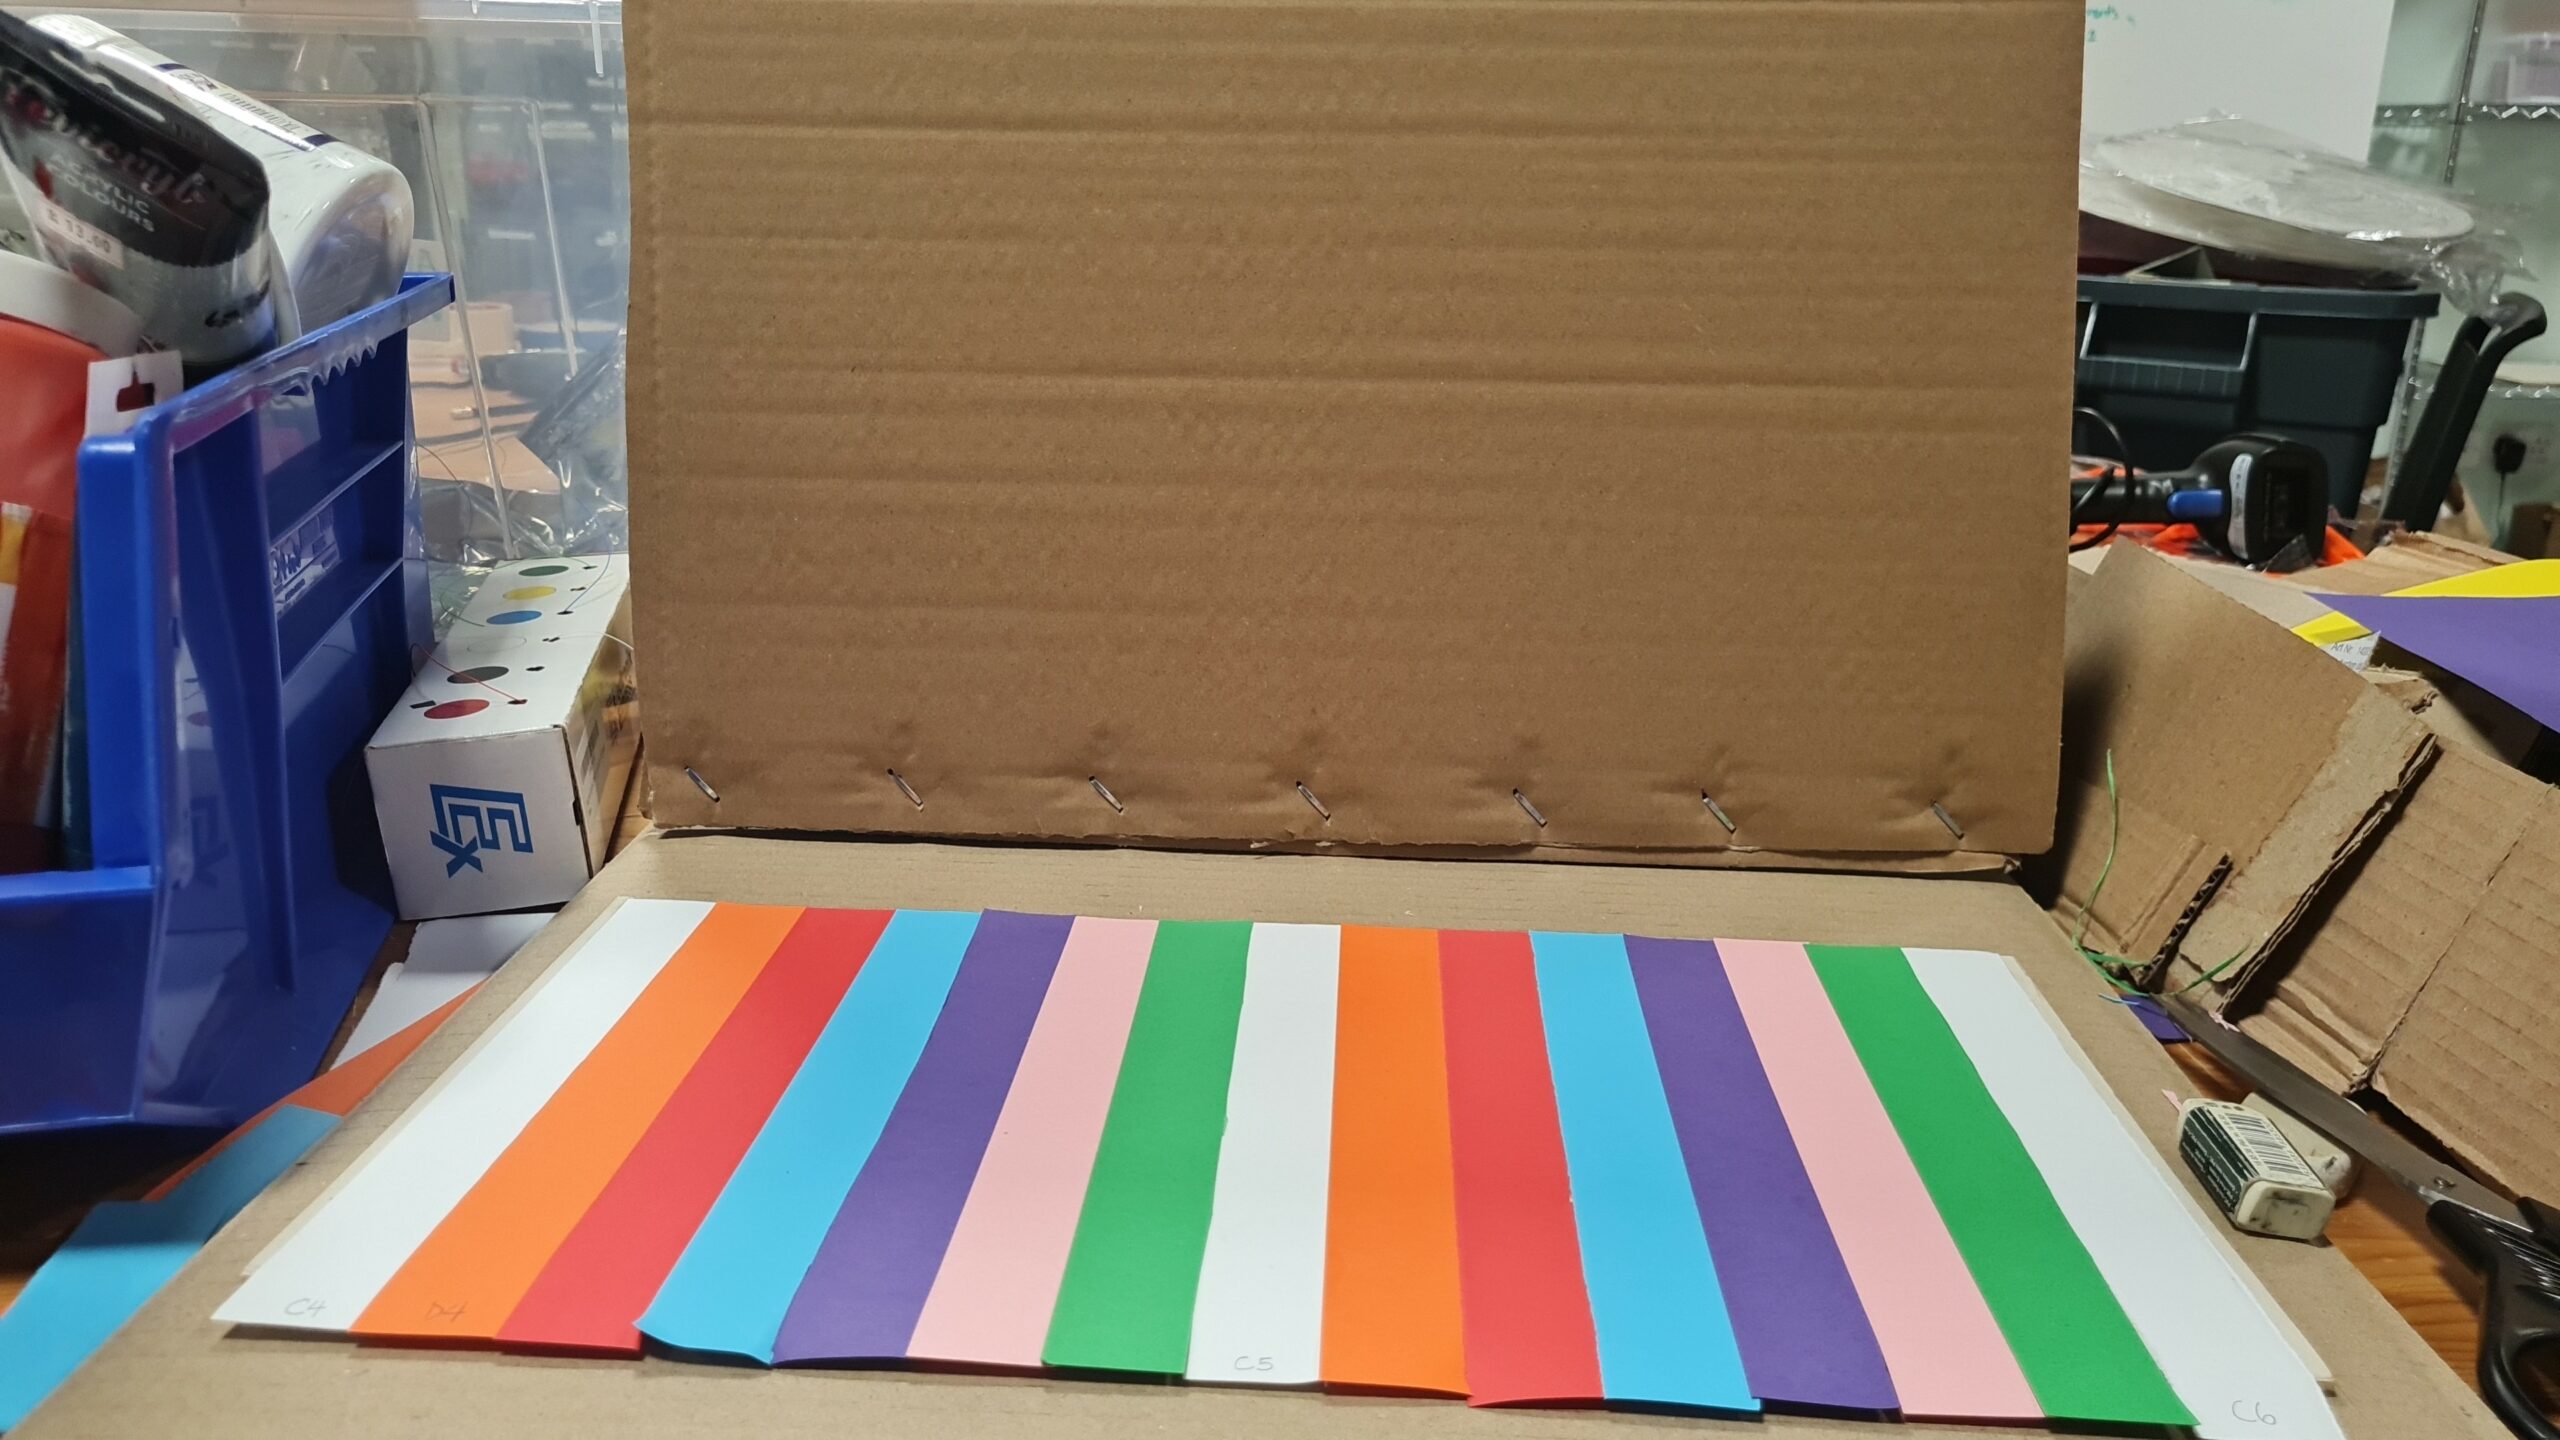
The piano is color-coded by note, so that note “C” is white, “D” is orange, “E” is red, “F” is blue and so on. This was a deliberate choice because seeing different colours on the piano can help users familiarize themselves with the positions of the keys over time. Additionally, I used this presentation slide deck with instructions to play the notes, color-coded, in order (example in Fig. 1). Thus, as users see the color-coded notes on the presentation and try to follow it, they could more quickly and easily match it to the note on the physical piano that they should play.
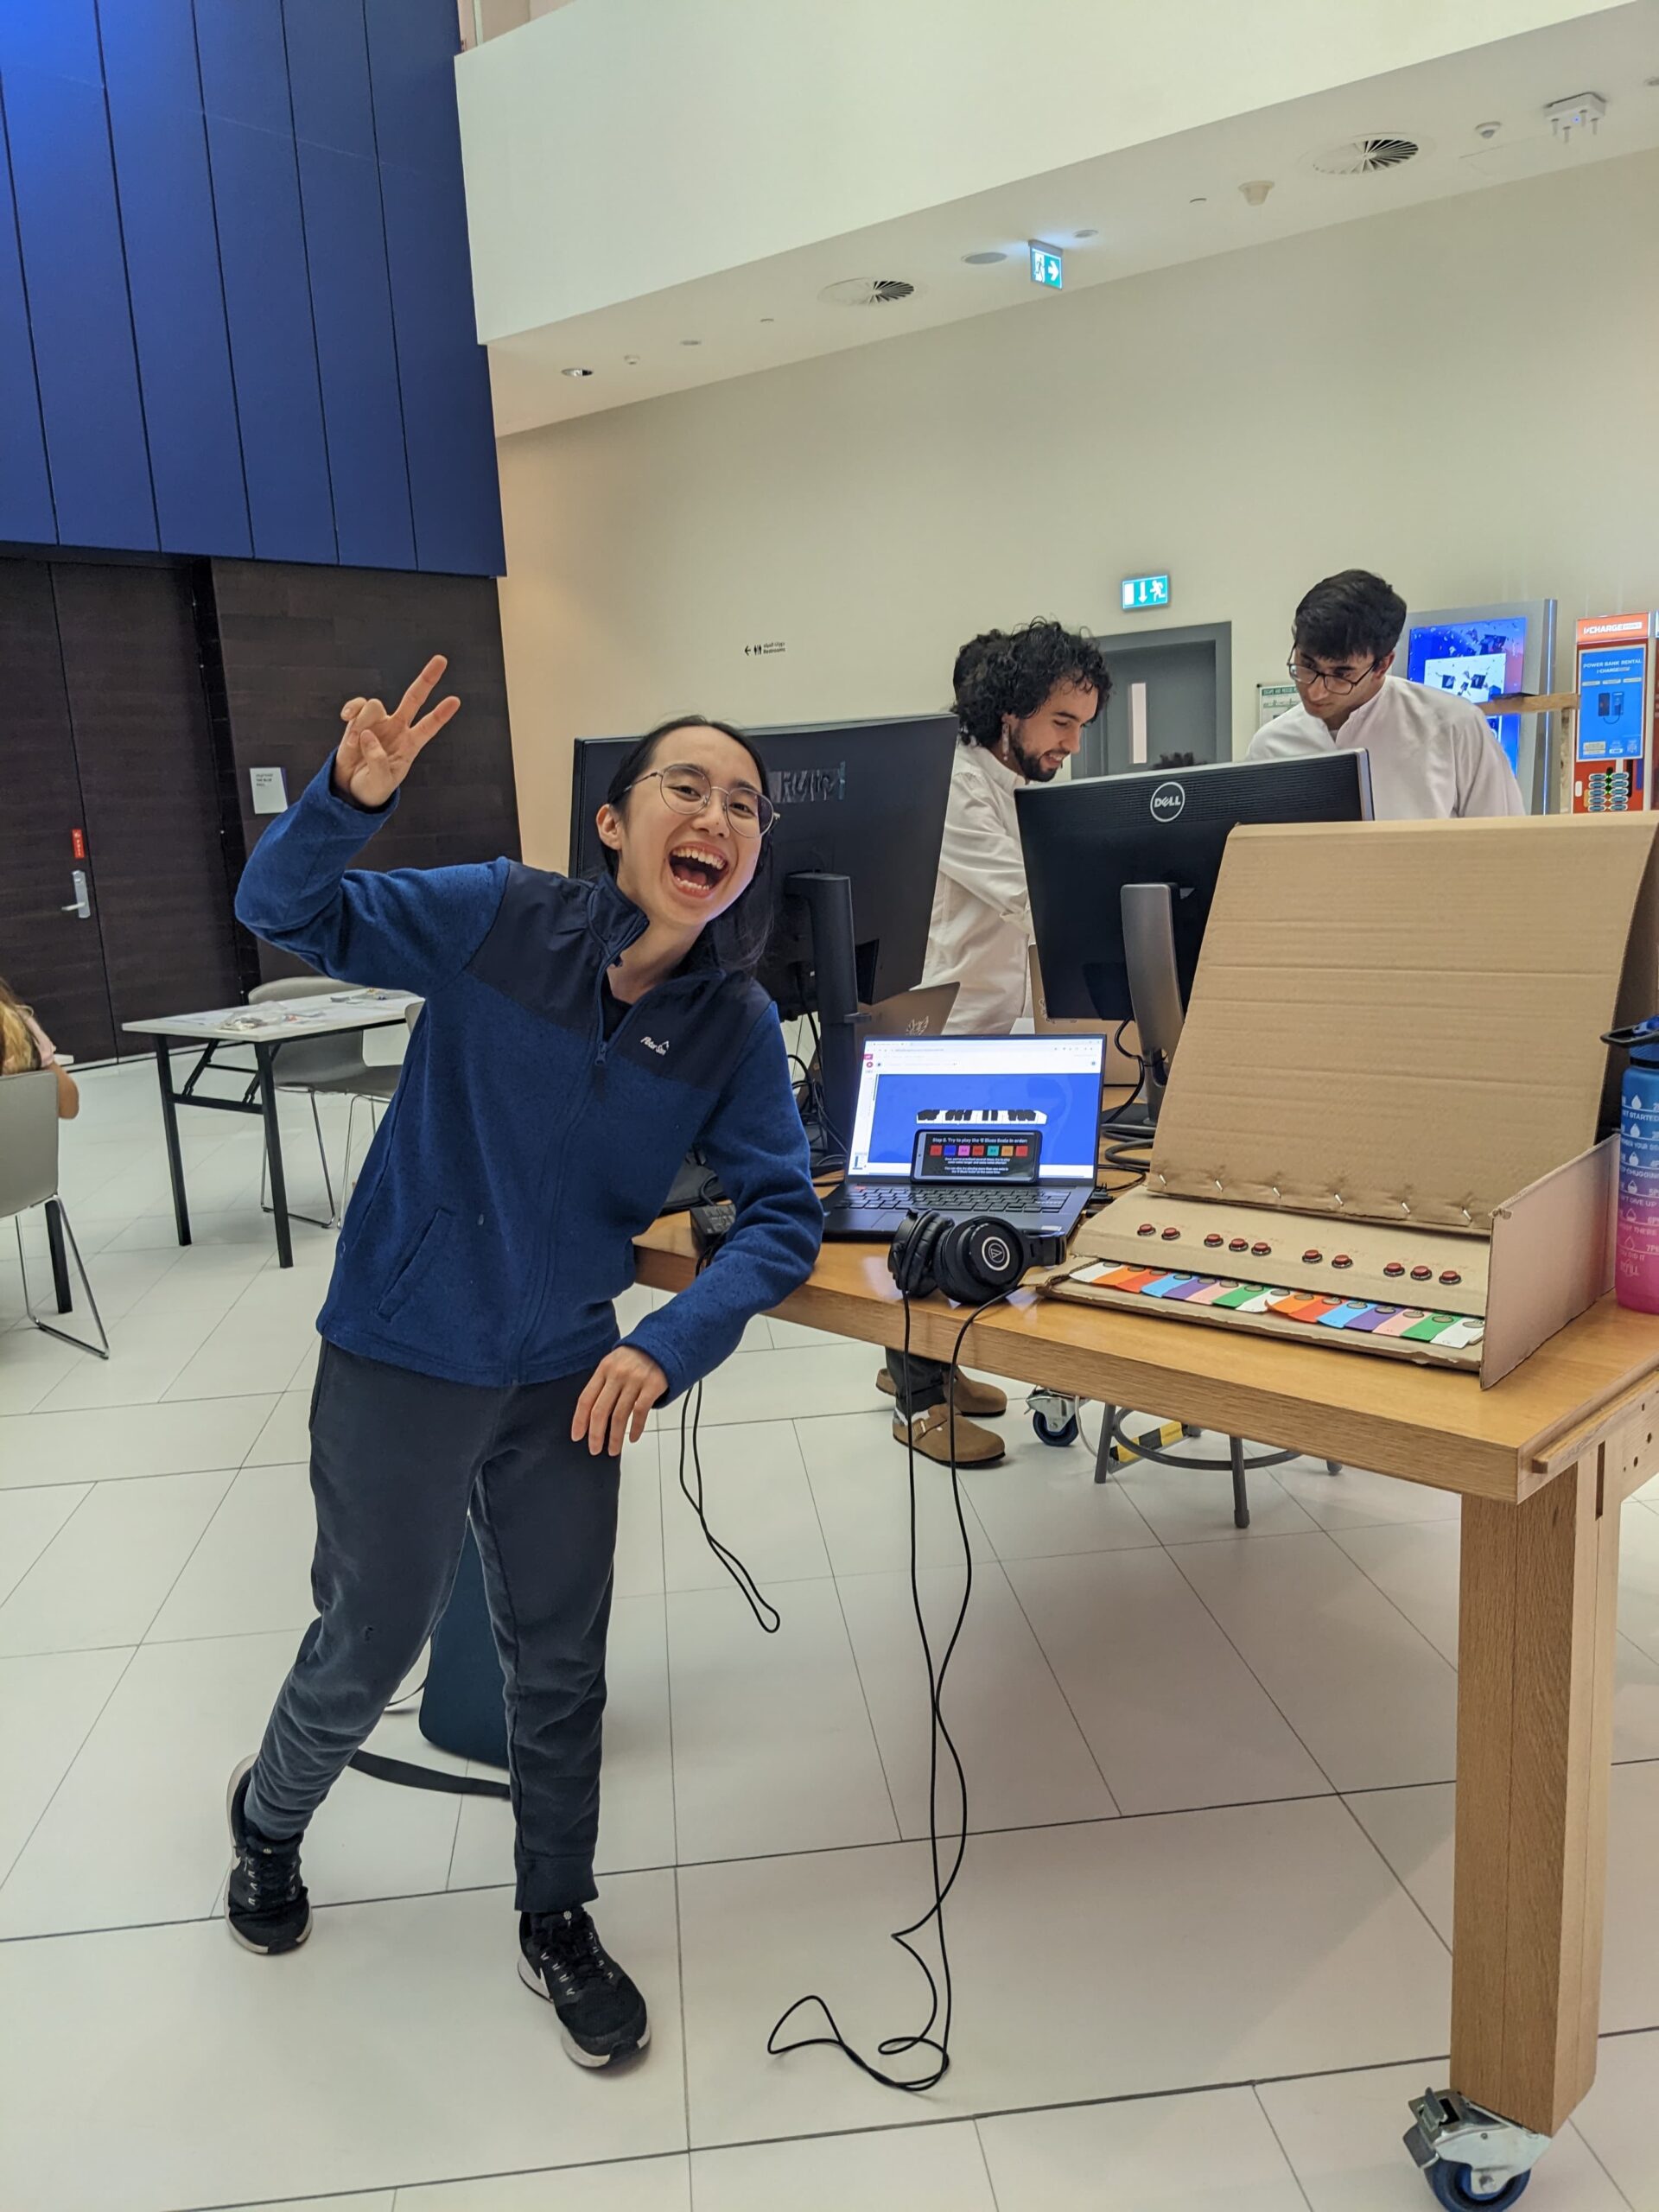
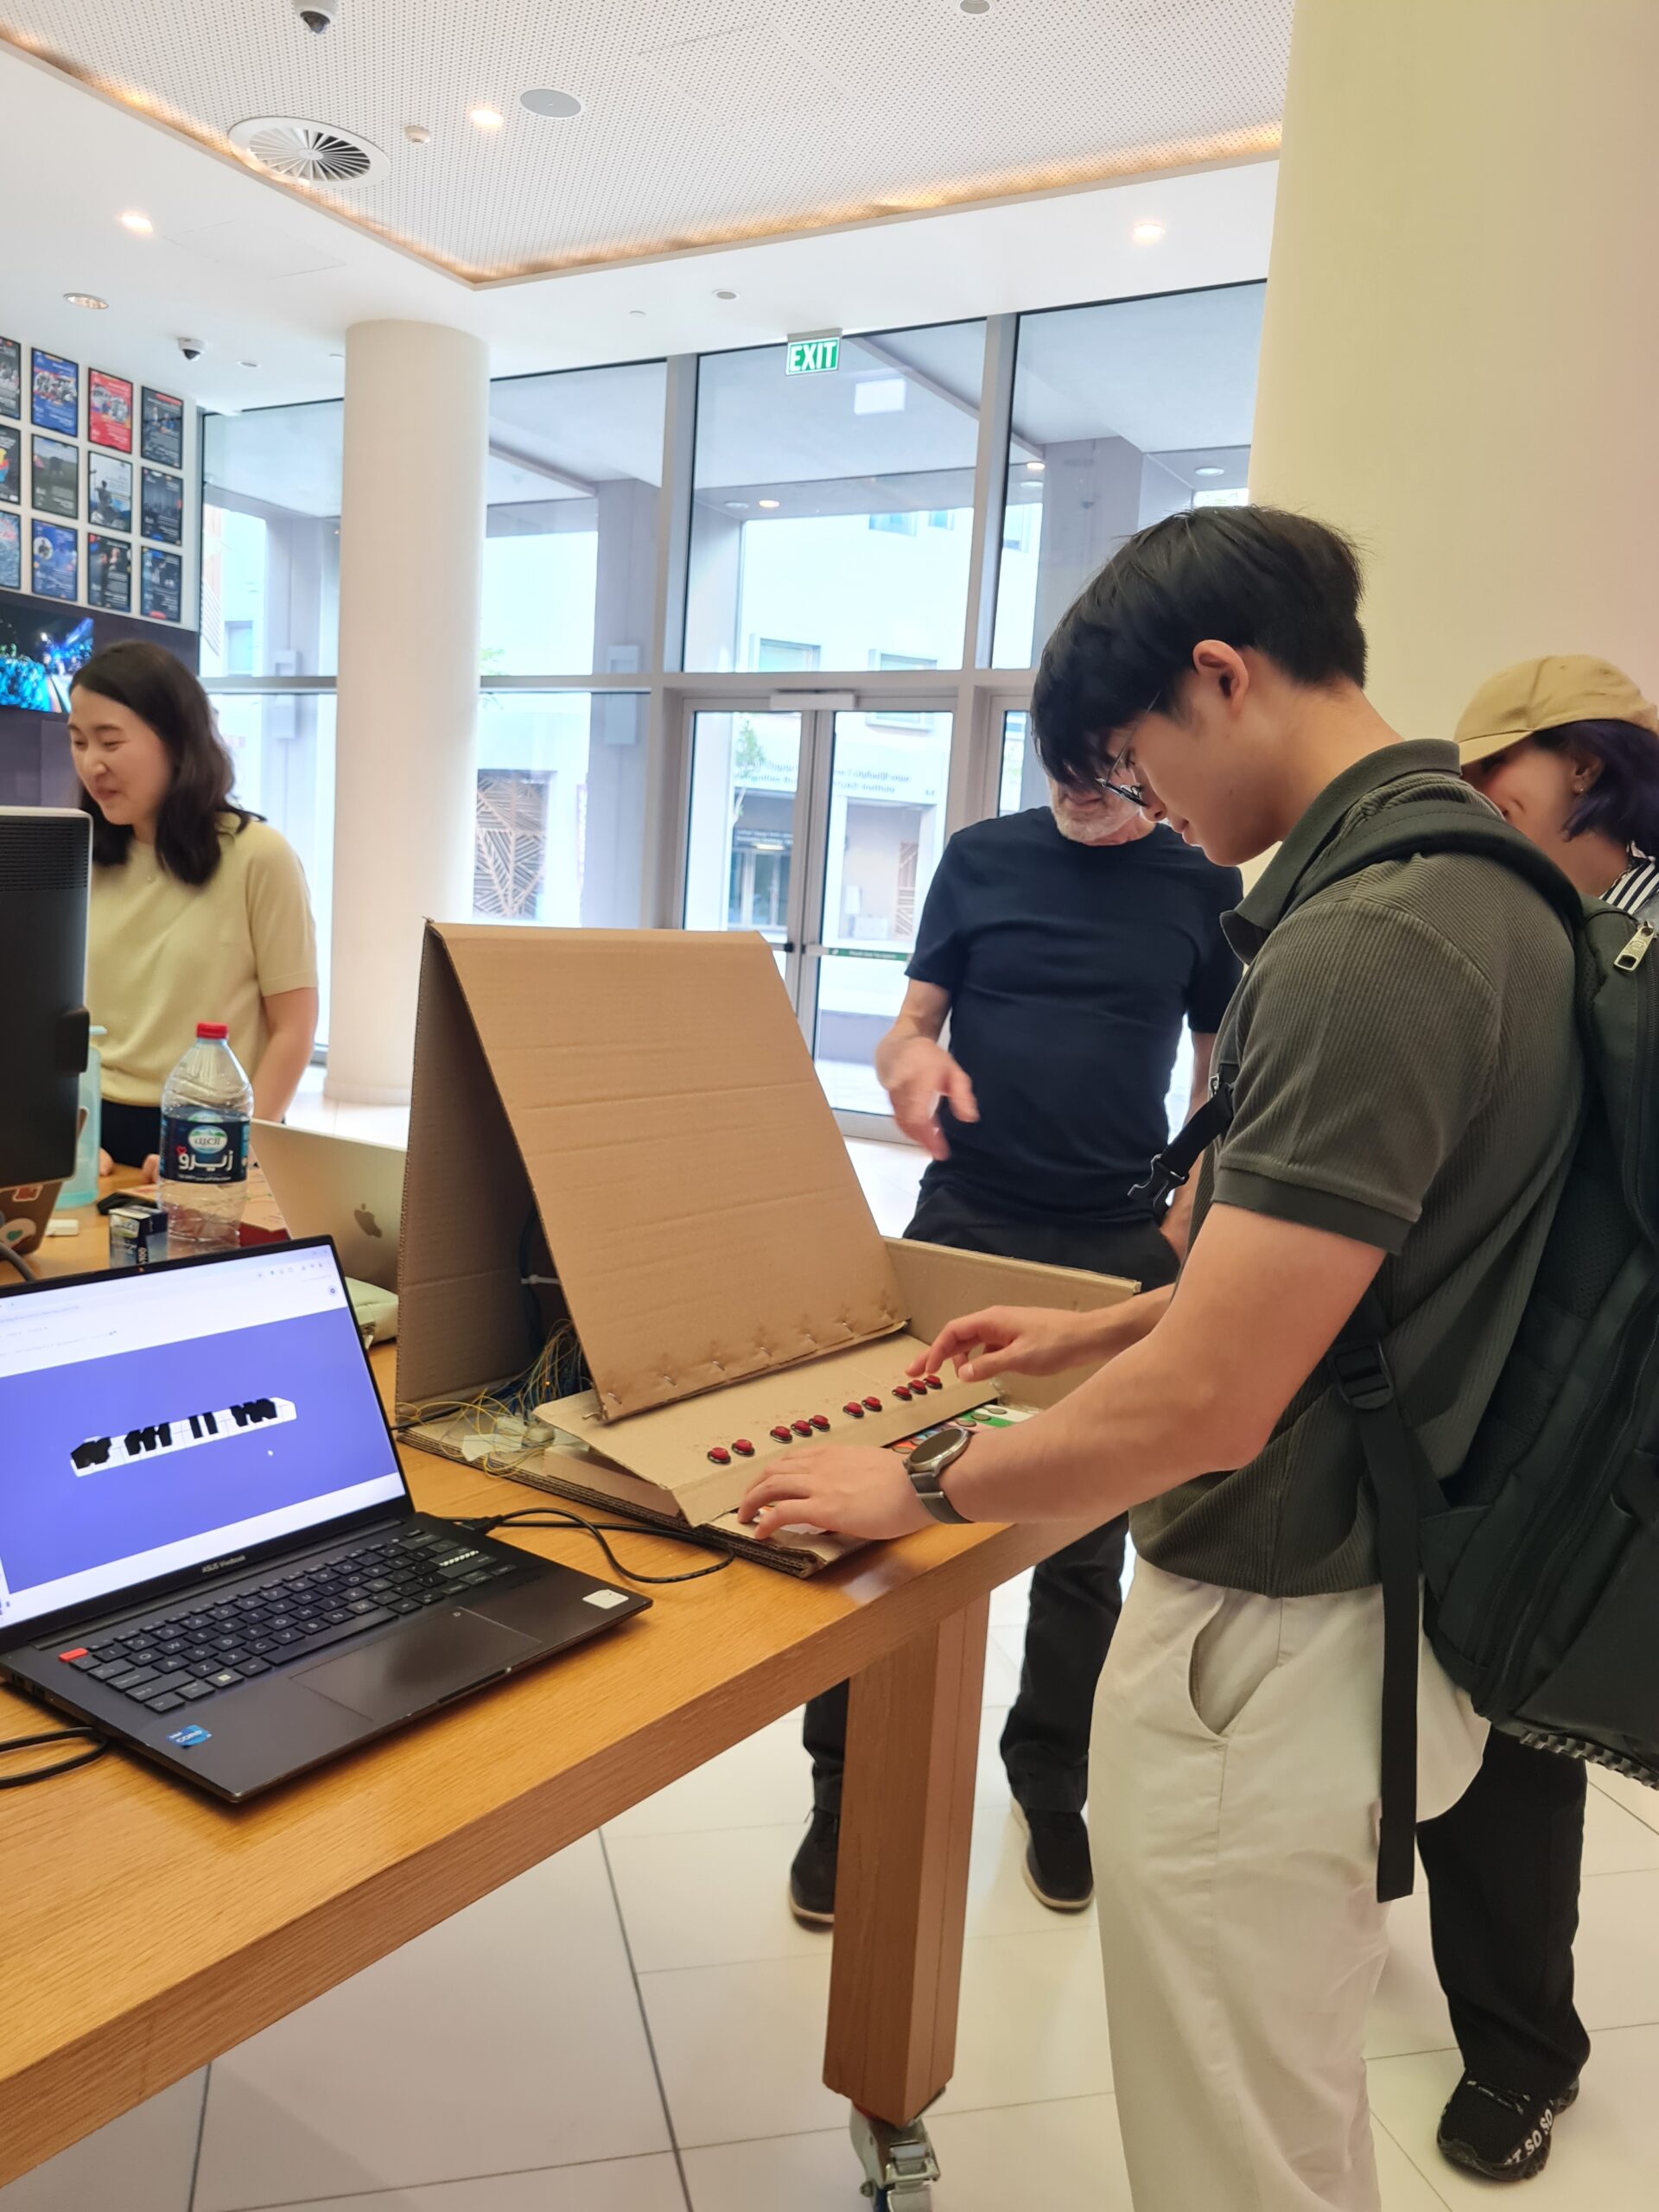
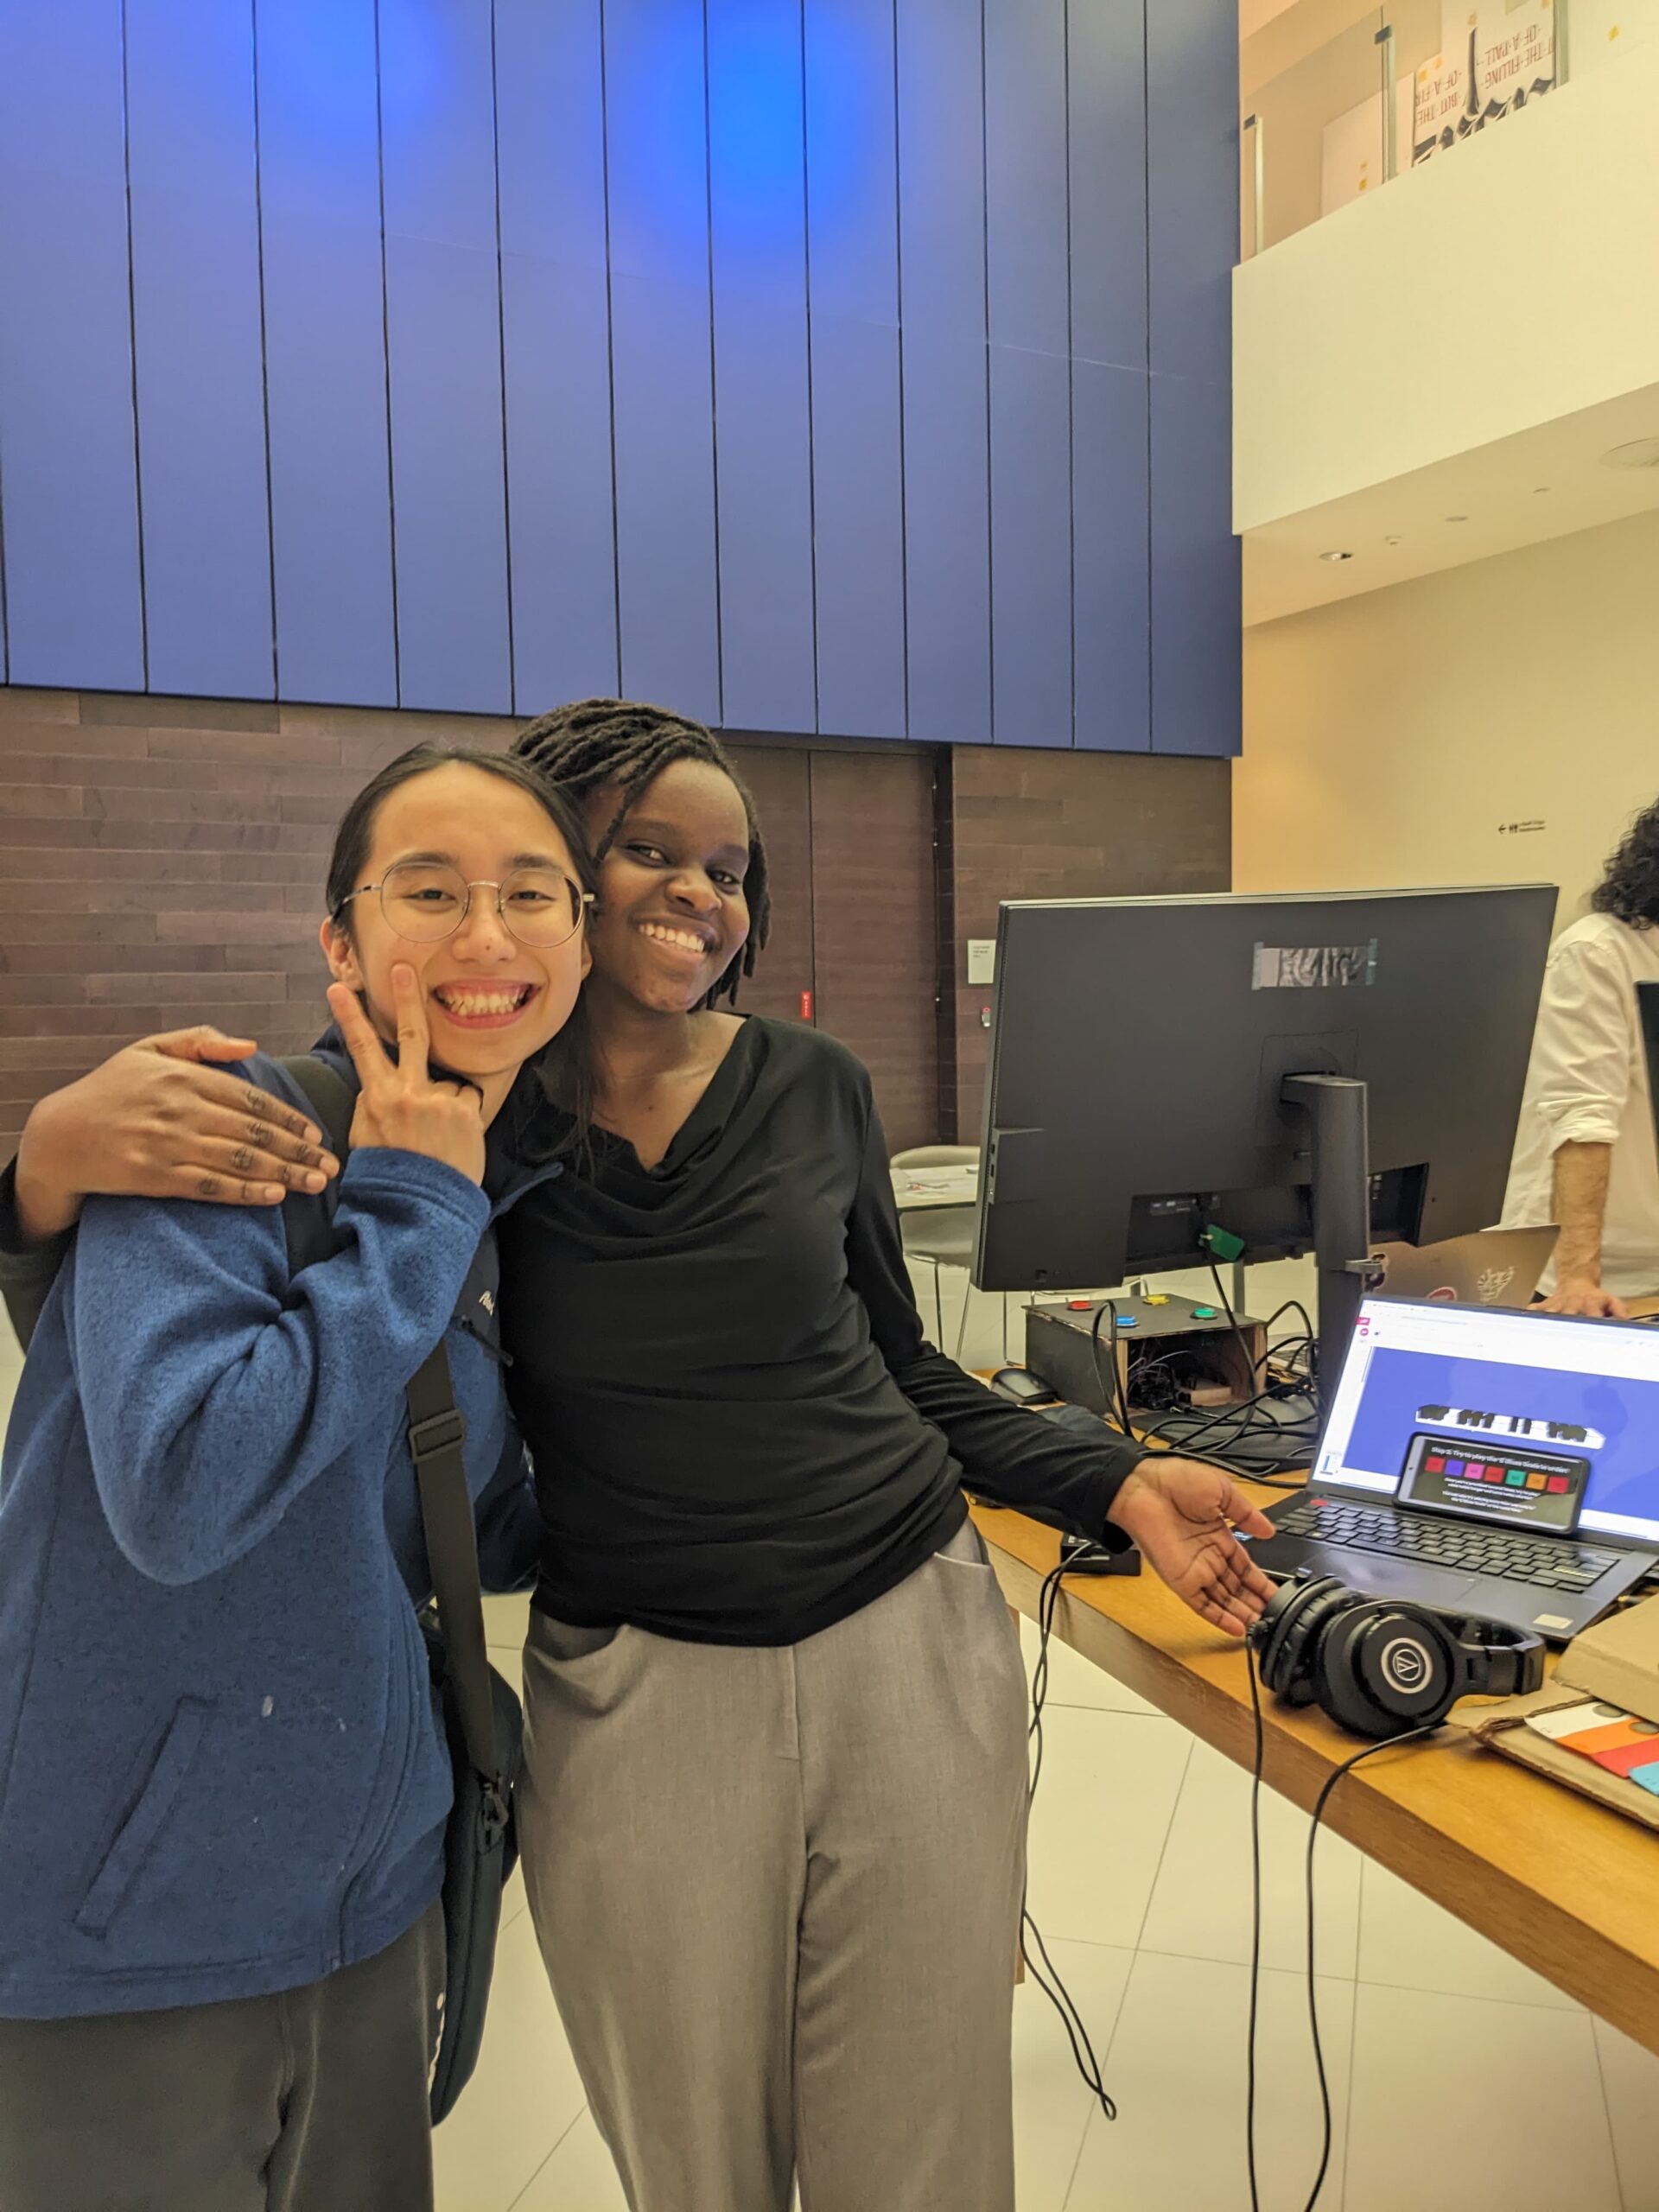
2. Pictures / Videos of Project Interaction

3. Implementation
The interaction design can be described as follows: users can listen to an E-minor backing track, and respond by pressing on the labelled force sensitive resistors and labelled push buttons, resulting in an animation of pressed white keys vs pressed black keys respectively. They also hear the note being played using p5js.
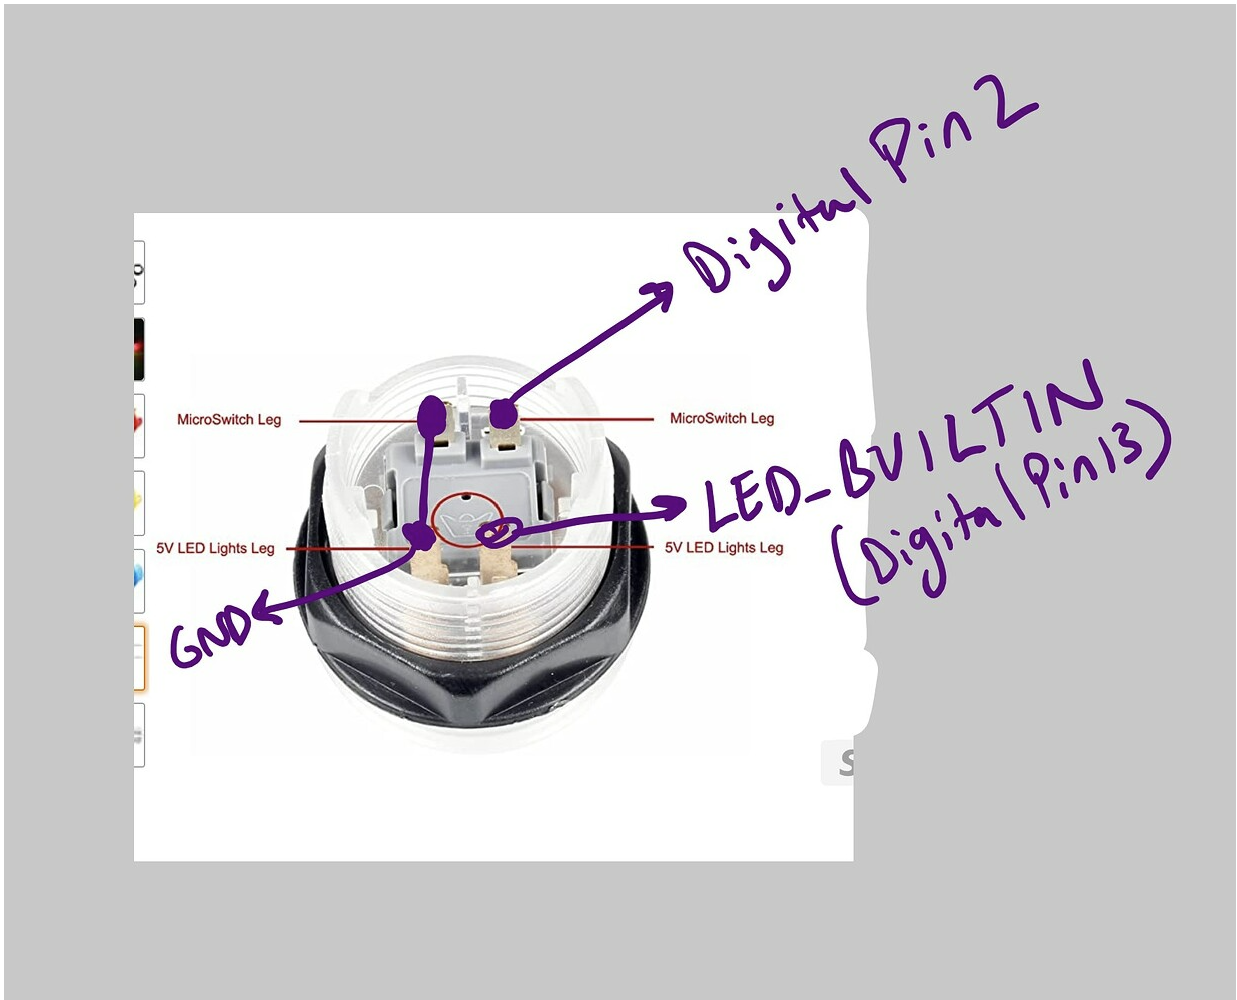
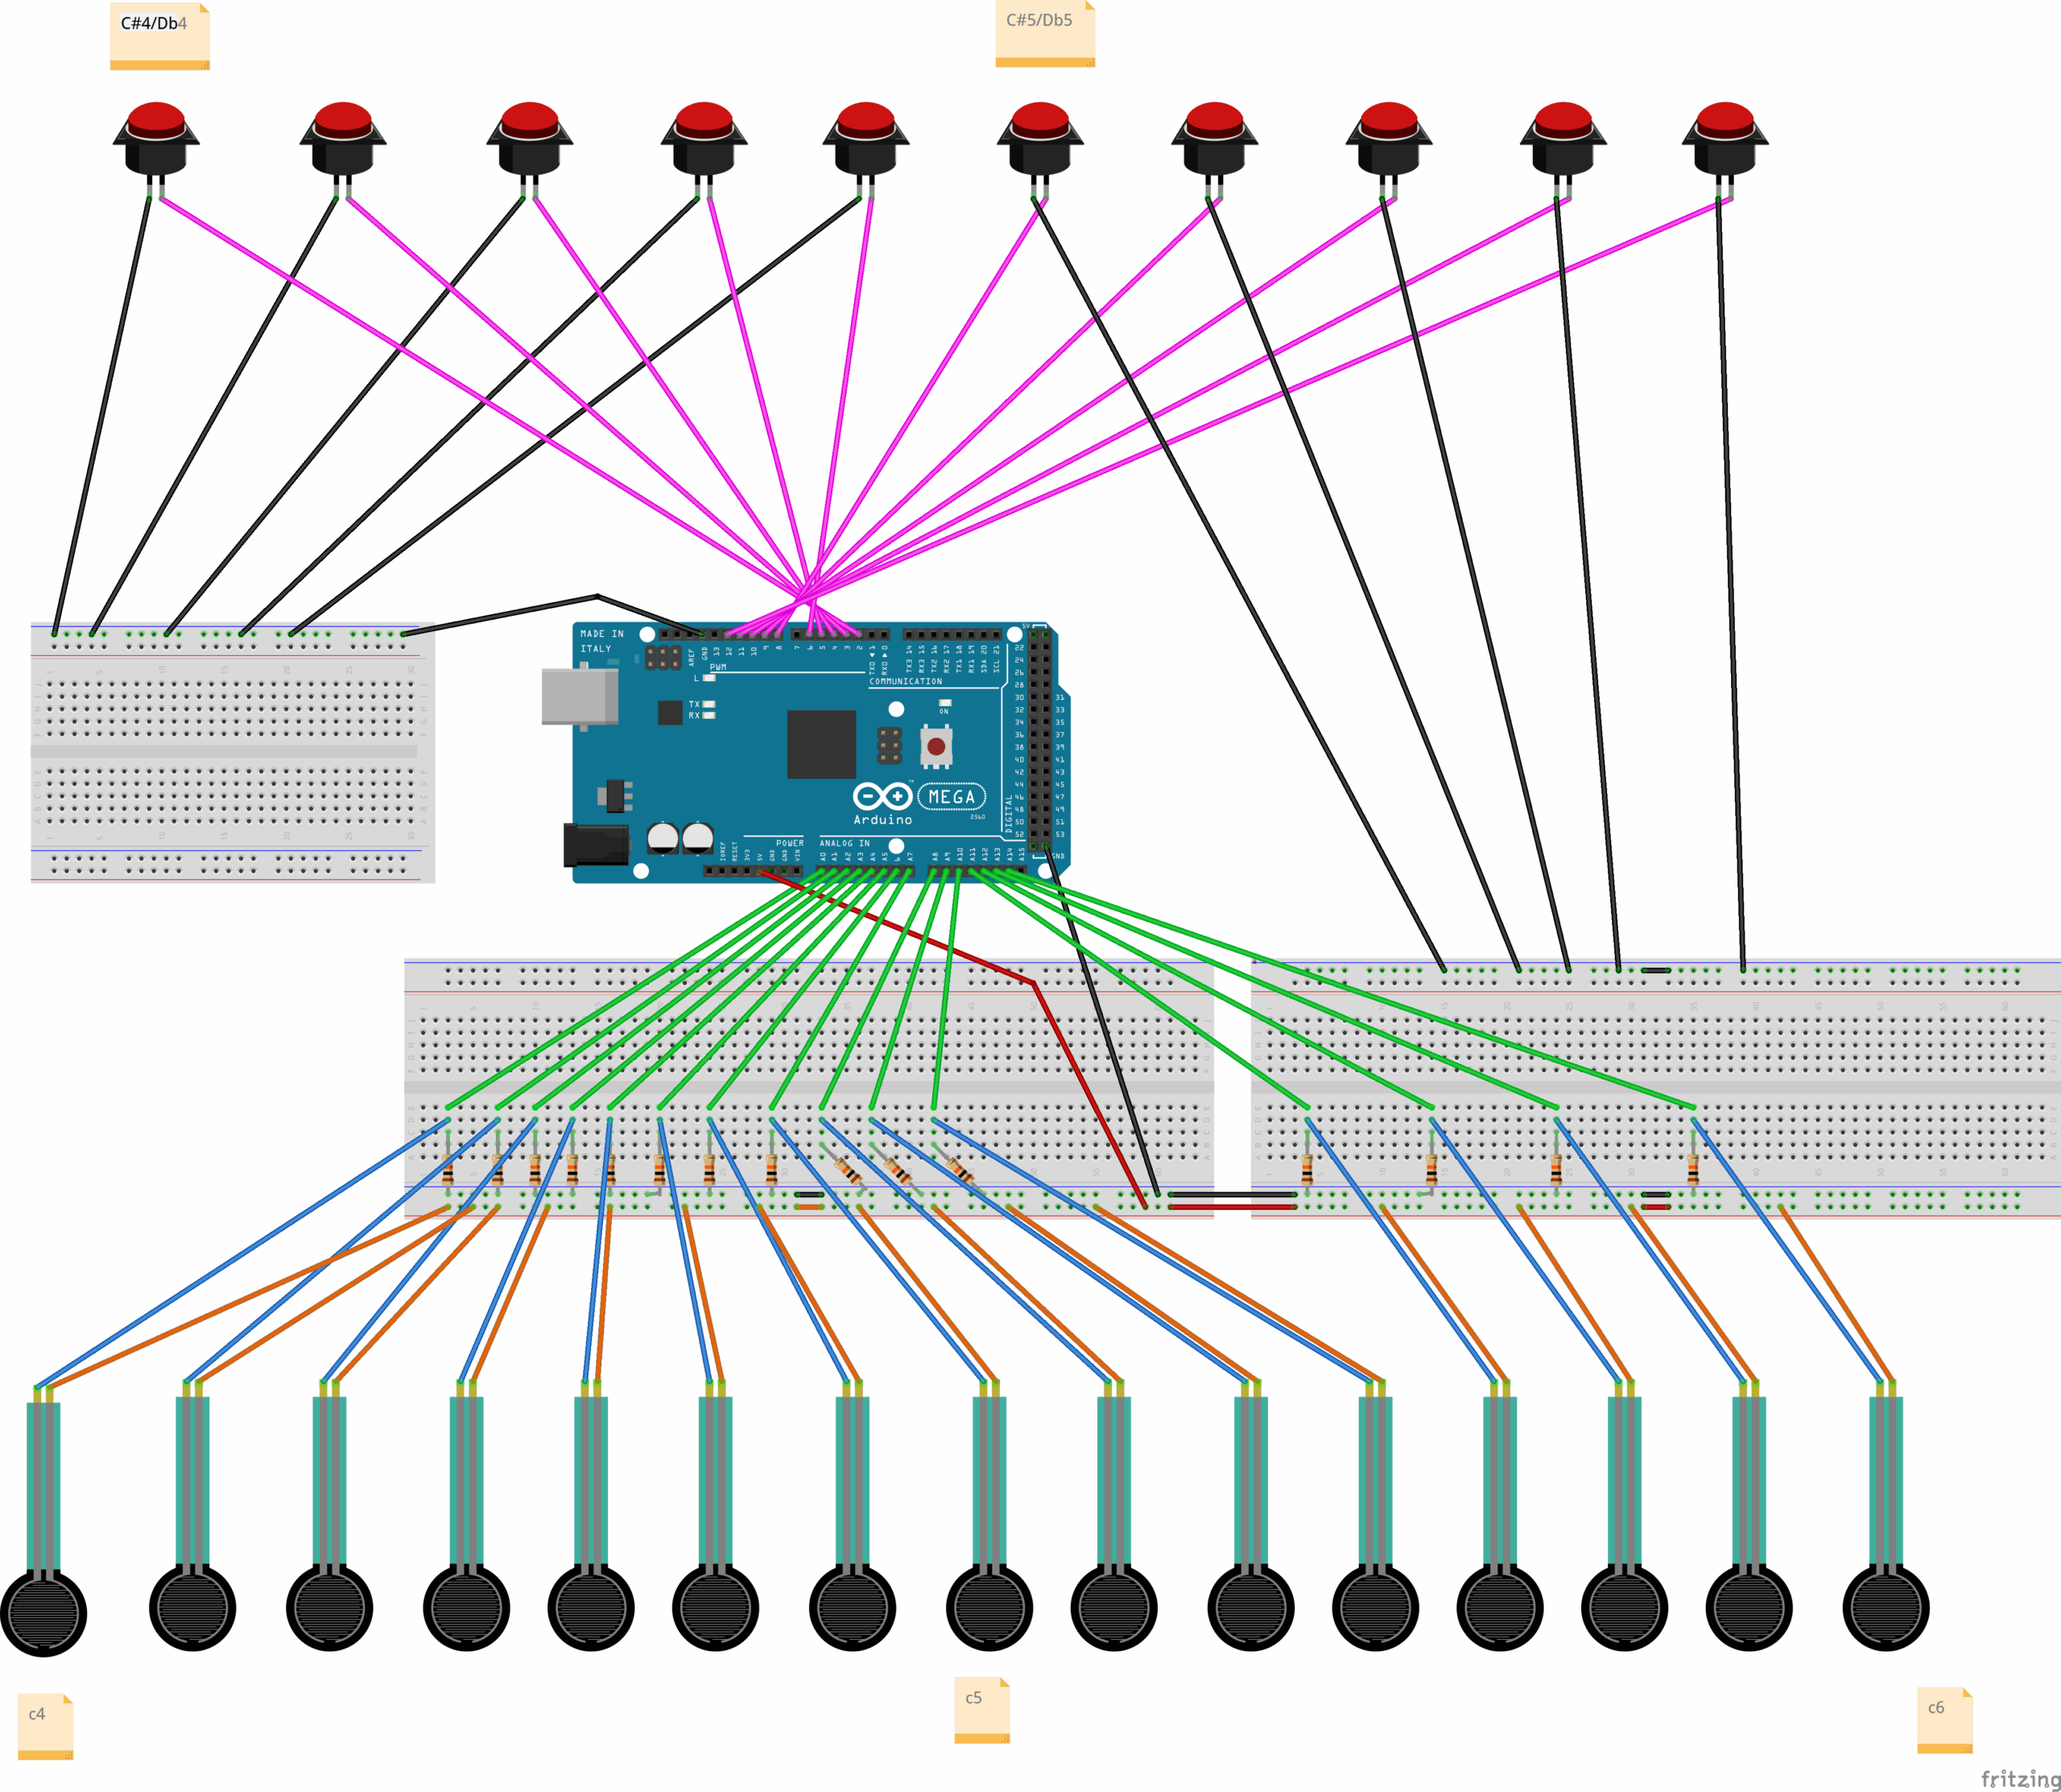
For hardware, I deliberately used an Arduino MEGA for its sufficient provision of analog pins. I used pins A0 to A14 for the force sensitive resistors and pins 2-6 as well as 8-12 for the push buttons. The schematic is attached.
For software, both Arduino software and p5js are used, with a one-way communication from Arduino to p5js. My Arduino sketch is linked here and my p5js sketch is linked here.
Notably, in addition to defining fsrPins and buttonPins arrays, theArduino code has string arrays “whiteKeyNames,” “blackKeyNames” as well as boolean arrays “whiteKeyPressedState” and “blackKeyPressedState” which stores the last sent state (true if pressed, false if released). The setup() function initializes the arrays. In the loop() function, white keys are processed with hysteresis, checking:
- IF FSR reading is above the press threshold but its pressed state was off before, currentActualStateIsPressed is TRUE
- IF FSR reading is above the release threshold and its pressed state was on before, currentActualStateIsPressed is TRUE
- ELSE IF FSR reading is not beyond the release threshold, currentActualStateIsPressed is FALSE
For stability, the black keys are processed with debouncing, which is about removing bouncing in contacts and delay is a timing feature.
Initially, I was inspired by this p5js template which uses WEBGL to create a 3D animation. In my case, orbitControl is enabled, allowing rotation and zooming in and zooming out. Notably, arrays of audio files (whiteKeyAudioFiles and blackKeyAudioFiles) as well as arrays of piano key objects (whiteKeyObjects and blackKeyObjects) help my code be concise and easier to manage. For organization purposes, “WhiteKey” class is stored in WhiteKey.js and “BlackKey” class is stored in BlackKey.js.
Using the template, I learned how to generate the animation: use an initial white key x-position (initial_wk_x = -375), set a white key spacing (white_key_spacing = 50) since they are spaced evenly on a real piano, and set dedicated black key x-positions [-350, -300, -200, -150, -100, 0, 50, 150, 200, 250]. Since I had more keys than the initial template, I had to edit the black key x-positions and the initial white key position.
In the communication from Arduino to p5, a string is sent line-by-line containing note name, followed by “=”, followed by note state (either 0 or 1 depending on if it’s considered pressed or not). activeSerialNoteStates is an important variable that stores the latest state (0 or 1) received from Arduino for each note name. Based on the current state of a particular key in activeSerialNoteStates, the handlePressEvent() and display() for that key is called.
function readSerial(data) {
  if (data != null) {
    let parts = data.split("=");
    if (parts.length === 2) {
      let noteName = parts[0].trim();
      let noteState = parseInt(parts[1].trim()); // Will be 0 or 1

      // Store the latest state sent by Arduino for this note
      activeSerialNoteStates[noteName] = noteState;
      // console.log("Received: " + noteName + ", State: " + noteState); // For debugging
    }
  }
}
4. Great Aspects of the Project
In terms of design, I think the color-coded strips are important and helpful indicators that guide the user on where to press given an instruction:
Crucially, an important challenge I faced in the project was using attaching wire to the FSRs in a way that would not damage them. Initially, I damaged two FSRs in my attempt to wire them. However, over time, I became more familiar on how to use the wire wrapping tool. Combined with soldering, taping, and attaching the FSRs to the circuit, this entire process was time-consuming, perhaps taking about 8 hours. Taping is so important, to prevent metal conductors from different wires touching each other and making connections that should not be made.
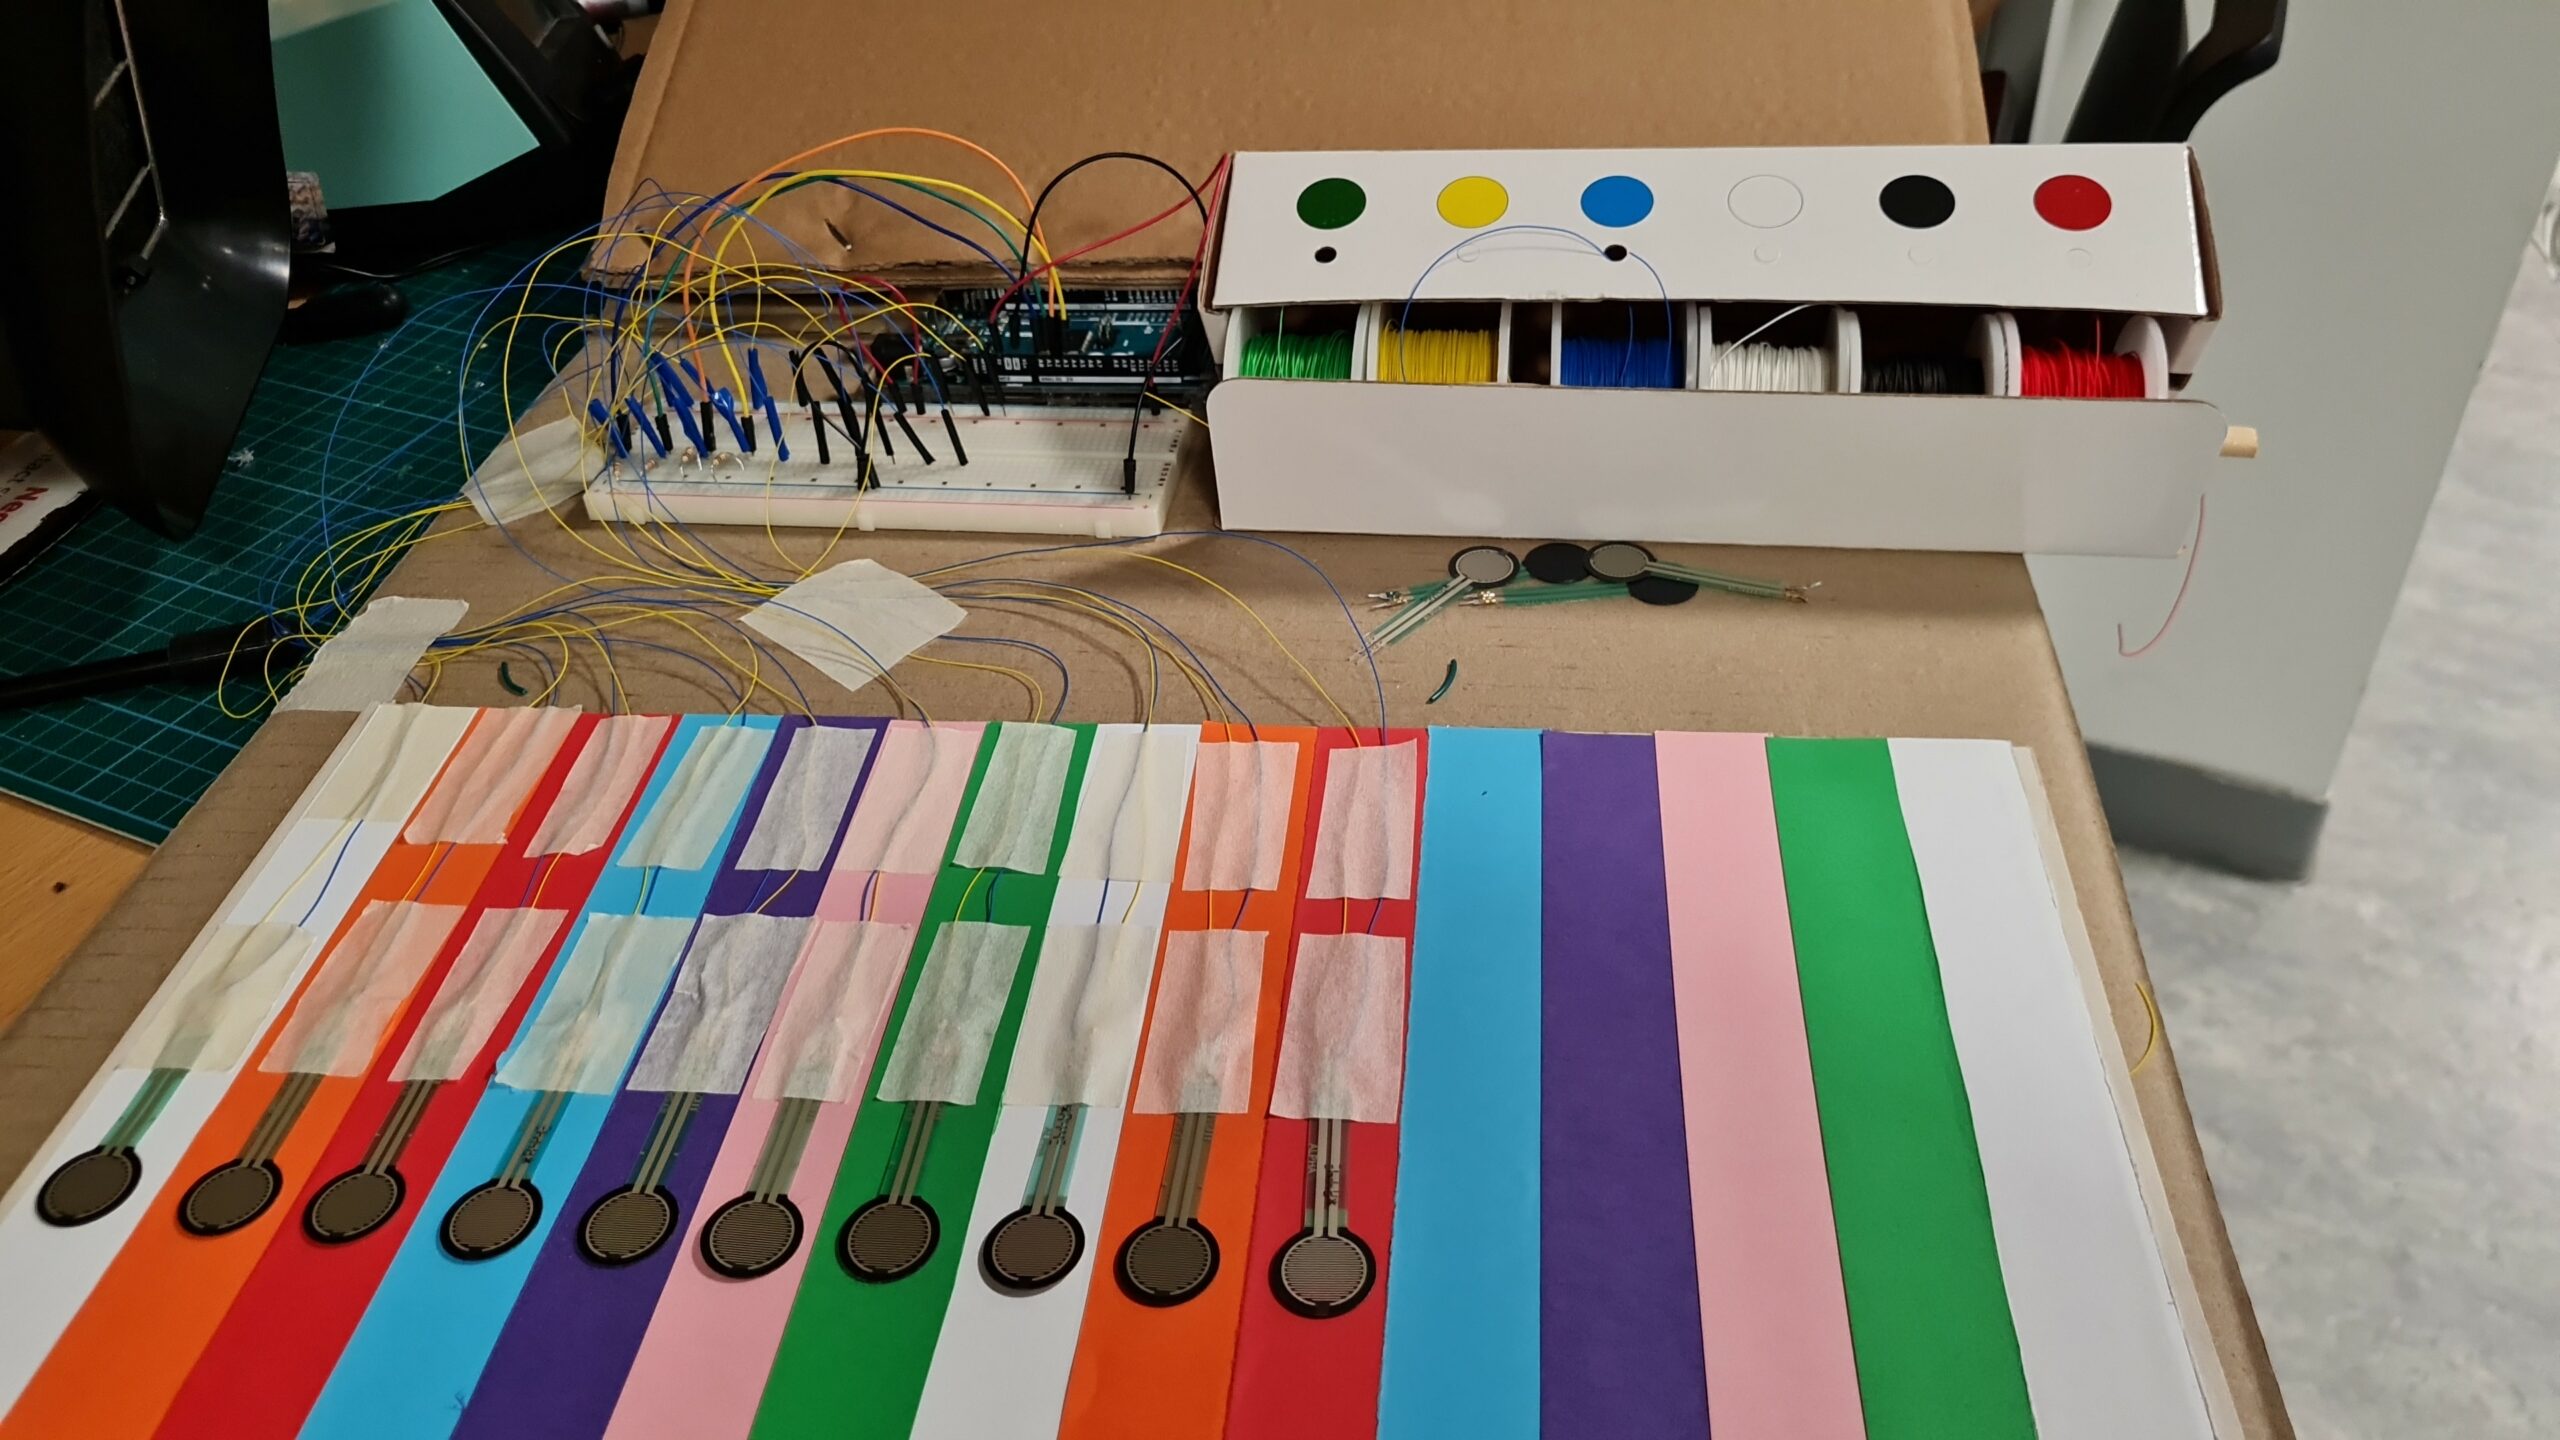
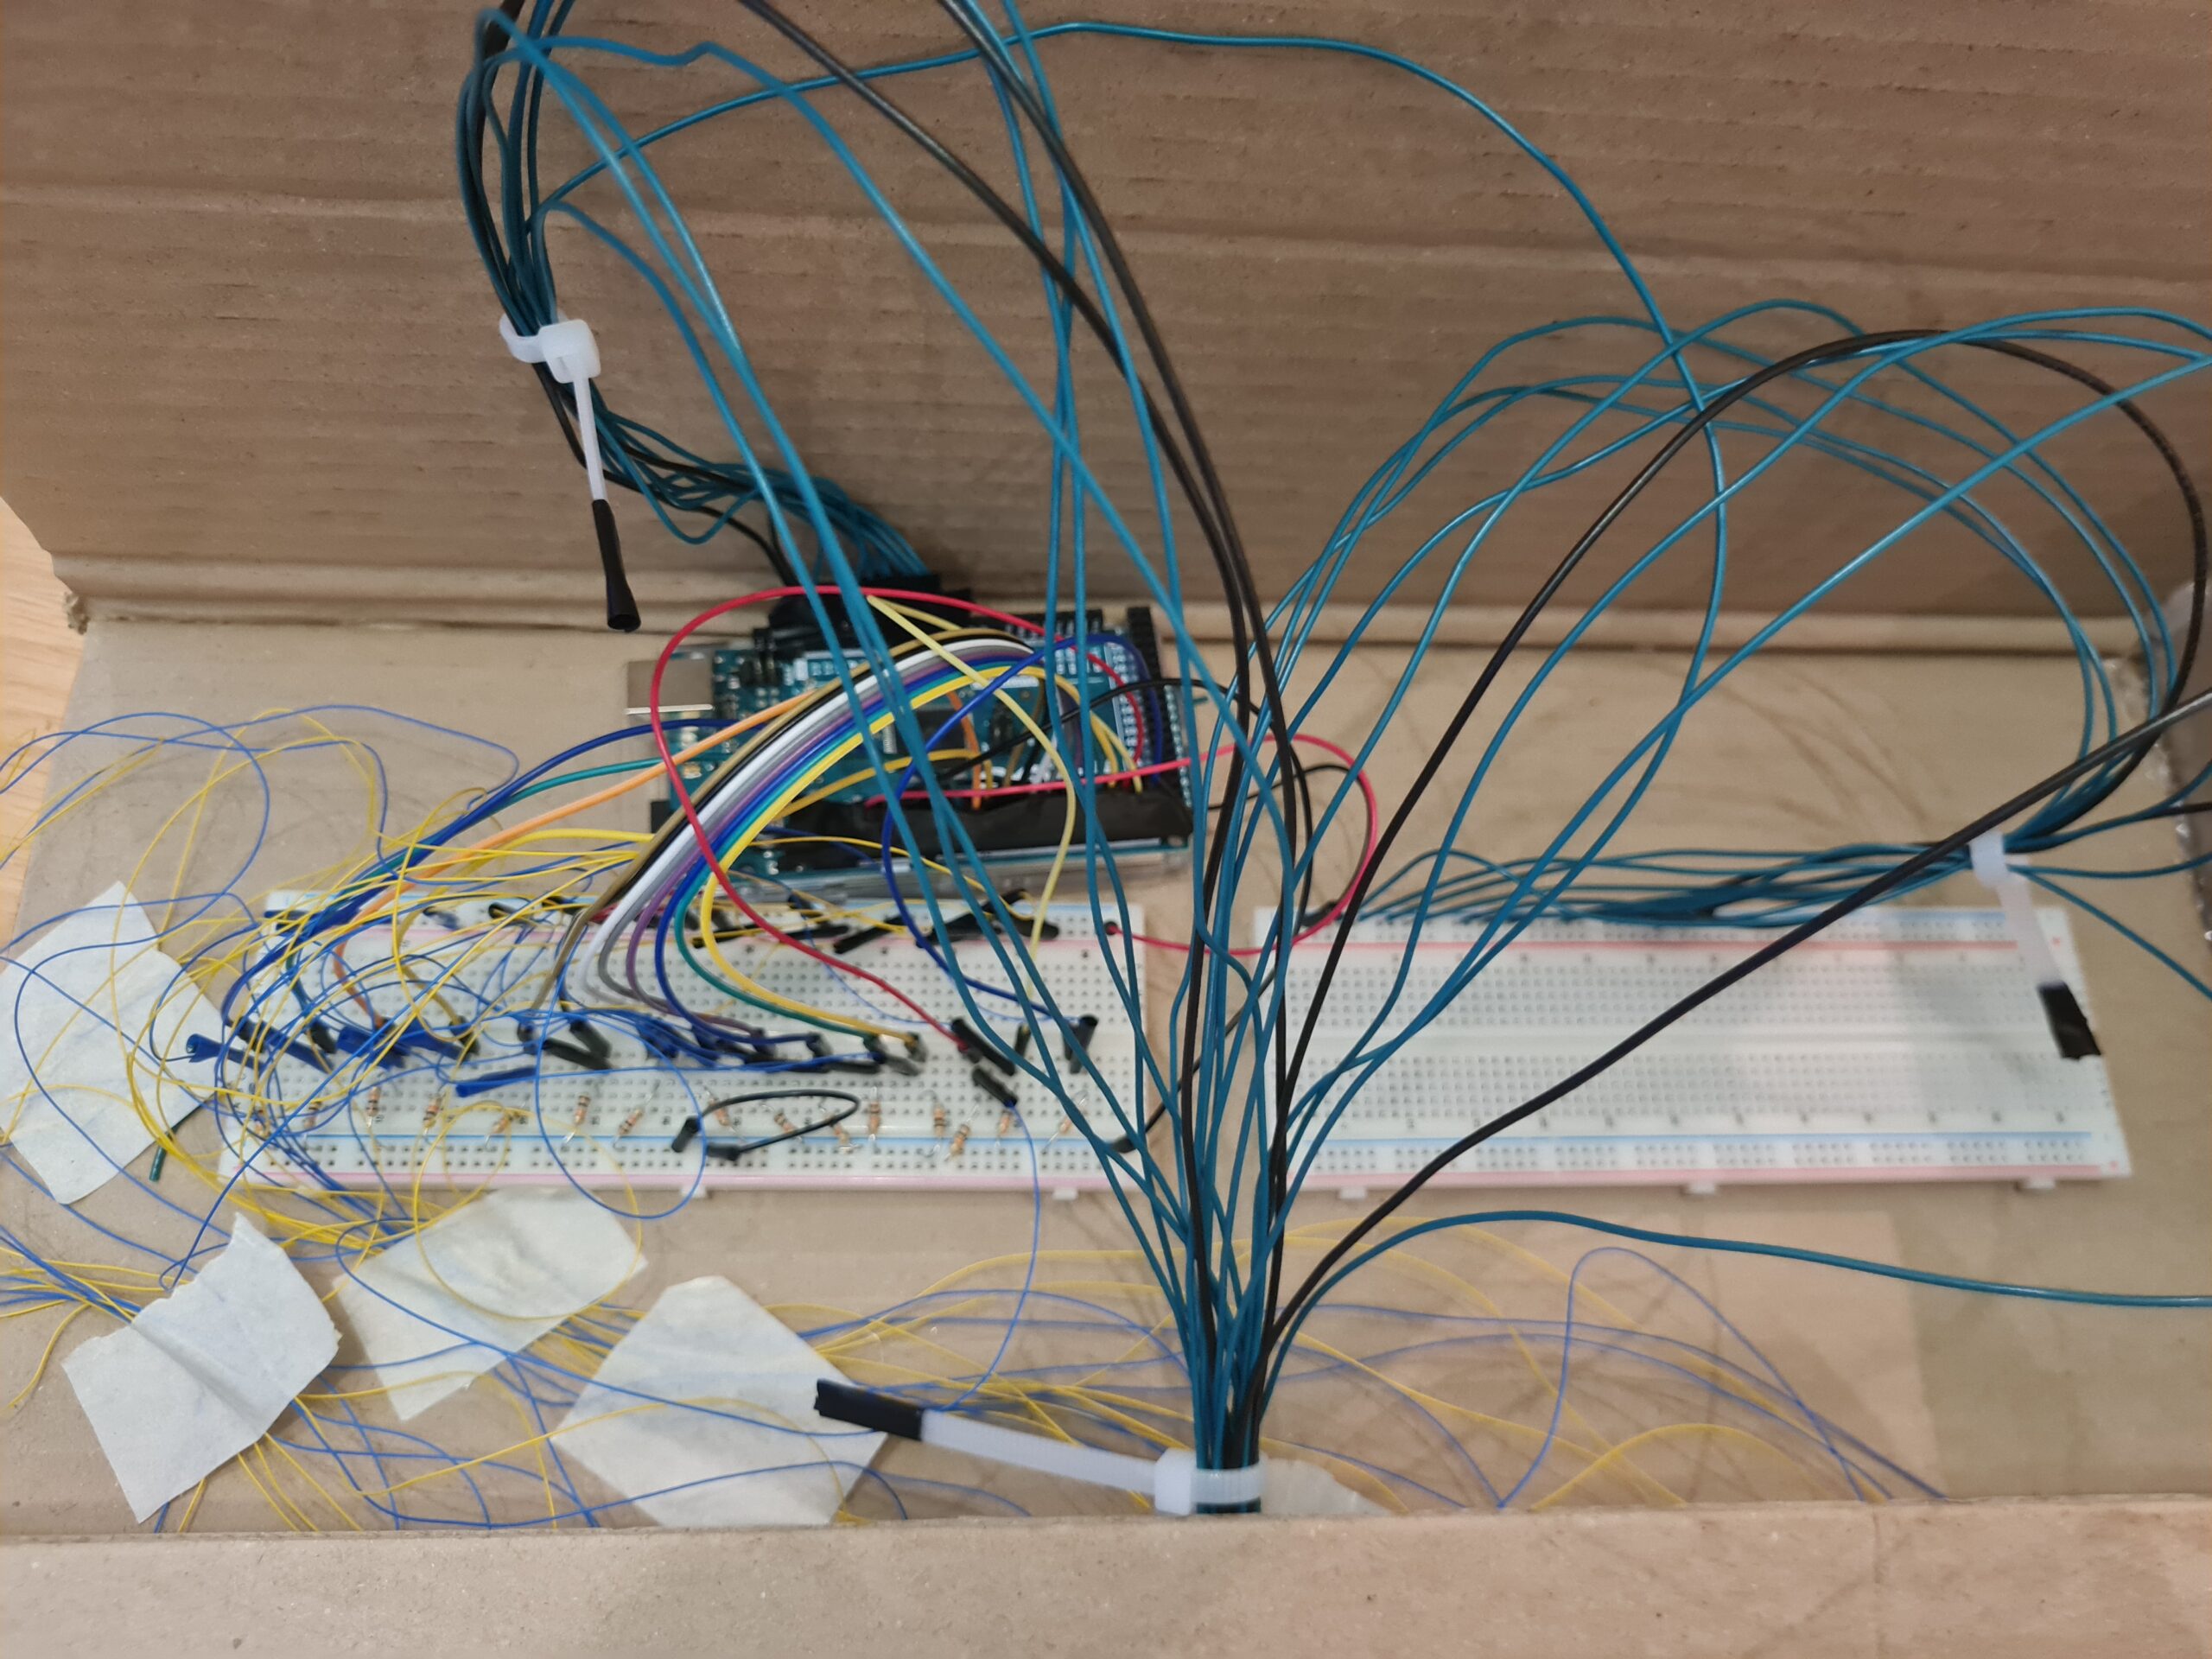
In terms of organization, the wires have been arranged neatly using a cable organizer:
As for code, the preload() function helped important audio, including the backing track and the piano key sounds to be prepared before the animation so they could be played on time. Moreover, a very critical challenge I faced was slow sound feedback after a key press. In my attempt to resolve this, I thought of factors that could be the issue, such as animation having a huge load. Using AI recommendation, I tried to reduce the load by increasing lerp(…, …, 0.2) to lerp(…, …, 1) – even if animation would be less smooth. However, this only reduced the feedback delay very slightly – it was still noticeable. I thought more, and realized I could try having Arduino do the checks of the FSR readings over the press threshold and then send the note state to p5(0 or 1) – instead of having p5 do the checks. I tried to revise the code manually at first, but faced disfunctionality, and used AI to help me. After having Arduino do the checks, the feedback delay issue was resolved! Through this experience, I learned how Arduino truly specializes in input/output (at least compared to p5js) really emphasizing the Professor’s words in class.
In terms of audio choice, I chose recorded sounds of pressed keys of an old piano which has volume that decreases over time, instead of digital MIDI sounds, to mimic a real piano experience more closely.
5. Future Improvement
In the future, the project could be expanded by weaving both visual arts and music into an interactive art gallery with rooms containing a visual scene with background music. Unlike a traditional art gallery, this art gallery comes with an “escape room” challenge: each art room is a phase of an “escape room” challenge for which users must interact with through musical jamming to reach the next phase (or proceed to the next art room). Once all phases are passed, the user successfully completes the escape room challenge! In this way, users should interact with every artwork in the art gallery if they are to pass this “escape room” challenge.
User decisions can be enabled by analog/digital sensors. For example, users can control an avatar using joysticks to move up, right, left, or down within the escape room setting (eg. a big treehouse). The user should use clues involving the visual artwork and the musical sounds heard from p5js to figure out a solution that involves jamming in a corrected/accepted way to pass the phase and reach the next phase. The jamming could be through a “piano” made with force sensitive resistors (FSR), each connected to a buzzer. The connection of each FSR to a buzzer is crucial as it enables multiple musical notes to be heard at the same time.
One of my hopes I had for this project is to help music be more beginner friendly – to simplify musical complexity through visual pairing. Novice players often struggle with abstract musical concepts like chords and rhythm patterns. To address this, each puzzle should pair auditory elements with direct visual analogs that guide interactions without requiring prior musical knowledge.
This approach aligns with research showing that visual scaffolding improves music theory comprehension by 42% compared to audio-only instruction 4.
There could be a three-stage learning progression across three phases:
-
- Pattern Recognition (Phase 1)
- Rhythm Matching (Phase 2)
- Emotional Association (Phase 3)
IMPORTANT: There should always be an option (eg. button) to restart solution provided for each phase.
Further details can be found here.
Blending an interactive art gallery, an escape room, musical learning, and physical computing could have a lot of potential for an engaging and memorable experience – and perhaps even more research on it for musical learning!