User Testing:
During user testing, the visuals weren’t clear in indicating what the project was for. The user mentioned that instructions to interact weren’t needed, but also that the purpose of the project wasn’t directly clear.
For technical improvements I adjusted the interval averaging to 8 samples, which improved stability but slightly delayed responsiveness. I also tested different tempoMul ranges (originally 0.2–3) and settled on 0.5–2 to keep the music and visuals within a comfortable range.
For my final project, I developed an interactive audiovisual experience that transforms a user’s heart rate into dynamic music and visuals, creating a biofeedback-driven art piece. Built using p5.js, the project integrates Web Serial API to read pulse data from an Arduino-based heart rate sensor, generating a musical chord progression (Cmaj7-Am7-Fmaj7-G7) and WebGL visuals (swirling ellipses and a point field) that respond to the calculated BPM (beats per minute). Initially, I proposed a STEM-focused feature to educate users about heart rate, but I pivoted to make the music and visuals adjustable via mouse movements, allowing users to fine-tune the tempo and visual intensity interactively.
The heart rate sensor sends pulse data to p5.js, which calculates BPM to adjust the music’s tempo (chord changes, bass, kick drum) and visual animation speed. Mouse X position controls a tempo multiplier (tempoMul), scaling both music and visuals, while BPM directly influences animation speed and audio effects. The visuals were inspired by p5.js data visualization examples from class, particularly those using WebGL to create dynamic, responsive patterns. The project aims to create a meditative, immersive experience where users see and hear their heartbeat in real-time, with interactive control over the output.
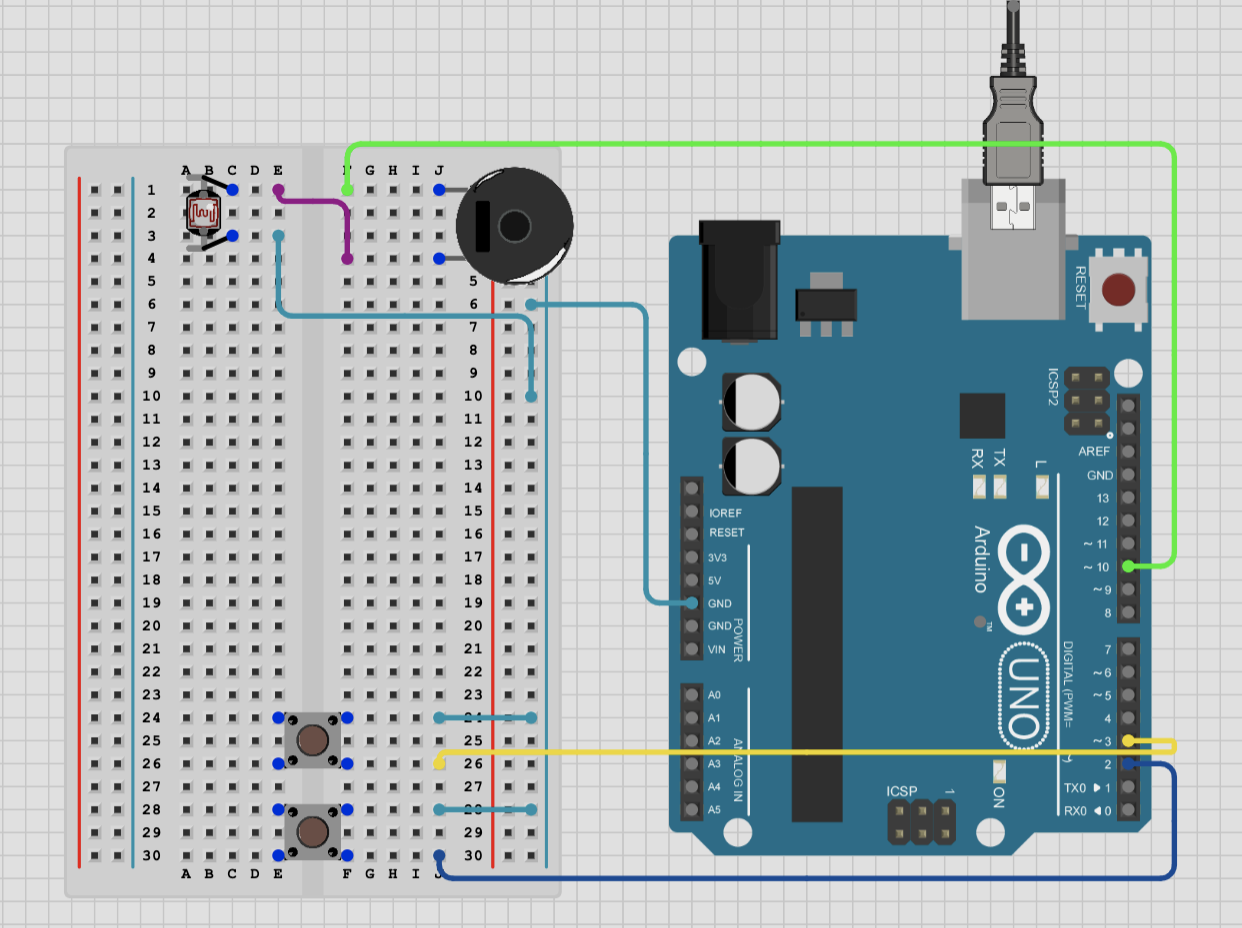
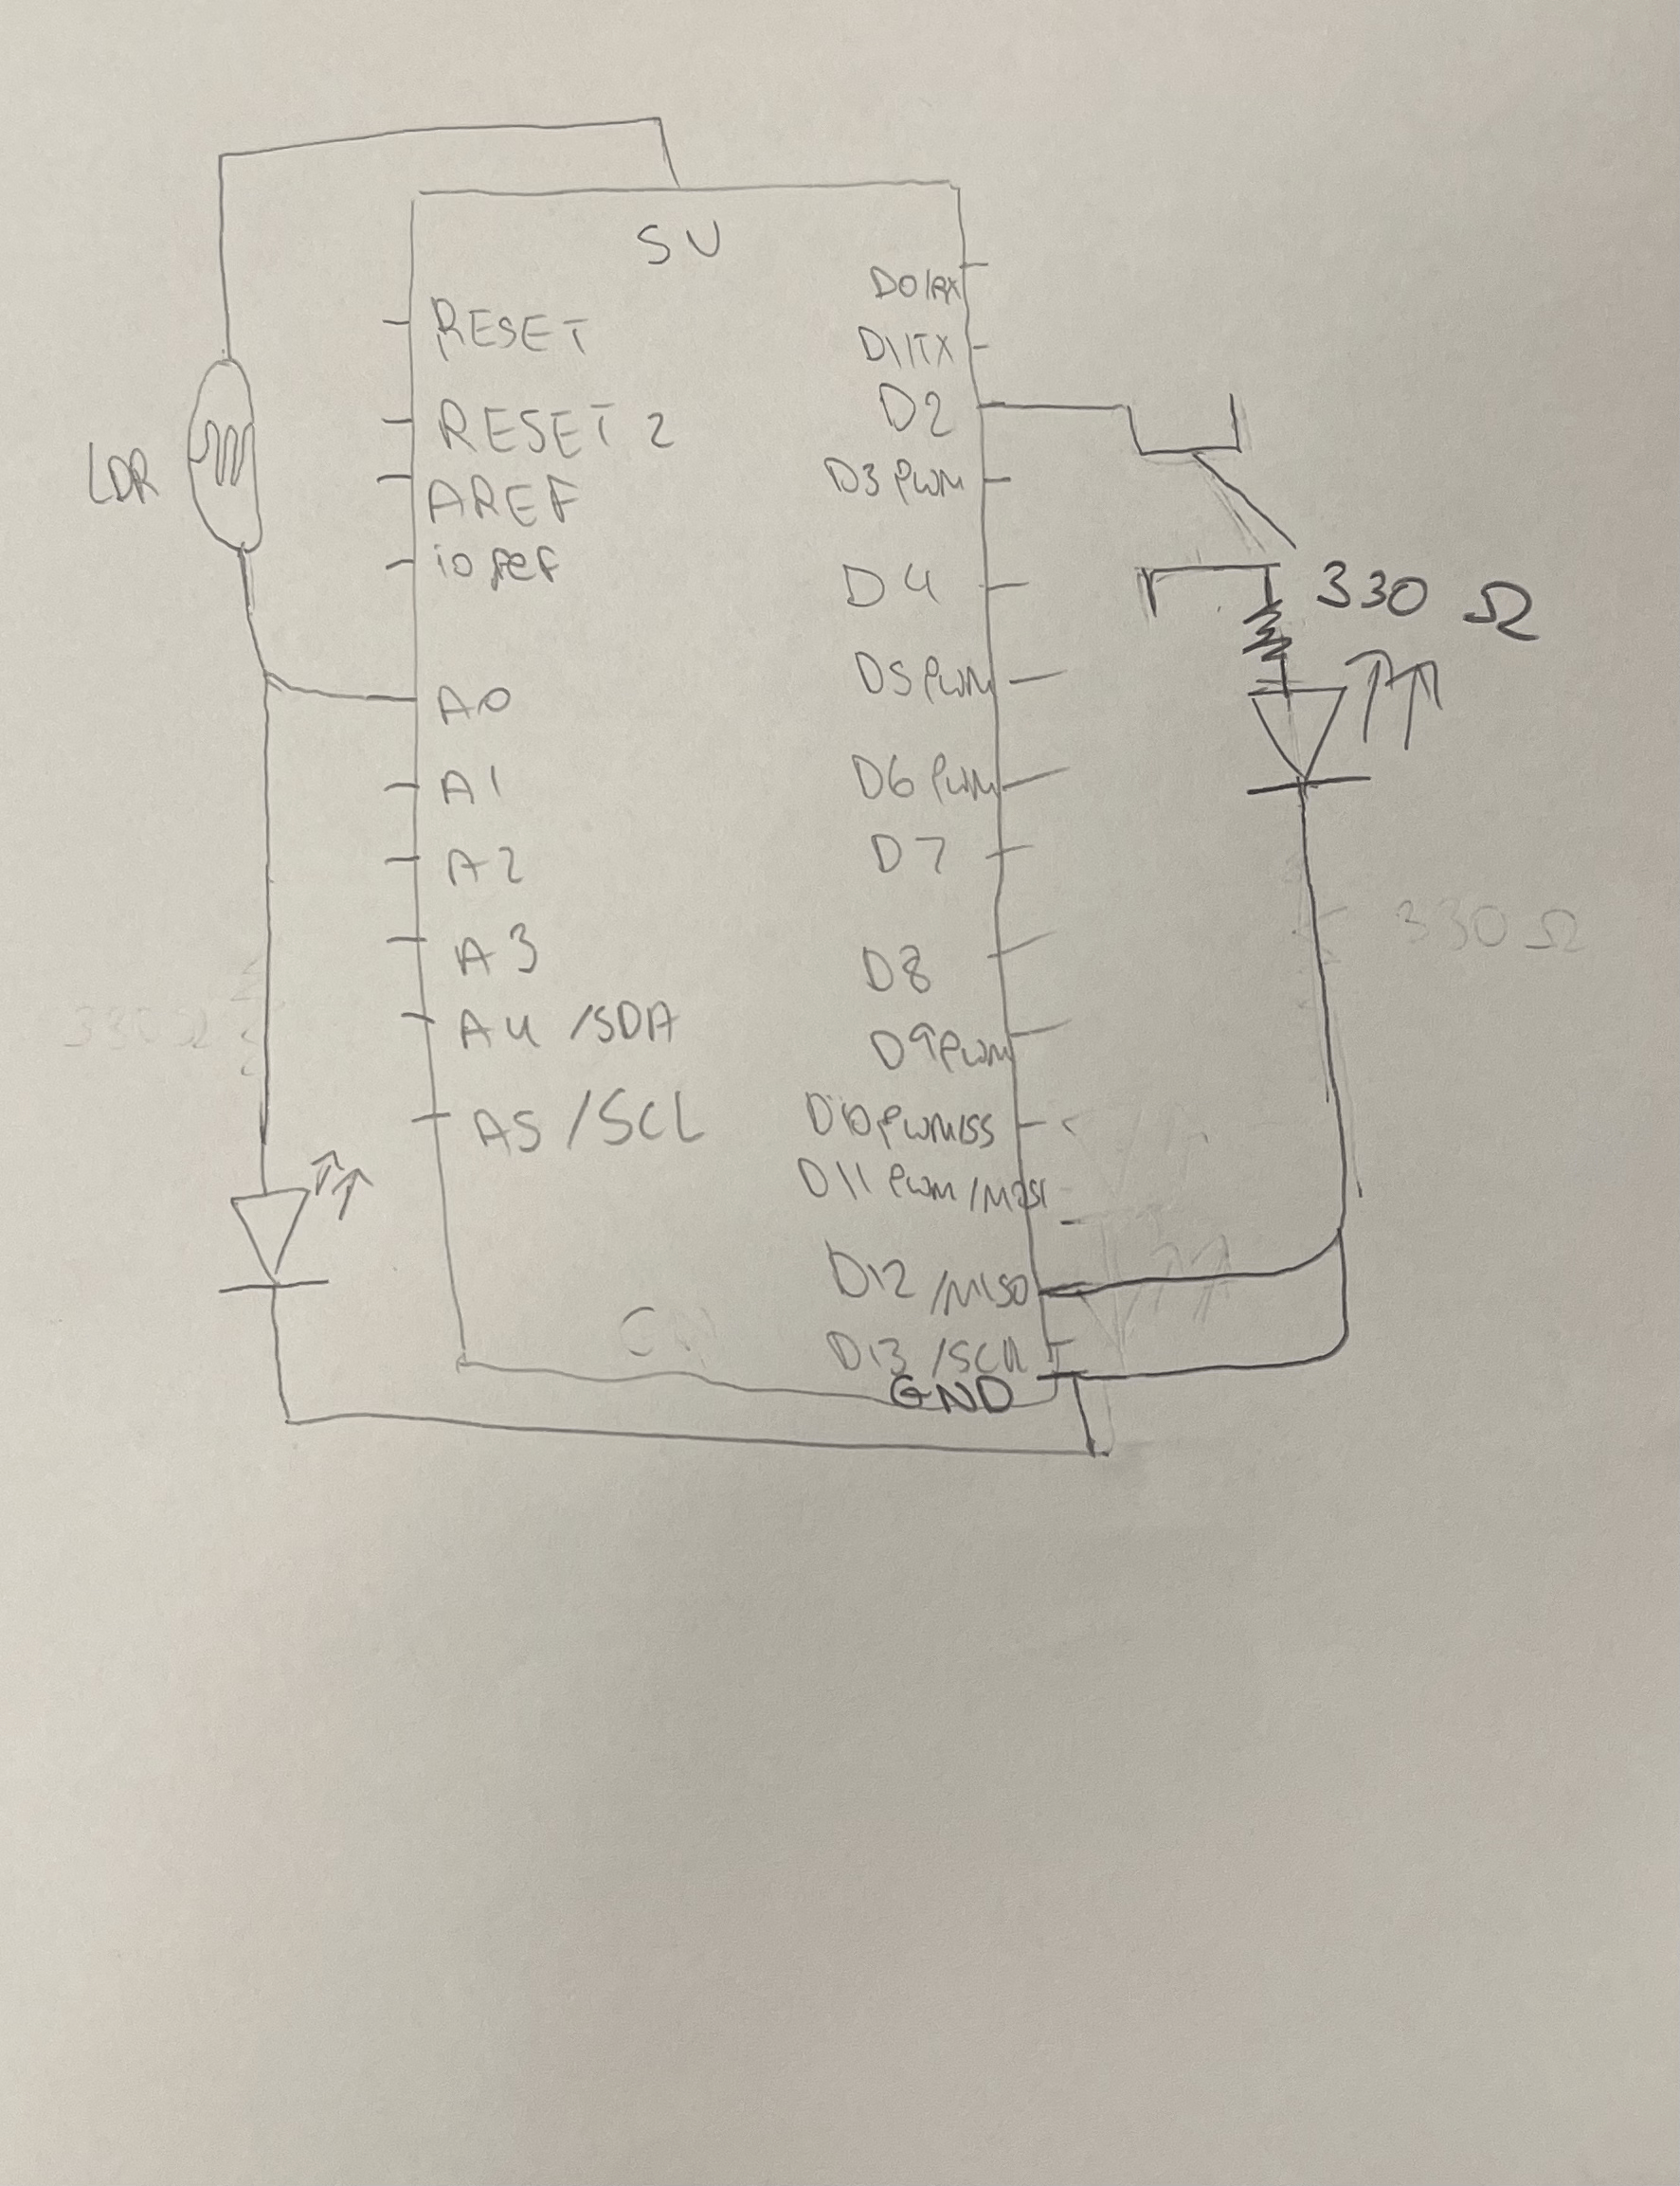
Hardware:
- Heart Rate Sensor: I used a PulseSensor connected to an Arduino Uno, wired directly to analog pin A0 without a resistor to simplify the circuit. The sensor is not attached and can freely be interacted with.
- Fabrication: I fit the arduino cable and heart rate sensor through the cardboard sparkfun box. I avoided a finger strap due to wire fragility and inconsistent pressure, opting for a loose finger placement method.
- Challenges: Direct wiring without a resistor may have increased noise in the pulse signal, requiring software filtering in the Arduino code. Loose finger contact sometimes caused erratic readings, so I adjusted the threshold and added a refractory period to stabilize detection.
The p5.js sketch reads serial data from the Arduino, calculates BPM, and updates music and visuals. Initially, I tried processing raw analog values in p5.js, but noise made it unreliable. After extensive debugging (around 10 hours), I modified the Arduino code to send pre-processed BPM estimates as integers (30–180 range), which streamlined p5.js logic. The mouse-driven tempoMul (mapped from mouse X) scales chord timing, note durations, and visual motion, replacing the STEM feature with an interactive control mechanism.
A significant challenge was balancing real-time BPM updates with smooth visualization. The visuals use the latest BPM, which can make animations appear jumpy if BPM changes rapidly. I averaged BPM over 8 intervals to smooth transitions, but this introduced a slight lag, requiring careful tuning. Serial communication also posed issues: the Web Serial API occasionally dropped connections, so I added robust error handling and a “Connect & Fullscreen” button for reconnection.
Arduino Code (Heart Rate Sensor):
#define PULSE_PIN A0
void setup() {
  Serial.begin(9600);
  pinMode(PULSE_PIN, INPUT);
}
void loop() {
  int pulseValue = analogRead(PULSE_PIN);
  if (pulseValue > 400 && pulseValue < 800) { // Basic threshold
    Serial.println(pulseValue);
  } else {
    Serial.println("0");
  }
  delay(10);
}
Images
The seamless integration of heart rate data into both music and visuals is incredibly rewarding. Seeing the ellipses swirl faster and hearing the chords change in sync with my heartbeat feels like a direct connection between my body and the art. I’m also proud of overcoming the Arduino noise issues by implementing software filtering and averaging, which made the BPM calculation robust despite the direct wiring.
Challenges Faced:
- Arduino Code: The biggest hurdle was getting reliable pulse detection without a resistor. The direct wiring caused noisy signals, so I spent hours tuning the THRESHOLD and REFRACTORY values in the Arduino code to filter out false positives.
- BPM Calculation: Calculating BPM in p5.js required averaging intervals (intervals array) to smooth out fluctuations, but this introduced a trade-off between responsiveness and stability. I used a rolling average of 8 intervals, but rapid BPM changes still caused slight visual jumps.
- Visualization Balance: The visuals update based on the latest BPM, which can make animations feel abrupt if the heart rate spikes. I tried interpolating BPM changes, but this slowed responsiveness, so I stuck with averaging to balance real-time accuracy and smooth motion.
- p5.js Visualization: Adapting WebGL examples from class to respond to BPM was tricky. The math for scaling ellipse and point field motion (visualSpeed = (bpm / 60) * tempoMul) required experimentation to avoid jittery animations while staying synchronized with the music.
- Serial Stability: The Web Serial API occasionally dropped connections, especially if the Arduino was disconnected mid-session. Robust error handling and the reconnect button mitigated this, but it required significant testing.
Possible Improvements:
- Smoother BPM Transitions: Implement linear interpolation to gradually transition between BPM values, reducing visual jumps while maintaining real-time accuracy.
- Dynamic Color Mapping: Map BPM to the hue of the ellipses or points (e.g., blue for low BPM, red for high), enhancing the data visualization aspect.
- Audio Feedback: Add a subtle pitch shift to the pad or bass based on BPM to make tempo changes more audible.
- Sensor Stability: Introduce a clip-on sensor design to replace loose finger placement, improving contact consistency without fragile wires.
Reflection + Larger Picture:
This project explores the intersection of biofeedback, art, and interactivity, turning an invisible biological signal (heart rate) into a tangible audiovisual experience. It highlights the potential of wearable sensors to create personalized, immersive art that responds to the user’s physical state. The data visualization component, inspired by p5.js examples from class (e.g., particle systems and dynamic patterns), emphasizes how abstract data can be made expressive and engaging. Beyond art, the project has applications in mindfulness, where users can regulate their heart rate by observing its impact on music and visuals, fostering a deeper connection between the body and mind.