Week 5 – Reading Reflection

What really  really surprised me most is how little of computer vision is actually about smart code. Frame differencing and background subtraction are pretty dumb algorithms on their own nothing like how a human eye and brain read a scene using memory and context. Levin’s whole point is that you make the physical world more predictable instead like backlighting a silhouette and retroreflective material. That is the technique doing the work that smarter software would otherwise have to do, which changes how I used to think about computer vision as something you solve purely in code.

The surveillance question is where this got more complex for me. Suicide Box is unsettling specifically because frame differencing was enough to passively record something as serious as someone jumping off a bridge. It is not sophisticated AI which somehow makes it feel more invasive, like tragedy got reduced to a pixel threshold. Sorting Daemon and Standards and Double Standards push that further since both use the same basic tracking logic as their actual material, sorting or following people without consent. What struck me is that the exact techniques Levin teaches as beginner friendly are structurally identical to what gets used for surveillance. The difference is not code sophistication but intent and whether people know its happening.

That made me think differently about using webcam input in Hydra (in my live coding class i took last semester). I have treated camera feeds as just another visual source to feed into feedback loops without thinking much about it. After this, a simple motion detector pointed at a crowd is doing the same basic operation as Sorting Daemon, so if I use webcam tracking live going forward I want people in the room to actually know they are part of the input instead of just grabbing frame differences because it looks wayyy cooler!!!!

W4 – Data Visualisation

Concept

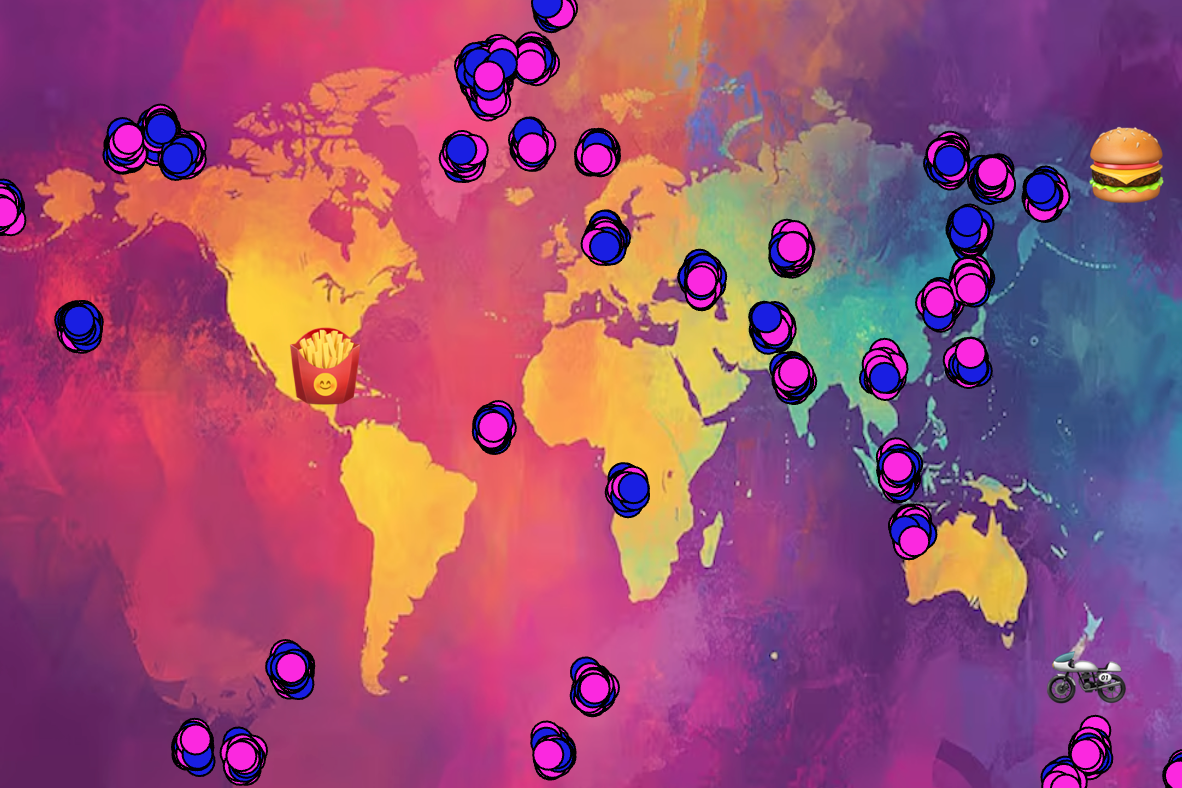
One click can send an order around the world. I was inspired by the idea of online shopping and how orders come from people all around the world. The map visually represents online shopping, while the different colored dots show the locations and gender of customers.

Highlighted code

//drawing the circles
for (i = 0; i < numRows; i++) {
  let circleX = map(lng[i], -180, 180, 0, width);

  let circleY = map(lat[i], -90, 90, height, 0);

  circle(circleX, circleY, 15);

  if (Gender[i] > 1) {
    noStroke()
    fill(24, 30, 226, 60);
  }
  if (Gender[i] < 2) {
    fill(251, 40, 223, 60);
  }
}

I am most proud of this section of code because I struggled a lot with aligning the dots to the map. It required a lot of trial and error to get the locations mapped correctly. There is still a slight misalignment, but compared to where I started, it is much better.

This is what it looked like initially.


How this was made

I applied what we learnt in class about uploading datasets. I made sure to upload it in the correct data file as a .csv and checked my data for any gaps. I then uploaded an image of a colorful map to use as the background. I chose the vibrant colors because I thought they would work well with the blue and pink circles. It was also important to map the data correctly and choose a suitable canvas size. I chose 600×400 because it best matched the shape of the map. The blue circles represent male customers, while the pink circles represent female customers. I intentionally made them slightly transparent so the viewer could see where the circles overlap. I then added another layer by including moving emojis that relate to online orders, such as shipping boxes and delivery bikes.

Reflection

Overall, I think I did a good job applying what we have learnt in class. However, in the future, I would love to explore ideas such as having text appear when hovering over certain areas of the map, or adding percentages to show the differences between continents. This could make the map more interactive and help the viewer understand the data more easily.


Reading Reflection

What I found most interesting about this reading was how Norman explains that when something is difficult to use, it is not always the user’s fault. I usually get annoyed when I cannot figure out how something works, but the reading made me realize that the design itself can be the problem. Things like signifiers and mapping are meant to make it clear what you can do and what will happen when you interact with something.

I can definitely see how this applies to interactive media because users should not have to spend a lot of time figuring out how something “works”. Buttons, icons, animations, and other interactive elements should give people clues about what they do. I also liked the idea that designers should expect people to make mistakes instead of assuming everyone will use something perfectly. It made me think more about how small design choices can completely change how easy or frustrating an experience is.

One thing I will take away from the reading is that good design should feel almost obvious to the person using it. If I have to stop and think about what a button does or how something works, there is probably something about the design that could be clearer. This is something I want to pay more attention to when creating my own interactive projects.

Reading Reflection 3

Reflection:

Something as simple as opening a door shouldn’t make me to stop and question myself, and I think sometimes it does. I think this is what stood out to me most from this reading.

I found his discussion about confusign doors interesting because it made me realize how often we blame ourselves on things that werent even properly designed for us in the first place. Like his idea that every objects should tell us how they work without us having to keep trying and failing over and over again.

This brought me back to the idea of video games, and some how games make everything feel natural. You see a door, you go to it, you know how to interact with it. But sometimes you encounter a game that has so many menus that you spend more time figuring out how to do something instead of actually enjoying the game itself.

I think this is where design starts to lose its purpose, and what really changed my perspective was his idea of human centered design, technology should dapt to how people actually behave instead of expecting people to become perfect for it.

The way this made me reconsider my future projects is that I want to make stuff and things that people can understand without having to explain every little thing. Maybe changing the cursor, or adding small visual cues, or making interactions respond immediately to make things more natural.

Assignment 4 – Growth Rings

Growth Rings

Concept:

So my first idea when I saw for this was to make a portrait of Sheikh Zayed out of the data. Not just drawing him but like make the data itself make up him, his face is built from the numbers. But unfortunately it didn’t work, two times and the dots kept going all over the place and wouldn’t align and I just couldn’t proceed with my vision.

But then I had an idea, I remember watching a short video by Science Nation and it was about how tree’s are, specifically their trunks and how you can literally tell its whole life chart just by looking at the Growth Rings. These rings come out one pear year, wide in a good year with lots of rain and thin in a bit one, you can literally see everything about the tree and its like data visualization but like a more primitive one.

So I decided to do the same, one ring per year since 1971 the founding of our country, the width of the ring is how much the population grew that year in general. The founding is in the middle of the tree andthen today is at the bark which is the outer layers of the tree.

Highlighted Code:

noStroke();
for (let i = ringRadius.length - 1; i >= 0; i--) {
  if (i >= ringsGrown) {
    continue;
  }
  if (year[i] <= zayedLastYear) {
    fill(zayedWood[0]);
  } else {
    fill(laterWood[0]);
  }
  ellipse(centreX, centreY, ringRadius[i] * 2, ringRadius[i] * 2);
}

I think this is the one I’d want to show you first, because its the thing the entire thing relies on and it might not be obvious just looking at it but it is.

So this is everyone of those 54 rings, each of them is a filled circle and they are drawn the biggest first and then each circle covers up the middle and the one before it. So whats left of each is circle is only the small thin band around its edge and that band is what you use to read it as a ringe. And its also how a real trunk works! The old wood is on the inside, the old on the outside.

Thats why I made the loop go backwards here, if it counted up the way loops normally do then the small circles would go down first andthen get completely buried by the big ones and you’d just have a big brown circle.

The continue is the animation itself, so any ring thats further out than the tree thats grown, gets skipped so the trunk just fills in from the middle and goes outwards.

ringsGrown = (frameCount - framesAtStart) / framesPerRing;

if (ringsGrown >= ringRadius.length) {
  ringsGrown = ringRadius.length;
  stillGrowing = false;
}

function mousePressed() {
  ringsGrown = 0;
  stillGrowing = true;
  framesAtStart = frameCount;
}

This is also a huge part of the animation. frameCouint essentially counts every frame since the sketch starts and so it divides it by the ‘frames per ring’ gives it a slow and steady build up. The reason I take framesAtStart away is replaying, frame count is never going to reset so on a second run it might be at 4000 and if I dont subtract it the tree would appear grown instantly. The mouse pressed part is essentially setting framesAtStart to whatever the frame count is at that time and puts it back at zero and restarts it again.

let distanceFromCentre = dist(mouseX, mouseY, centreX, centreY);

let found = -1;
for (let i = 0; i < ringRadius.length; i++) {
  if (found === -1 && ringRadius[i] >= distanceFromCentre) {
    found = i;
  }
}


noFill();
stroke(paper[0]);
strokeWeight(1.6);
ellipse(centreX, centreY, ringRadius[found] * 2, ringRadius[found] * 2);


noStroke();
fill(ink[0]);
rect(width - 262, 156, 166, 54, 4);
fill(paper[0]);
text(year[found], width - 248, 182);
text(addCommas(population[found]) + " people", width - 248, 200);

Once the tree finished growing you could hove over the rings and it tells you the year and the population at that time, I think I’m really proud of this cause the aesthetic it came out as was really nice.

So it only needs to know how far your mouse is from the middle and not which directio your in, cause all of the rings are circles around the same centre so pixels that are 240 out from the middle is 2020 regardless of whether your above the trunk or off to the left.

The loop then starts to go outwards and goes from the centre and finds the first ring that reaches past the mouse. That ring is essentially the one your on. Found starts at -1 which essentially means nothing was found yet at the time and the found === -1 check essentailly stops the loop from overwriting the answer constantly once it already has one.

After that it draws the ring again in a white color so you can see which ring you picked and fills the box in with year and the population.

The box stays in the same corner instead of following the mouse, before I had issues that for some reason it would follow the mouse and kept covering everything and was a mess.

Stuff we didn’t cover:

– Continue: I used it in a for loop, essentially skips the rest of the lap and jumps straight to the next one. I got this after AI helped me with finding the concept of Continue, it doesn’t even have a page for it, I had to look up a tutorial online for Java. Its a nice tutorial, its pretty old though.

– Return: although we did use it in the class, I don’t believe we used it in the context I was using it in. I used it to leave a function early, kind of similar to how I’d do it with python.

How was this made?

  • So essentially the three arrays line up with eachother, the year, the population and ringRadius. The fourth one is all three is in the same year. Arrays are the columns and the index is the row and its the parrallel arrays I learned from last assignment on my own.

    The trunk essentially draws from the outside in, so it goes biggest circle first and each one covers the middle of the last, so any of the circle you see is at the band at the edge and the band is the ring. This was to take on the effect of wood, new wood outwards, old ones inwards.

    The animation is one line so as I said before, ringsGrown is framecount minus framesAtStart divided by framesPerRing so it goes from 0 to 55 andthen it stops andthen everything just ignores rings past that specific number.

    I then also brought in the font which is Rakkas, its a nice arabic one that has a nice arabic font even when english is being typed up. It looks nice.

    References: Data is directly from the World Bank, and the idea I used behind this is from the science of reading tree rings which is dendrochronology.

    Use of AI: I used ChatGPT to help me find bugfixes, learn from certain stuff and understand many specific concepts.

  • Reflection
  • I think the hardest part of this wasn’t just the drawing. I think its coming up and formulating how the entire idea is going to come together and what maps onto what. The code that turns the data into the picture is literally four lines and everything else is literally labels and colours. All the thinking went into choosing that the radius should be the population and that one choice is what makes the gaps come out as the growth of the tree itself and also what causes the 2020 problem where I wasn’t able to highlight it at all.

    I think what I’d change is that it would still be one number over time and that a country isn’t just one number. I think I’d want to change something about who and not just how many. And I think one day I’d want to go back and give the portrait a try one day, it was just sad it didn’t work out.


Week 4 Production Assignment – M7md

Concept

For this assignment, I wanted to create a data visualization that did not look like a normal graph or chart. I used a Pokémon  dataset containing Pokémon  from Generations 1-6 and focused on their types and base stats. Each Pokémon is represented by a moving ribbon. Different parts of the Pokémon’s data control different parts of the visual:

  • HP changes the thickness of the ribbon
  • Attack changes how much it bends
  • Defense changes how smooth the movement is
  • Speed changes how quickly it moves
  • Type 1 controls the main color
  • Type 2 adds a second color if the Pokémon has another type

Clicking the sketch chooses a random Pokémon from the dataset.

I also wanted to experiment with sound, so I used Estrellita by Manuel. Ponce, using the violin and piano arrangement credited to Jascha Heifetz in the video I used. The loudness of the music affects how much the ribbon moves, while the Pokémon’s speed stat slightly changes the playback speed of the song.

I choose Estrellita because I liked how the softer music worked with the movement of the ribbon. I also considered using the Pokémon Theme Song, which has a stronger rhythm and would probably produce a much more energetic result.

Code I Like

One part I liked was connecting the Pokémon stats to different properties of the ribbon.

let ribbonThickness = map(currentHP, 1, 255, 40, 120);

let curveAmount = map(currentAttack, 1, 190, 40, 130);

let ribbonSmoothness = map(currentDefense, 1, 230, 0.03, 0.01);

let moveSpeed = map(currentSpeed, 1, 180, 0.002, 0.012);

I liked this because every Pokémon uses the same system, but the result changes depending on its stats.

Another part I liked was how I connected the music to movement:

let musicLevel = amplitude.getLevel();

smoothMusicLevel = lerp(smoothMusicLevel, musicLevel, 0.045);

let musicMovement = map(smoothMusicLevel, 0, 0.08, 0, 50);

Cause initially the ribbon reacted too suddenly to every small change in the music. I used lerp() to make the value move gradually toward the new music level instead.

How Was This Made?

I started by loading the Pokémon CSV file and keeping only the columns I needed: name, types, hp, attack, defense and speed. The stat values from the CSV file were text, so before using them in calculations I converted them to integers using int().

For the Pokémon type colors, I used an object with key value pairs:

let typeColors = {
  Normal: "#b7b2a8",
  Fire: "#d96c4a",
  Water: "#5d8fbf"};

Which let me use the Pokémon’s type as the key to find its color.

I used TRIANGLE_STRIP to make the ribbon. Instead of drawing one large shape manually, it connects pairs of vertices into a continuous strip. I also used .toUpperCase() for the Pokémon name and types so the text matched the visual style.

For the sound, I used the p5.Sound Library, which was new to me. I loaded the MP3 using LoadSound() and created a p5.Amplitude() object to measure the loudness of the music.

amplitude = new p5.Amplitude();
song.connect(amplitude);

I used getLevel() to get the current amplitude of the song. That value is then used to affect the ribbon’s movement and width. I also used constrain() so the music could not make the movement become too extreme.

musicMovement = constrain(musicMovement, 0, 60);

The Space bar controls the song using isPlaying(), play() and pause(). I also used rate() to slightly change the playback speed based on the Pokémon’s speed stat.

let songSpeed = map(currentSpeed, 1, 180, 0.9, 1.1);

song.rate(songSpeed);

I kept the change small because I still wanted the song to be recognizable.

Development & Problems

One of the biggest problems was getting the shape to actually look interesting. My first version looked much more like a sine wave or a signal than a ribbon. While experimenting with the ribbon shape, I found this p5.js ribbon sketch that used TRIANGLE_STRIP. It helped me understand how a smoother strip could be built from connected vertices, although I simplified the idea and used it differently in my final version.

Initially, I used a sine wave to create the shape. It was smooth, but it looked too much like a graph. I experimented with different waves and later used noise() to make the movement less repetitive.

I also changed the ribbon from a small horizontal shape into a much larger diagonal form so it became the main part of the composition. Another issue appeared when I started working with sound. At first, the amplitude value stayed at 0.000 even when the song was playing. I later found that I need to connect the song to the amplitude analyzer:

song.connect(amplitude);

After that the values started changing. Later I had another issue, because the ribbon’s movement was too erratic. I used lerp() to smooth the value and tested different amounts until the movement felt calmer.

Reflection

This assignment ended up being more experimental than I expected. Before working on it, I mostly thought of data visualization as showing information through charts or points, but this project made me think more about how data can also control shape, movement, color, and sound. I liked that each Pokémon could have a different visual result even though the same system was being used for all of them.

The sound section was probably the most unfamiliar part for me because I had not used p5.sound before. It took some trial and error to figure out how to load the audio, measure its amplitude, and make the ribbon respond without the movement becoming too distracting. I also experimented a little with sonification by letting the Pokémon’s Speed stat affect the playback rate of Estrellita. The difference is small, but I liked that the Pokémon data was affecting both the visual and the audio. I considered using the Pokémon theme instead because its stronger rhythm would probably make the audio reaction more obvious, but I preferred the softer movement I got from Estrellita. If I continued working on the project, I would probably experiment more with how different parts of the music could affect the ribbon instead of adding more visual elements.

Credits

Pokémon data from the Pokémon CSV dataset by armgilles.
Pokémon Solid font from dafont.
Estrellita by Manuel M. Ponce, using the violin and piano arrangement credited to Jascha Heifetz in the recording used for this project. I do not own the recording. The audio sources in this project are used only for this classroom assignment and documentation.
The Pokémon Theme Song was also considered as an alternate audio source.

Week 4 Reading Assignment – M7md

One everyday design that frustrates me is a website or app that makes a simple task difficult by hiding the next step in menus. I would make the main actions easier to find and give clear confirmation when a choice has worked. Norman’s door example helped me see why: his friend could not tell where to push because the doors hid useful clues, so he had to guess. A screen can cause a similar problem when its actions are not visible. This made me pay more attention to discoverability. I agree that designers should anticipate likely mistakes rather than blame users immediately. At the same time, Norman writes from a designer’s perspective, so he puts much responsibility on design. I find that useful, but it can underplay how users’ familiarity and practical limits also shape what happens.

I would apply some of Norman’s principles to interactive artwork. I tend to think of interaction as a two-way exchange: the audience does something, and the artwork responds. The artwork could use a visual or sound cue to show what actions are possible, then change in color, movement, or sound to show that it registered an action. It would not need to explain the artwork’s meaning. The reading makes me think that clarity about how to engage can coexist with openness about what the response means. If people have no clue what action is possible, they may not participate; if every response is explained, there may be less room for exploration. I wonder how an artist can make an interaction understandable while leaving its meaning open to the audience.

Week 4 – Assignment

My Concept:

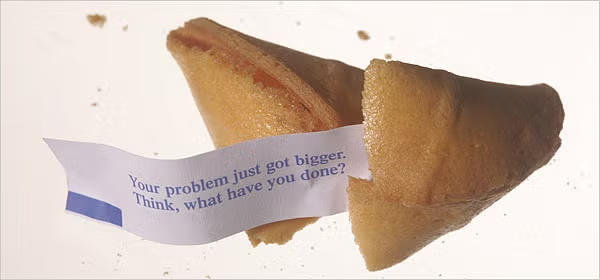
I made a text generator that displays a random fortune and it is styled like a small fortune card. The idea came from fortune cookies and the paper slips you get with them along with Japanese omikuji which are the fortune slips you draw at shrines. I liked the idea of a small piece of text appearing almost like a little ritual, so I wanted the sketch to feel closer to drawing a slip than just reading random text on a screen. When you click the canvas, a new fortune appears, pulled randomly from a list I made stored in a CSV file.

How I made it:

The fortunes are stored as individual lines in a file called fortunes.csv, which I load using loadStrings(). In setup(), I wait for that file to finish loading before doing anything else, then call a function that picks one fortune at random to display. In draw(), I draw a simple paper background with a double border to make it look like a paper slip or card with a small title at the top and the current fortune centered inside. Clicking the canvas picks a new random fortune and redraws the screen, similar to how you would draw a new slip if you wanted to try your luck again.

Highlight of my code:

function pickFortune() {
  //random(fortunes.length) picks a random position in the array
  //int() turns it into a whole number so it can be used as an index
  currentFortune = fortunes[int(random(fortunes.length))];
}

This is the part that actually makes the generator generative. random(fortunes.length) picks a random decimal number somewhere between 0 and the total number of fortunes I have stored. Since array positions have to be whole numbers, I wrap it in int() to round it down into a usable index. That number is then used to pull one specific line out of the fortunes array and store it in currentFortune, which is what gets displayed on the card. Every time this function runs again it recalculates a new random index so a different fortune has a chance of showing up.

My Embedded Sketch:

You can click the sketch to display another result.

Problems I ran into:

I had a layout bug where my fortune text was overflowing off the card instead of staying centered. I originally assumed that when you give text() a width and height for wrapping, the x and y you provide would be treated as the center point, since I already had text align set. It turns out those x and y values are actually the top left corner of the wrapping box so my box was starting from the middle of the canvas and extending off the edge. Once I understood that fixing the position was simple.

Reflection:

I think this assignment taught me more about debugging than about the actual concept of generative text which i did bot expect. I feel like getting stuck on something small like an async function or a misunderstood parameter is where I learned the most. I thought going in that the hardest part would be designing the visuals, but it ended up being the file loading and positioning logic that took the most time to get right.

References:

https://p5js.org/reference/p5/loadStrings/

https://p5js.org/reference/p5/textAlign

Claude – I used it to generate some fortune texts for the csv file

Week 4 Reading Reflection

One thing from Don Norman’s “The Psychopathology of Everyday Things” that made me think about my own experiences is his discussion of discoverability. He said the two main things is understanding and discoverability. I realized that I often get frustrated in malls because I cannot easily figure out where I am or where I need to go. Many malls have maps, but they are not always in places where I can easily find them, and sometimes I still have to spend time looking around to understand which direction I should walk. This made me question what makes something technically available but still difficult to use. If a map exists but I cannot find it or understand it quickly, is it really doing its job as a design or not? Norman’s idea of signifiers also changed how I think about this problem. A better mall map could use clear signs, icons, and arrows to show me where I am and where I should go. An interactive mall map could make this even easier by allowing me to search for a specific store and showing me a route from my current location. This would also have feedback within it.

What stood out to me most is that Norman argues that good design should make things understandable rather than forcing people to figure them out through trial and error.  Norman mentions how everything is interactive; it’s just the degree to which it is. For example, he uses books and movies and calls them interactive. Before reading this, I usually thought that getting lost in a mall was just my own problem or lack of attention.  It makes me think differently about interactive media because I realize that even simple things like buttons, maps, and directions need to communicate clearly with the user. Overall, these principles can make interactive media more intuitive, easier to use, and less frustrating. There are signifiers that give users clues about how to use something. I did not really include these in my project last week. For example, I made bubbles appear when the user clicks the mouse, and the bubbles can be removed by clicking again. However, the user would not know that these interactions are possible because I did not provide any signifiers to guide them.

Week 4 – Reading Reflection

Something completely unrelated to the reading that drives me a little crazy is the automatic doors on campus that only work about half the time. Sometimes they slide open right away, other times Im standing there waving my arm around because the sensor did not pick me up, and there is zero indication why. No light nothing telling me if it’s just slow or actually broken. If I redesigned it, Id add a small light near the sensor that turns on when it detects motion, so at least you know whether it registered you or the whole thing is just dead. It is basically Norman’s feedback problem in physical form.

As for applying his principles to interactive media, I think the shift for me is realizing a lot of what I call “interactive” in my own work is really just affordance without signification. In a browser based project, technically anything can be clicked since a mouse works anywhere, but that does not mean the user knows what is clickable unless I signify it, through a hover state or cursor change or something. Feedback matters the same way it does with the campus doors, if someone triggers an action and nothing visibly changes for even a beat, they’ll assume it’s broken and click again, same standing and waving problem. The takeaway is that clever mechanics don’t matter if the signifiers and feedback don’t communicate clearly. The user just experiences confusion and assumes it’s their fault which now feels like a design failure on my end rather than a user failure on theirs.

Week 4 Reading Reflection

Before this reading, I always blamed myself when I could not understand how to use an everyday object. But after reading, Norman changed this view by showing that confusion is often evidence of poor design rather than user failure. Something that sometimes drives me crazy is a self-checkout machine that suddenly stops and displays an unclear error. It often tells me to place an item in the bagging area even though the item is already there, but it does not explain what I should do next. I would improve it by using clearer instructions, showing the exact item causing the problem, and providing an obvious button to ask for help. I think Norman may be slightly biased because he strongly favors usability and sometimes treats simple appearance as a cause of confusion. However, I think his examples support his argument that appearance should not hide function.

I can apply Norman’s principles to interactive media by making every possible action discoverable. In my p5.js sketches, clickable text should look clickable, instructions should appear before the user needs them, and every click should create immediate and understandable feedback. Controls should also have clear mapping, which means their position and appearance should relate naturally to what they change. For example, in the latest assignment I made,  clicking the “new result” option should visibly just replace the current football match result instead of producing an unexplained or unexpected change. At the end, the reading made me wonder how designers can keep an interface visually clean and clear while still providing enough signifiers and instructions, especially for a first-time user.