
Concept
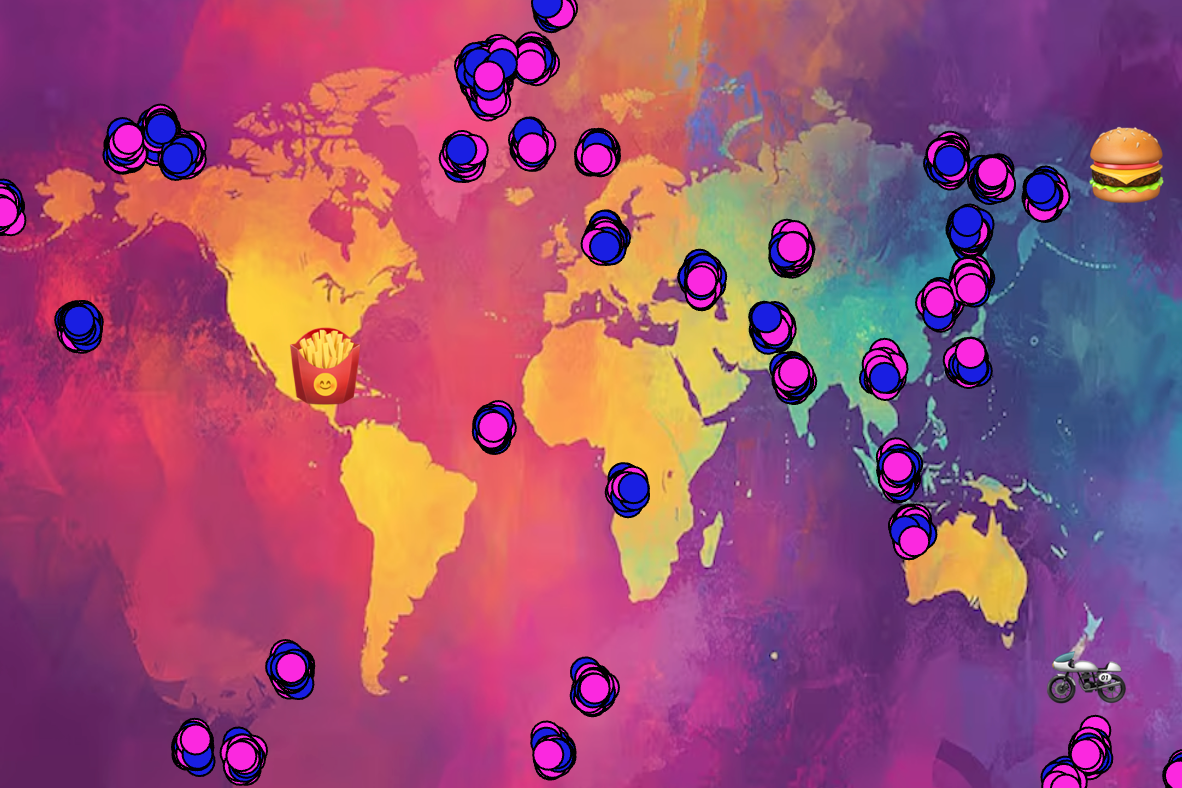
One click can send an order around the world. I was inspired by the idea of online shopping and how orders come from people all around the world. The map visually represents online shopping, while the different colored dots show the locations and gender of customers.
Highlighted code
//drawing the circles
for (i = 0; i < numRows; i++) {
  let circleX = map(lng[i], -180, 180, 0, width);

  let circleY = map(lat[i], -90, 90, height, 0);

  circle(circleX, circleY, 15);

  if (Gender[i] > 1) {
    noStroke()
    fill(24, 30, 226, 60);
  }
  if (Gender[i] < 2) {
    fill(251, 40, 223, 60);
  }
}
I am most proud of this section of code because I struggled a lot with aligning the dots to the map. It required a lot of trial and error to get the locations mapped correctly. There is still a slight misalignment, but compared to where I started, it is much better.
This is what it looked like initially.
How this was made
I applied what we learnt in class about uploading datasets. I made sure to upload it in the correct data file as a .csv and checked my data for any gaps. I then uploaded an image of a colorful map to use as the background. I chose the vibrant colors because I thought they would work well with the blue and pink circles. It was also important to map the data correctly and choose a suitable canvas size. I chose 600×400 because it best matched the shape of the map. The blue circles represent male customers, while the pink circles represent female customers. I intentionally made them slightly transparent so the viewer could see where the circles overlap. I then added another layer by including moving emojis that relate to online orders, such as shipping boxes and delivery bikes.
Reflection
Overall, I think I did a good job applying what we have learnt in class. However, in the future, I would love to explore ideas such as having text appear when hovering over certain areas of the map, or adding percentages to show the differences between continents. This could make the map more interactive and help the viewer understand the data more easily.
Reading Reflection
What I found most interesting about this reading was how Norman explains that when something is difficult to use, it is not always the user’s fault. I usually get annoyed when I cannot figure out how something works, but the reading made me realize that the design itself can be the problem. Things like signifiers and mapping are meant to make it clear what you can do and what will happen when you interact with something.
I can definitely see how this applies to interactive media because users should not have to spend a lot of time figuring out how something “works”. Buttons, icons, animations, and other interactive elements should give people clues about what they do. I also liked the idea that designers should expect people to make mistakes instead of assuming everyone will use something perfectly. It made me think more about how small design choices can completely change how easy or frustrating an experience is.
One thing I will take away from the reading is that good design should feel almost obvious to the person using it. If I have to stop and think about what a button does or how something works, there is probably something about the design that could be clearer. This is something I want to pay more attention to when creating my own interactive projects.