
This week, we learned about text and data visualization. I wanted to create my data visualization around Marvel movies and their Rotten Tomatoes scores based on the year they were released. At first, I was planning to create a fashion-themed data visualization, but I could not find the data I needed, so I decided to move on to movies, specifically Marvel movies. My initial idea was to use different tomato sizes to display the Rotten Tomatoes scores of Marvel movies across different years. At first, my tomatoes were all displayed in a line, but I later decided to arrange them in a more random-looking way so the visualization would be more visually interesting.
Concept
My concept is to visualize Marvel movies using tomatoes, with each tomato representing a different movie. The tomatoes are placed along a timeline from 2008 to 2024 based on the movie’s release year. Each tomato’s size represents its Rotten Tomatoes critics score, so movies with higher scores have larger tomatoes. I looped through each movie in the CSV file and used the movie’s data to determine the tomato’s position and size. I also used different rows to organize the tomatoes and make the visualization easier to read. My goal is to create a simple and visual way to see how Marvel movies have been rated over time.
I first used the shapes and text that we learned in Lesson One to create the Marvel sign at the top and the timeline at the bottom. I then created a class for the tomatoes so that instead of using simple circles, the tomatoes appear on the canvas to represent the Rotten Tomatoes ratings.

After that, I uploaded my data in the form of a CSV file. When editing the data, I chose to include only three pieces of information: the movie name, the release year, and the Rotten Tomatoes score. The image below shows a snippet of the data: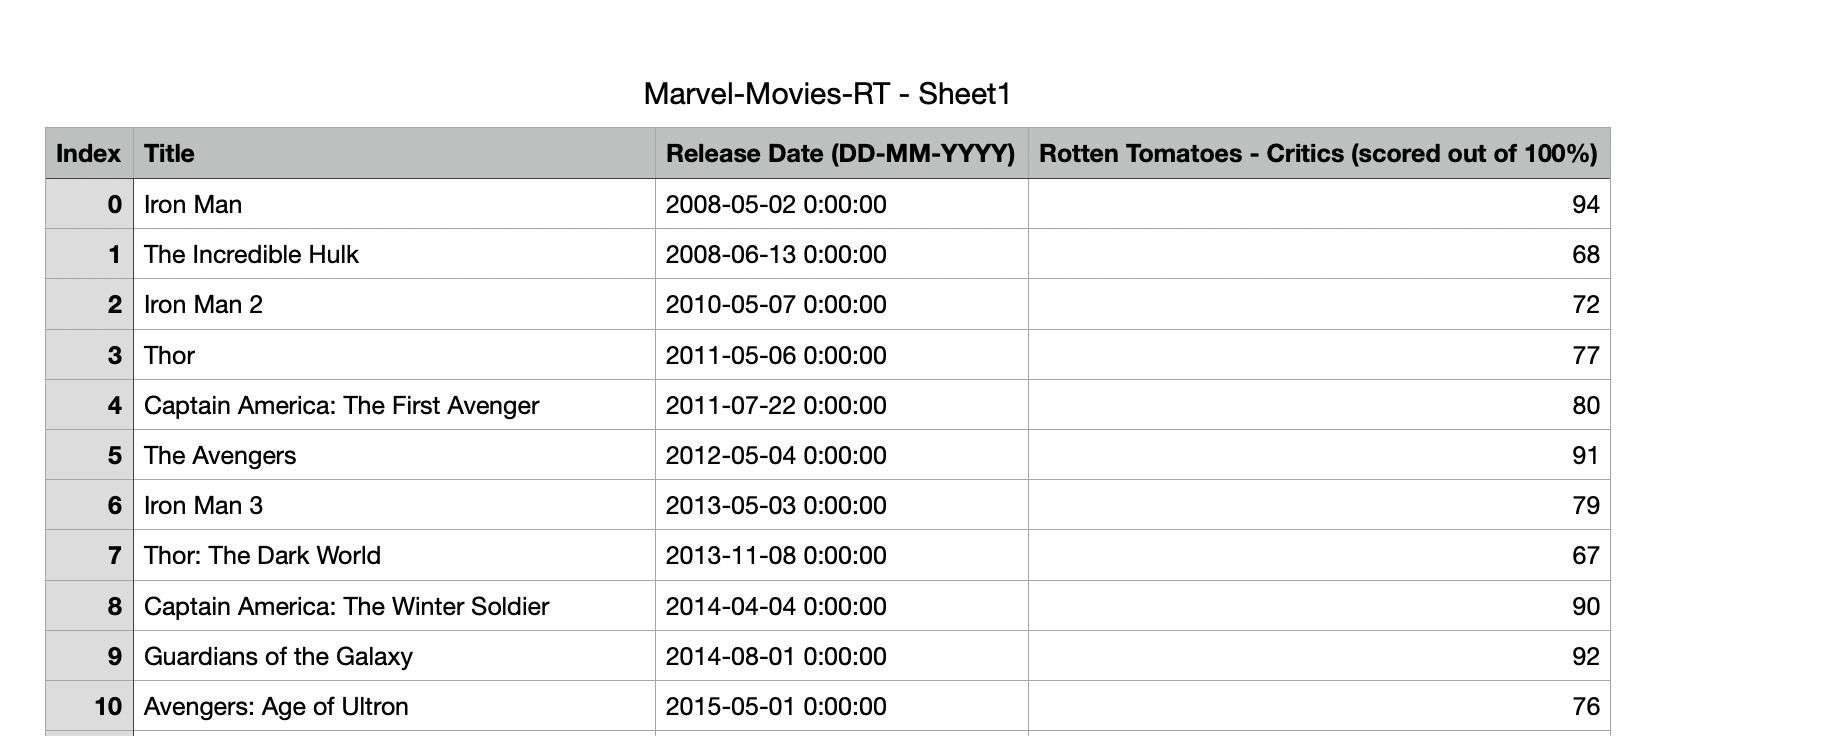
Then I used let numRows = marvel.getRowCount (), which allows me to count how many rows or movies are in my CSV file. I then collected the release dates and Rotten Tomatoes scores from the CSV. I also used the Float function, which changes the values into numbers so JavaScript can use them for calculations. I then used the minimum and maximum Rotten Tomatoes scores to determine the size of each tomato. Finally, I used the movie’s release year to position each tomato along the timeline and created different rows so the tomatoes would not all overlap.
The code I was most proud of was
let x = map(year, 2008, 2024, 50, width - 50);

 let size = map(rottenTomatoes[i], rottenMIN, rottenMAX, 10, 80);
I was proud of this code because I was able to use the data from my CSV file to map out the tomatoes visually. The first line uses the movie’s release year to decide where the tomato should be placed on the timeline. The map function takes the years from 2008 to 2024 and changes them to fit across the width of my canvas, from 50 pixels to width -50. This means that movies released earlier are placed closer to the left side of the timeline, while movies released later are placed closer to the right side.
The second line uses the Rotten Tomatoes score to decide the size of each tomato. It takes the lowest and highest Rotten Tomatoes scores in my data and maps them to tomato sizes between 10 and 80. This means that a movie with a lower score will have a smaller tomato, while a movie with a higher score will have a larger tomato. I was proud of this because I was able to take actual data and turn it into visual elements, rather than just displaying the numbers as text.
Reflection
For next time, I would like to make my visualization more interactive by having the name of the movie appear when I hover over each tomato. I think this would make the data easier to understand because the viewer could see the Rotten Tomatoes score through the size of the tomato while also being able to identify the movie. One part of my code that I found difficult to understand was how the tomatoes could be placed into different rows. In particular, I did not fully understand the code :
for (let i = 0; i < numRows; i++) {
   let year = int(releaseDate[i].substring(0, 4));
and how the i was used to change each tomato’s position. I used AI to help me understand this part of the code and fix it, since the tomatoes originally appeared in a straight line and then moved randomly. In the future, I want to be able to understand and create this type of code more independently instead of relying on AI when I get stuck.
Reference
Marvel Movies Dataset. (2024, November 8). Kaggle. https://www.kaggle.com/datasets/sarthakbharad/marvel-movies-dataset?resource=download