Week 4 – Data Visualization Assignment Megan

“YOaMoNUEvAYoL”

“The only thing more powerful than hate is love.”

“Together, we are America.”

– Benito Antonio Martínez Ocasio 2026

Concept

The concept of this project was to create something connected to the recent social and political conversations about Latin American communities, especially in the United States. Recently I watched the Bad Bunny halftime show that became extremely popular, and as a Latina it honestly felt like a huge moment. Seeing someone singing in Spanish in front of all of the USA, especially considering the controversies around immigration and the fact that many immigrants in the USA are Latino, made me want to base my project around that idea.

Therefore, for the project I chose the song “NUEVAYoL” by Bad Bunny, which was part of the performance and also part of the album that just won two Grammys. The song talks about New York and mixes the American image of the city with a Latin cultural perspective of it. Because of that, I used an image of the Empire State Building that felt vibrant and alive. The image has four dominant colors: orange, light blue, white, and gray. Then I found official 2023 data about Hispanic/Latino population in the United States organized by state. I grouped the states into three main regions: South, West, and Northeast.

Each main color in the image (blue, orange and white) represents one of those regional population groups, and so the amount each color appears is controlled by population data.

The idea is that the skyline is not just a picture anymore. The city lights are metaphorically “powered” by the people who live there. If a region has a larger Hispanic population, that color appears more often in the picture. The music adds movement because when the song gets louder, the dots grow and become brighter, so it feels more like a celebration instead of a static visualization.

To see (and listen) it in action just click the little  ⏯  button on the lower left corner!

Click the play ⏯ button!

Process

Originally I tried to make a migration tree showing people moving from Latin America to the U.S. But when I started doing it, technically it was data visualization, but visually I didn’t like it. It looked more like a diagram than something expressive.

After watching The Coding Train videos about sound visualization, I followed the tutorial and experimented with audio-reactive graphics (This tutorial is also why I kept the little toggle button in the corner to play and pause the audio). I then found this Bad Bunny song and immediately thought about using the Empire State Building because the song is about New York. However, I couldn’t use the song because of issues with the UAE library store so I had to extract the audio from the YouTube video of that song and then cut the mp3 so that the intro of the video that wasn’t part of the song itself. I learned how to do this and did it with my terminal.

First I created a sound visualizer using p5.js amplitude analysis (p5.Amplitude()), which gives a number between 0 and 1 representing how loud the music is at each moment. I mapped that value to the size of the dots so louder music makes the building pulse.

Then I converted the image into a pointillism drawing (i based myself of off these p5.js examples 1, 2). Instead of drawing every pixel, the code samples every 5 pixels in both directions. This reduces detail but still makes visible dots.

After that I connected the dataset. I loaded a CSV file using loadTable() and extracted the column HispanicTotal_2023. I summed populations into regional totals (West, South, Northeast). Instead of placing states spatially, I mapped data into a visual variable: color frequency. So, higher population = higher probability a dot of that color appears.

Media and tools used:

  • p5.js

  • The Coding Train tutorials

  • U.S. Census 2023 dataset

  • audio extracted and trimmed from YouTube

  • ChatGPT used to understand pixel arrays and debugging

One of the hardest parts was understanding how images are stored in p5.js. At first the dots appeared randomly because I didn’t understand that each pixel uses 4 values (RGBA). Once I learned how to correctly calculate the pixel index, the image reconstruction finally worked.

Code that I’m proud of

The part of the code I am most proud of is the section where the program reads the color of each pixel from the image and connects it to the demographic dataset. Instead of drawing the Empire State Building manually, the sketch actually reconstructs it from the photograph itself. The program loads the image and then scans across it every few pixels rather than reading every single one. For each sampled position it calculates where that pixel exists inside the image array, extracts the RGB color values, and then classifies the pixel as sky, window light, highlight, or building structure. After that, the demographic data determines whether the dot is drawn or not, so population directly controls how frequently certain colors appear. Because of this, the building is a data-driven reconstruction made of sampled points. The line that makes this possible is the calculation that converts the (x, y) position on the image into the correct position in the pixel array, which allows the code to access the exact color information for that location.

Another reason this is the part of the code I am most proud of is because I tried many different ways of displaying the data before arriving at this solution. I experimented with horizontal assignments, bar-style representations, mapping individual states directly, and even changing the size of the dots to represent population, but none of those approaches worked visually or conceptually. They either made the Empire State Building unrecognizable or the data unclear.

//sampling the image, skiping every 5 px to make dots
  for (let x = 0; x < img.width; x += 5) {
    for (let y = 0; y < img.height; y += 5) {

      // locate pixel inside the 1D pixel array to extract its color
      let index = (x + y * img.width) * 4;

      // RGB values of that pixel
      let r = img.pixels[index];
      let g = img.pixels[index + 1];
      let b = img.pixels[index + 2];

      // brightness decides how visible the dot should be
      let brightness = (r + g + b) / 3;

      // darker parts = bigger dots for the building silhouette to appear
      let dotsize = map(brightness, 0, 255, 2, 0);

      // music reaction: louder song = dots expand
      dotsize = dotsize + vol * 20;

      // classify the pixel color
let regionType;

if (r > 200 && g > 200 && b > 200){
  regionType = "white";      // bright highlights
}
else if (r > 200 && g > 120 && b < 100){
  regionType = "orange";     // other buildings
}
else if (b > r && b > g){
  regionType = "blue";       // background
}
else{
  regionType = "structure";  // gray building
}

// population controls how often each color appears
let maxRegion = max(westPopu, southPopu, eastPopu);
let allow = 0;

if(regionType === "orange"){        // WEST
  allow = map(westPopu, 0, maxRegion, 0.1, 1);
}
else if(regionType === "white"){    // SOUTH
  allow = map(southPopu, 0, maxRegion, 0.1, 1);
}
else if(regionType === "blue"){     // EAST
  allow = map(eastPopu, 0, maxRegion, 0.1, 1);
}
else{
  allow = 0.15; // so that the building structure always faints
}

noStroke();
fill(r, g, b);

if(random() < allow){
  circle(x, y, dotsize);
}
}

Overall Reflection

Overall I’m really happy with the final result. I like thaat it balances data and aesthetics. It is not a traditional chart, but it still encodes real demographic information so you don’t read numbers directly, but still you perceive distribution through color presence.

If I continue this project, I would add multiple years of census data and animate the skyline over time so you could see growth instead of a single snapshot. Another improvement would be adding clearer interaction (for example hovering to reveal which region each color corresponds to). Although, a limitation is that the visualization depends on the colors of this specific image so if the image changes, the mapping must also change.

Week 4 Reading Response Zere

  1. Something that drives me crazy and how it can be improved: “automatic doors” across campus! Primarily, the ones in D2, they drive me crazy every day. These so-called “automatic doors” are not even automatic at times, and are super heavy. A lot of the times they simply do not work, and I have to manually open them or wait until somebody opens them for me. It is especially frustrating when you want to have a nice lunch/dinner outside of D2, but carrying the heavy tray in and out of the cafeteria is made almost impossible if you are by yourself. These automatic doors could be improved by making their behavior consistent and by adding clearer signifiers and feedback to show when they are working. Since people in D2 often carry trays, the doors should be designed to open every time and stay open long enough to accommodate real use. This would provide a clear conceptual model of those “automatic doors”.
  2. How can I apply some of the author’s principles of design to IM?

    The main lesson from the reading is that interactive media should not make users stop and think, “What is going on here?” or “What am I supposed to do here?” Instructions, explanations, or repeated trials directly affect the user experience of what is meant to be interactive and understandable. In my opinion, interactive systems should clearly signal what actions are possible and what will happen after those actions are taken. Design has to be good – buttons clickable, interactions should respond quickly to the user. That is why feedback is important. I believe that IM should work with normal human expectations, that way there would be more people interested in it or pursuing it.

Week 4 – Generative text

Concept:
I was inspired by the idea of an “answer book.” When people feel confused or overwhelmed, they sometimes speak their question out loud and then randomly open a book to any page. Even though the page is chosen by chance, a sentence on that page can feel meaningful or comforting, and it can help the person feel calmer or more encouraged. Based on this idea, I created a simple online version of the answer book. The user brings their own question, then clicks once to receive a randomly generated sentence. The goal is not to give a perfect or “correct” answer, but to offer a small prompt that can shift the user’s mood, support reflection, and help them move forward.
How this was made:
I made this project by following a simple p5.js workflow and using a mix of learning resources to solve specific problems as they came up. I started by watching beginner YouTube tutorials on p5.js to understand the basic structure of a sketch, especially how `setup()` and `draw()` work, and how to display text on the canvas. After I had a basic template running, I used the official p5.js reference website to check the correct syntax for functions like `text()`, `textAlign()`, `textSize()`, `mousePressed()`, and `saveCanvas()`. Next, I built the “answer book” logic using online examples about randomness and arrays. I created several word banks (sentence starters, subjects, verbs, adjectives, and endings) and then used `random()` to pick one item from each list. I combined those parts into a full sentence, so every click generates a new “page” from the book. I tested the output many times and edited the word lists to make sure the sentences sounded smooth and encouraging, not broken or repetitive. When I got stuck or wanted to improve the design, I also used generative AI as a helper. I asked it for simple code patterns (like how to organize arrays, how to avoid repeating the same quote too often, and how to make the layout look cleaner).

The part I am proud of:
Actually, the whole thing is fun and interesting, it indeed took me sometimes to collaborate the part that we use for adding all the words together to form a sentences. But I will say the “word bank” itself is the most chellenging part. Since I have to go through many answer books and find some short sentences to make the whole sentence make sense. (somehow)

// Word banks 
let starters = ["Today I learned", "I keep forgetting", "I wish", "I noticed", "It feels like", "Sometimes","I hope", "I confess"];
let subjects = ["my phone", "the app", "the door", "my brain", "the algorithm", "the website", "this class","the thoughts"];
let verbs = ["is", "acts", "behaves", "works", "fails", "pretends", "keeps trying","destroy"];
let adjectives = ["confusing", "too fast", "too slow", "strangely helpful", "kinda broken", "overdesigned", "simple"];
let endings = [
  "and I blame the design.",
  "but I'm still alive.",
  "so I take a deep breath.",
  "and somehow it makes sense.",
  "and then I start over.",
  "and that’s the whole story."
];

Conclusion:
I think I did a goood job on this assignment. But if the time is longer, I think I can put more phrases inside the coding, make the text not that repeatable.

Week 4 – Generative Text Assignment

Concept:

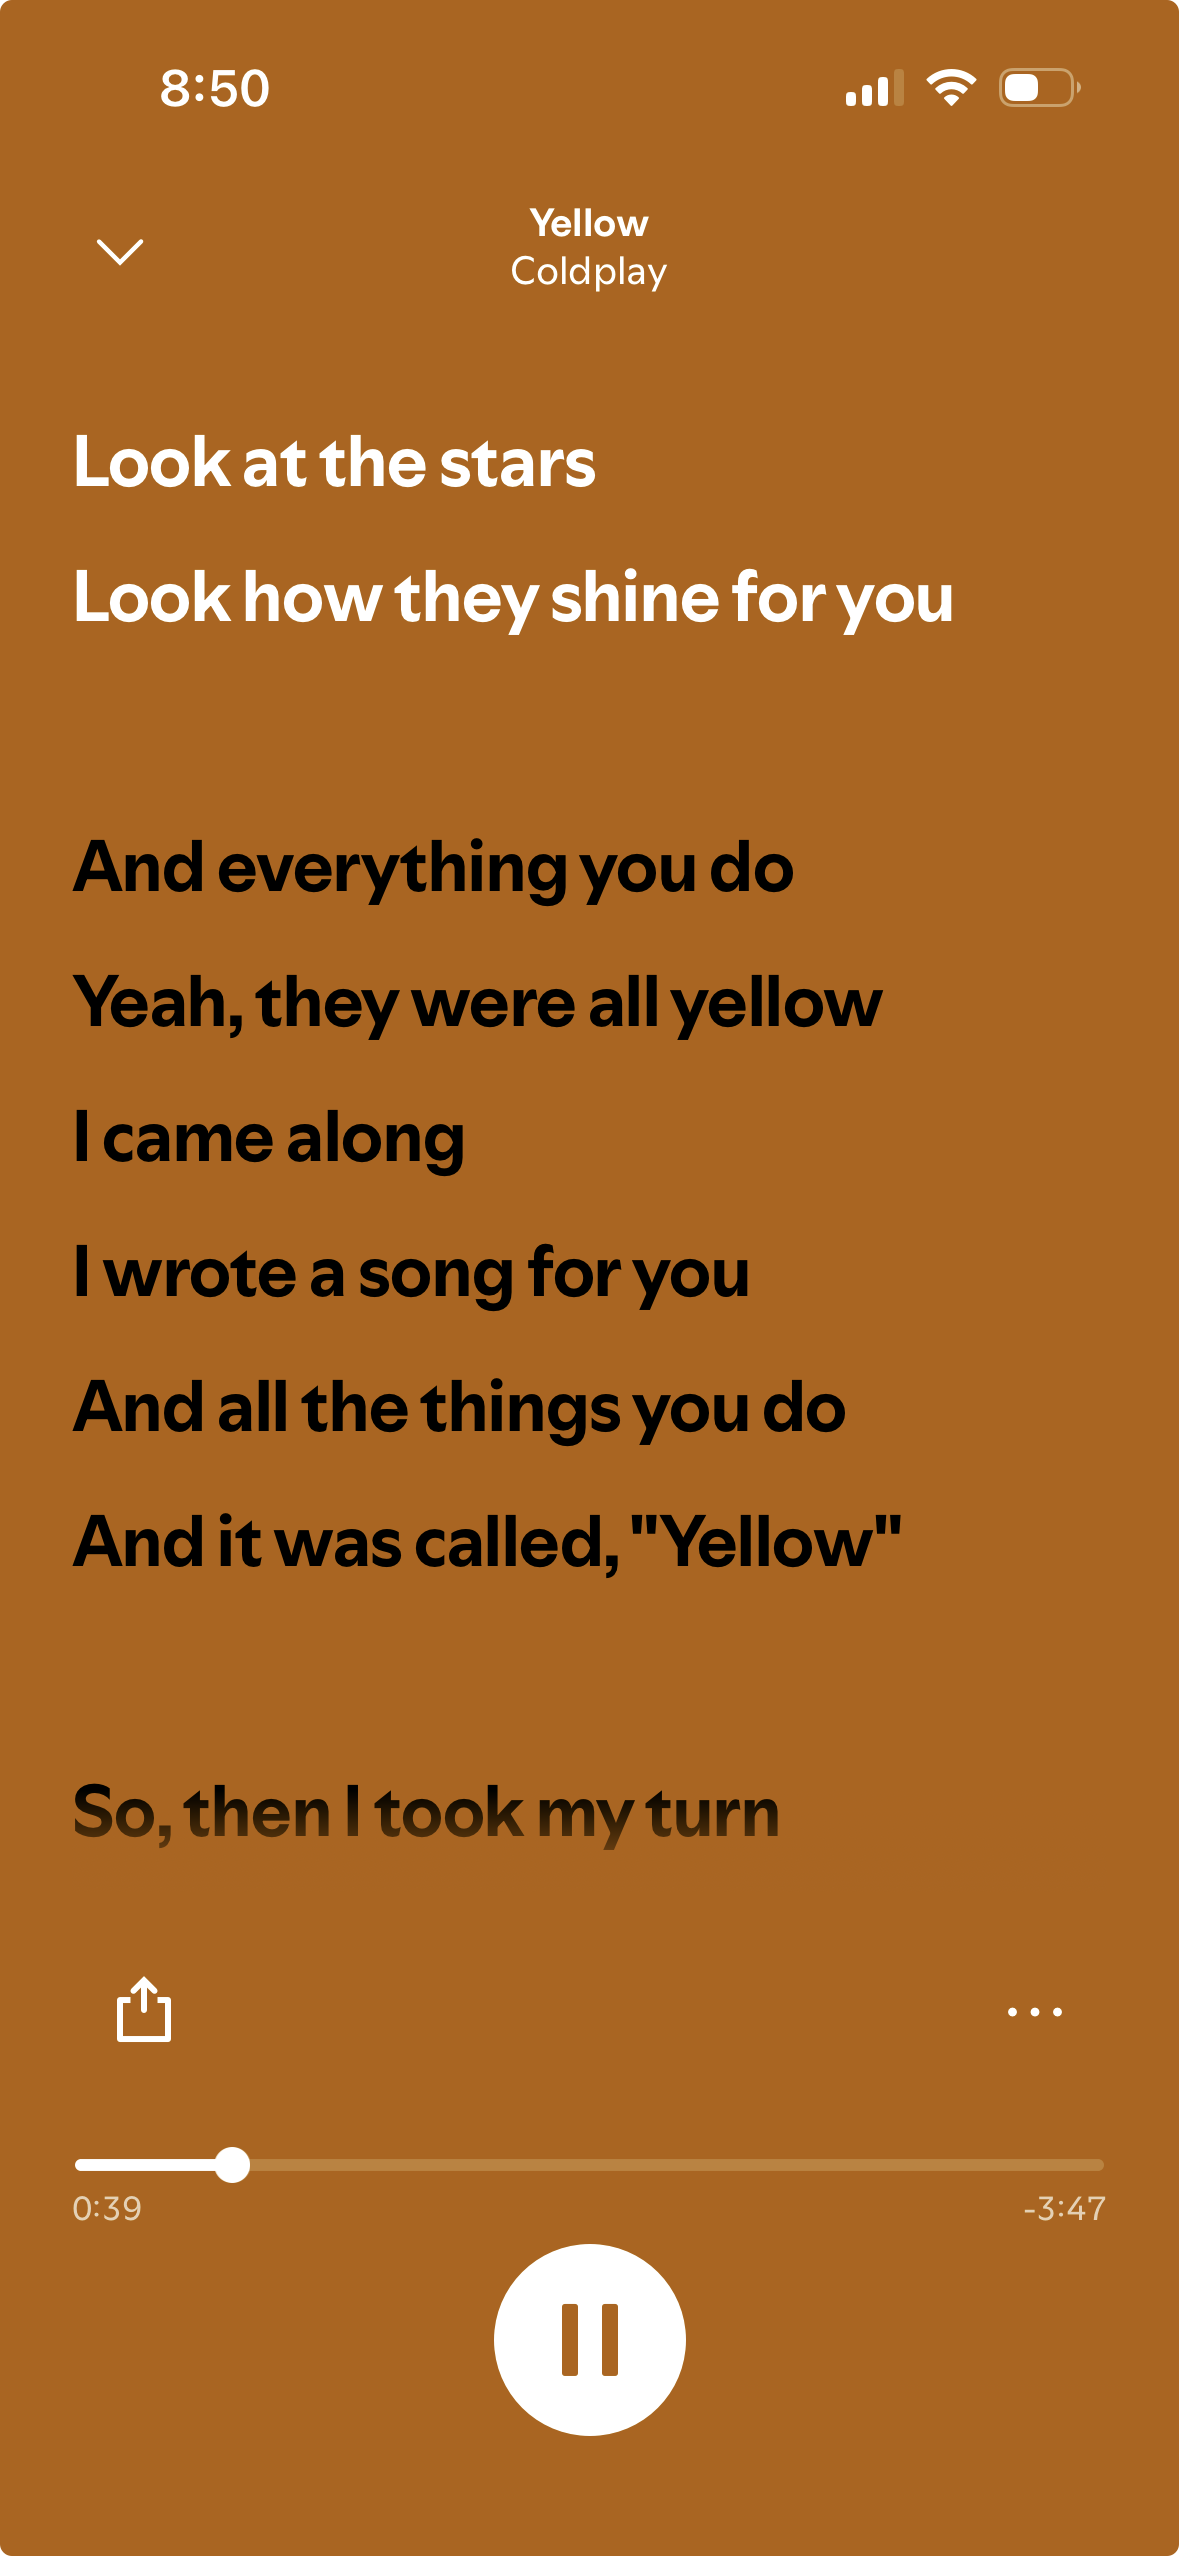
For this project, I wanted to experiment with text functions while learning and applying different codes to create a scrolling lyrics display similar to Spotify, Apple Music, and YouTube. When I first looked at the assignment, I immediately wanted to recreate the full music interface that includes the album cover and the timeline of the song at the bottom. But instead, I decided to focus only on the scrolling lyrics to make it more creative and manageable.

I chose the song Yellow by Coldplay because it reminds me of my last bus ride after a field trip in senior year. It was our last day of school after finishing our final exams, and on the way back from IMG everyone in my class was saying goodbye to each other at the final stoplight before we all went home. That moment felt nostalgic and emotional which is why I wanted to incorporate that feeling into my work.

Inspo from Spotify: 

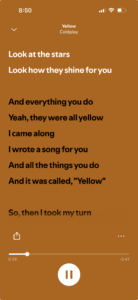
Embedded sketch: (try pressing on the screen)

How it was made:

I usually start by building the background and adding simple codes that I know like the colored box and the title text at the top, the background, the size of the canvas, etc. After that, I started off by creating an array to store the lyrics so I could easily reference each line later in the code.

Then I created the scroll variable so the lyrics would begin at the bottom of the screen. Using translate() along with push() and pop(), I was able to make the lyrics scroll upward. While working on this part, I kept experimenting because sometimes the text wouldn’t move the way I wanted it to move. I also had to adjust the speed because it was first set to 0.3 but since I included the full lyrics of the song, I felt that 0.3 was too slow. I decided to change it to 0.6 which made the movement feel more reasonable.

I used this loop:

for (let i = 0; i < lyrics.length; i++) { //going through the lyrics line by line 
  let yPos = i * 40; //each line is 40 pixels below the previous one -using the name yPos for the positioning of lines vertically (y-axis)

This allowed the lyrics to display line by line with 40 pixels of spacing between each one. That spacing helped create a smoother scroll and prevented the lines from looking crowded.

For interactivity, I added the mouseIsPressed function with the if/else functions so that when the mouse is pressed, the scroll speed increases to 30. When it’s not pressed, it goes back to the normal pace of 0.6. I liked adding this because it made the project more engaging instead of just automatically scrolling.

Resources:

Push and pop functions: (all the resources helped me understand how push and pop work through examples and descriptions I was able to make my own transformation)
https://www.youtube.com/watch?v=KSo_VEbsWks 

https://www.youtube.com/watch?v=o9sgjuh-CBM

https://p5js.org/reference/p5/push/

Translate:

https://p5js.org/reference/p5/translate/ (in order for my lyrics to scroll and keep moving up from their starting point I had to use the translate function)

Text:

https://p5js.org/tutorials/loading-and-selecting-fonts/ (learning how to use text fonts and functions)

https://p5js.org/reference/ (Typography section to understand the types of text functions)

I also kept going back to Professor Aya’s slides, Week 4.1 and Week 4.2

I also used Musixmatch to get the lyrics of the song Yellow by Coldplay

Hardest Part of the Code (and the Part I’m Most Proud Of):

 //First layer of the lyrics 
push(); //starting a "transformation state" - using 'push' to save the current canvas settings
translate(10, height - scroll); //starting to move the original position 0,0 to 10 pixels from the left and being close to the bottom of the canvas 

for (let i = 0; i < lyrics.length; i++) { //going through the lyrics line by line 
  let yPos = i * 40; //each line is 40 pixels below the previous one -using the name yPos for the positioning of lines vertically (y-axis)
  
  //black txt if below the middle and white if above
  let currentY = (height - scroll) + yPos;//used to figure out the positions of the line
  if (currentY < height / 2) { //checking if the lyric is above the middle half, if it is it will change color
    fill(255); //the color of the text -white
  } else { //if it is below the screen it will..
    fill(0);
  }
  
  textSize(18); //text size of the lyrics 
  textStyle(BOLD); //adding bold text
  text(lyrics[i], 0, yPos, 280); //in order for the long lyrics to not go off the screen -lyrics is drawn inside this 280 sized pixel 
}
pop(); //concluding the end of the transformation so the other header doesnt move too

The hardest part was understanding how push(), pop(), and translate() all worked without affecting the rest of my design. The push() allowed me to save the current canvas settings before transforming it. Then with [translate(10, height – scroll);] I was able to shift the origin point so the lyrics would start near the bottom and move upward as the scroll value increased.

Inside the loop, [let yPos = i * 40;] this function made each lyric line 40 pixels below the previous one which keeps everything equal and smooth.

Then I used [let currentY = (height – scroll) + yPos;] to calculate the piston of each line on the canvas so that I can check where the lyric is positioned which will determine if it would change from black text to white (similar to Spotify). If the lyric was above the middle of the screen, it changed to white and if not it remained black until it reaches that point.

Similar to the issues I faced before, I had a hard time keeping the text inside the canvas because it would always go out. I decided to use [text(lyrics[i], 0, yPos, 280);] that draws each lyric at the x-position 0 and y-position yPos while being inside a 280-pixel text box so long lines wouldn’t overflow off the screen.

I’m proud of this section because even though it took time to understand, I was able to control the translation without changing the rest of my code. At one point I accidentally deleted the entire section, which was frustrating because it took me a while to feel confident in it, but since I practiced it before, I was able to rewrite it again.

Issues I faced:

At first, the lyrics started in the middle of the canvas and would bleed outside the frame which was a struggle because I couldn’t figure out how to fix it for a second. I remembered Professor Mang explaining how small positioning errors can happen when centering the text exactly in the middle because it will start exactly there instead of being all on the center. I also carefully adjusted the placement using translate() and the text box width: [text(lyrics[i], 0, yPos, 280);] that helped keep everything within the screen and made the scrolling smoother.

Final code: 

let lyrics = [//using the name lyrics for the array/list
  //adding all the lyrics of the song from Yellow -Coldplay
  "Look at the stars",
  "Look how they shine for you",
  "And everything you do",
  "Yeah, they were all yellow",
  "I came along",
  "I wrote a song for you",
  "And all the things you do",
  "And it was called, \"Yellow\"",
  "So, then I took my turn",
  "Oh, what a thing to have done",
  "And it was all yellow",
  "Your skin, oh yeah, your skin, and bones",
  "Turn into something beautiful",
  "And you know, you know I love you so",
  "You know I love you so",
  "I swam across",
  "I jumped across for you",
  "Oh, what a thing to do",
  "'Cause you were all yellow",
  "I drew a line",
  "I drew a line for you",
  "Oh, what a thing to do",
  "And it was all yellow",
  "And your skin, oh yeah, your skin, and bones",
  "Turn into something beautiful",
  "And you know, for you, I'd bleed myself dry",
  "For you I'd bleed myself dry",
  "It's true",
  "Look how they shine for you",
  "Look how they shine for you",
  "Look how they shine for-",
  "Look how they shine for you",
  "Look how they shine for you",
  "Look how they shine",
  "Look at the stars",
  "Look how they shine for you",
  "And all the things that you do"
];

let scroll = 0; //letting the lyrics start scrolling vertically

function setup() {
  createCanvas(300, 500); //canvas size
  textAlign(LEFT, TOP);  //postion of the text
  textFont('Helvetica'); //text font 
}

function draw() {
  background(158, 91, 28); //background color 'burnt orange'

   //First layer of the lyrics 
  push(); //starting a "transformation state" - using 'push' to save the current canvas settings
  translate(10, height - scroll); //starting to move the original position 0,0 to 10 pixels from the left and being close to the bottom of the canvas 
  
  for (let i = 0; i < lyrics.length; i++) { //going through the lyrics line by line 
    let yPos = i * 40; //each line is 40 pixels below the previous one -using the name yPos for the positioning of lines vertically (y-axis)
    
    //black txt if below the middle and white if above
    let currentY = (height - scroll) + yPos;//used to figure out the positions of the line
    if (currentY < height / 2) { //checking if the lyric is above the middle half, if it is it will change color
      fill(255); //the color of the text -white
    } else { //if it is below the screen it will..
      fill(0);
    }
    
    textSize(18); //text size of the lyrics 
    textStyle(BOLD); //adding bold text
    text(lyrics[i], 0, yPos, 280); //in order for the long lyrics to not go off the screen -lyrics is drawn inside this 280 sized pixel 
  }
  pop(); //concluding the end of the transformation so the other header doesnt move too
  
  //The scrolling movement 
  scroll += 0.6; //Speed of the scroll to make it a little faster since its the full song being used

  //Restarting the lyrics loop
  //checking if the scroll distance is greater > than the total height of the list
   if (scroll > (lyrics.length * 40) + height) { //calculation of height from the number of lines multiplied by 40 pixels each
   scroll = 0; //restarting the loop so the lyrics can come back from the bottom
  }

  //The title on the top
  noStroke(); //removing the outline of the rect
  fill(158, 91, 28); //color of background 
  rect(0, 0, width, 100); //adding a rect so that the lyrics can go under it -similar to spotify

  fill(255); //color of the text 'yellow'
  textAlign(CENTER); //adding it to the center of the frame
  textStyle(NORMAL);
  textSize(14); //size of text
  text("Yellow", width / 2, 45); //name of text + size
  
  textSize(12); //size of the second text of the band
  fill(255, 200); //color of the text -making it a little less white
  text("Coldplay", width / 2, 65); //name of text + size

  //Interactivity
  //when the mouse doesn't click, the lyrics move normally 
  //if mouse is clicked and stays on the canvas the lyrics will speed up
  if (mouseIsPressed) { //mouse pressed function
    scroll += 30; //move fast 
  } else {
    scroll += 0.6; //move at the normal speed
  }

}

Future improvements:

Even though this is my first time coding and creating generative text, I’m proud of how it turned out especially because of the scrolling effect and how similar it feels to Spotify’s lyrics feature. In the future, I’d like to add the time duration of the song at the bottom, along with play and pause buttons to make it feel more realistic. I also want to add small music note icons and experiment with the spacing between specific lines to match the original lyrics.

Assignment 4: The Text that Spins.

“You can make anything by writing” – C. S. Lewis

Concept:

I’ve been watching a few of Patt Vira’s videos on coding and one of them about generative text jumped out to me. In this video she made the text rotate in a interesting pattern. So I followed along the video and decided to add more to it to make it more interactive in that sense. I wanted to see if it is possible to change the font, to change the message and have some sort of mouse contact with it. Whilst the font change and user inputted message was fine, learning to manipulate with position vectors was a bit of a challenge to learn. But this was quite a fun project to extend and make. Below is the final product.

How it’s made:

So the code is done with points, where the points are displayed based on the text’s poistion. Then lines are drawn to give that 3D effect of the code. Now this code utilizes the angles, and degrees which I will be honest, I struggle to understand as they were quite, finiky to say the least.

But then the text itself is displayed on the screen, in the rotational motion and in 3D. Again, learning this was quite a challenge but it was interesting nonetheless. And then of course, making it so the user could input a bit of code was done with the createInput function. There’s a text box below where the user can generate any text they want and it will be displayed.

And of course then came making a list of different fonts, and a mousePressed function to cycle through the various different fonts.

But the challenging part was still the vectors and manipulating the mouse.

Highlighted bit of Code I’m proud of:

So figuring this out took some time but I believe I got it down for the most part. The idea is to see the distance of the mouse with the points on screen. In this way, we can measure how far the mouse is from a given point so it can have some force when applied.

Then seeing the distance as it gets closer, the force in terms of a vector is applied to a point. Then its just simply adding or subtracting that vector so that point can go back to its original position.

But of course to make it smoother, I found out there is a function called lerp which calculates the number between two numbers, following some incriment. In this case, it can be used to see the distance between the origin point, and the vector point, and in a sense, make a line. Then depending on the incriment, that number, or in our case the point, will travel based on the speed provided from the incriment.

let mX = mouseX - 100;
let mY = mouseY - 300;

for (let i = 0; i < points.length; i++) {
let p = points[i];

// The variable d checks the distance from the mouse to any given point
let d = dist(mX, mY, p.x, p.y);

// These if elses make it so if the mouse is getting closer, then some force is applied to push the points
if (d < 50) {
let pushForce = 5; 
if (mX < p.x) p.x += pushForce;
else p.x -= pushForce;

if (mY < p.y) p.y += pushForce;
else p.y -= pushForce;
}

//I found this lerp function makes it so the points return back to their original position
p.x = lerp(p.x, p.originX, 0.1);
p.y = lerp(p.y, p.originY, 0.1);

Reflection

I will say, I wish I could do more with this code. Obviously time constraints and many assignments coming up did hinder the overall product but I feel like some ways I can expand on it is by making different designs of the typography. Or even, finally figuring out how to make the text spin in different directions. However I feel confident in what I learned so far through this assignment so hopefully I can use this to expand on it for the midterm project.

Week 4- Reading

One thing that drives me crazy is QR-code restaurant ordering. I scan the code and it opens a slow website that is hard to use. Important things are hidden, like how to add notes (“no ice,” “no peanuts”), and the buttons are often small or confusing. Sometimes the page refreshes and my order disappears, so I have to start over. It makes me feel like I’m doing extra work just to buy food.

Using Norman’s design ideas, this could be improved in a few simple ways. First, the main actions should be obvious, like “Order,” “Ask for help,” and “Pay.” Second, the steps should match how people actually think: pick items, customize, review, then submit. Third, the system needs clear feedback, like “Added to cart,” “Order sent,” and a confirmation screen, so I know it worked. It should also prevent common mistakes by reminding me if I forgot a required choice, like size or toppings. Finally, it should save my progress if the internet is bad, instead of deleting everything.

We can apply the same principles to interactive media, like games, apps, VR, or interactive art. The most important thing is discoverability: people should quickly understand what they can do. Interactive objects should have clear signs, like a highlight, an icon, or a small animation that hints “touch me” or “pick me up.” Controls should also feel natural. If I move something left, the result should move left, not the opposite, unless the experience clearly explains why.

Feedback is also essential in interactive media. When I tap, grab, or press something, the system should respond right away with sound, vibration, movement, or a visual change. This makes the experience feel reliable. Good design also helps users recover from errors. There should be a clear way to undo, restart, or exit, so users don’t get stuck feeling confused. Overall, Norman’s principles remind us that if many people struggle, the design should change—not the user.

Week 4 – Creative Reading

Norman’s idea that when a design doesn’t work for multiple people, the design itself is the problem actually changed the way I view things. Normally when certain designs don’t work, I either get annoyed at myself for not knowing how to use them or just confused. One thing that drives me crazy is the D2 sensory doors on campus because even though they are automatic, I cannot seem to get into D2 smoothly without fighting with the doors. When pushing the door, it takes a while for it to move, and then sometimes when I enter while the door is opening, it just closes on me with no signal or sign for me to move. When I first came to university during my Marhaba Week and the first week of classes, I would always worry about the doors because something would always happen to me before I could actually get in the building to eat lunch or breakfast. After reading and applying Norman’s principles, I understand what has been happening for all those weeks I struggled with this issue. There is a lack of clear feedback and signifiers due to the lack of sensors (there is one sensor on one door, but it takes a few seconds to open, and it is only for the exit). There should be a system that responds to give clues and hints for the users. This model can be improved easily, but unfortunately, it is still a work in progress.

In interactive media, I realized that when a sketch takes a while to load because of an error, for example, or maybe the functions or buttons on the canvas don’t react, it causes a delay in the system. Users will tend to be confused and won’t know how to solve those issues. If they try to play around with the system or reset it, it can cause even more delays. Norman’s human-centered design reminds me that interaction is not just about making something work; instead, it’s actually about making it understandable. This is something I hope to carry with me moving forward, especially after becoming aware of these issues and experiencing them in real life.

Week 4 – Data Visualization

Concept

I am from Moscow, and recently somehow I had a lot of conversations about metro.  Moscow metro has a lot of different lines and more than 300 stations, and I wanted to visualize it in some way.

© Transport.mos.ru, 2025

I found data on all the stations and lines on official dataset by Moscow Government and used it (link doesn’t open without Russia VPN). Sadlly, even this the fullest dataset didn’t have coordinates on stations, so I decided to adjust the concept. Now, my piece displays all the stations with their respective color in the random places on the canvas, and then slowl draws connections between them. This way, it shows how complex the system is and how many connection there are, because at some point it becomes impossible to even differentiate which line is from which points, and I only draw one connection from one dot. I think it perfectly serves to the idea of showing complexity of the metro at my hometown.

Highlight Code

The part I struggled the most in the coding was extracting data: in the row, it was divided by semicolons, not commas, and the language was Russian, of course, and the writing system was cyrillic. I struggled to understand what is written where in the original document and to clear the data so I can properly extract parts that I need.

//clear the data from garbage that prevents from proper extraction of data
function cleanCell(dirtyData) {
  if (!dirtyData) return "";
  let str = String(dirtyData);
  let match = str.match(/value=(.*?)\}/); //The Regex from GEMINI: see if there's repeated character up to the curly braces
  if (match && match[1]) return match[1]; //return actual data from regex
  return str.replace(/^"|"$/g, '').trim(); //replace the quotations from the beggining and the end of the line and clear up additional spaces
}

This was the part I learned from the most. It uses Regex (.*?)\}/ and /^”|”$/g to check the data. Basically these characters represent some pattern the computer is checking. For instance, /^”|”$/g: /^” matches the quotation mark in the beggining of the line, | serves as logical OR, “$/ matches the mark in the end of the line, g allows the program run even after the first match. I didn’t know about this method but I find it really useful in working with data.

Overall, I created a class for stations, so each station object holds the line name and the station name, and has a method for drawing the node as a small circle with color of its line. All stations are added to the dictionary as values for the key that is their line name. Then, by the line name computer accesses all the stations on this line and slowly draws connections one by one in random order using lerp function. Also, the user can access the code and toggle the names of the stations: choose to show them or see the sketch without them at all. Upon click the user can restart the sketch thanks to mouseClicked() function.

Reflection

I think it would be really nice to somehow find data on stations with actual coordinates, so I can display them on canvas as they positioned in real life. After that, I believe it’s possible to experiment with way of connection all them: from real way, to more sharp or abstract style. I believe that this way it will look more like data respresentation and closer to my original idea.

Also I thought about grouping the stations by district and this way sort them by allocation each district a position on the canvas that will be close to its position on the real map.

Week 4 Generative Text Artwork Zere

Concept: I felt inspired by the generative text artworks we reviewed in our last class. I decided to construct the scene using repeated words, rather than the usual shapes or images.

Process: I really tried to simplify my task of creating this piece, as I think that my skills with JavaScript are quite limited. The challenging part for me was trying to understand how to map out/divide the canvas into regions for text. It’s not a shape with particular coordinates, and that is why it was a little hard for me. Here is an example from the code:

// sky
function drawSky() {
  fill(100, 160, 255);
  textSize(14);

  for (let y = 0; y < height / 2; y += 20) {
    for (let x = -50; x < width; x += 60) {
      text("sky", x + offset % 60, y);

My code:

let offset = 0;

function setup() {
  createCanvas(400, 400);
  textFont('Arial');
}

function draw() {
  background(255);
  offset += 0.5;

  drawSky();
  drawSun();
  drawBuildings(); //  static buildings!!!!!
  drawRoad();
  drawCars();     
}
// sky
function drawSky() {
  fill(100, 160, 255);
  textSize(14);

  for (let y = 0; y < height / 2; y += 20) {
    for (let x = -50; x < width; x += 60) {
      text("sky", x + offset % 60, y);
    }
  }
}
// sun
function drawSun() {
  fill(255, 180, 0);
  textSize(16);

  for (let y = 40; y < 120; y += 18) {
    for (let x = 250; x < 350; x += 40) {
      text("sun", x, y);
    }
  }
}
// bldngs
function drawBuildings() {
  fill(80);
  textSize(12);

  for (let y = height / 2; y < height - 80; y += 18) {
    for (let x = 0; x < width; x += 55) {
      text("building", x, y);
    }
  }
}
// road
function drawRoad() {
  fill(120);
  textSize(14);

  for (let y = height - 80; y < height; y += 20) {
    for (let x = -40; x < width; x += 60) {
      text("road", x - offset % 60, y);
    }
  }
}
//cars 
function drawCars() {
  textSize(16);

  let colors = [
    color(255, 0, 0),     // red
    color(255, 200, 0),   // yellow
    color(0, 180, 0)      // green
  ];

  let roadTop = height - 80;

  for (let i = 0; i < 3; i++) {
    fill(colors[i]);

    let y = roadTop + 25 + i * 15;
    let speed = 6 + i * 2; // FAST
    let x = (frameCount * speed) % (width + 80) - 80;

    text("car", x, y);
  }
}

Reflection: I constantly mention this, but I feel that, due to my limited ability with JavaScript, I’m unable to create pieces that match my imagination, which is why I tend to stick to safer and simpler options for the sake of my sanity. I will try to do more elaborate artworks in the future and expand my coding skills.

Week 4 Project – Kamila Dautkhan

My  concept:

I’ve been messing around with this p5.js sketch that’s basically a visualization of data moving through a network. I call it a packet stream. You’ve got these static “nodes” acting like servers, and then these little “packets” that just zip around the screen. It’s supposed to look like some kind of live monitor for a server. I also made it interactive so you can basically click anywhere to put a new packet into the mix, and if you hover your mouse near one it literally creates a yellow line like you’re intercepting it.

A highlight of some code that you’re particularly proud of:

I am really proud of this code because it isn’t just a simple hover effect, it actually uses a distance check to create a connection.

let d = dist(mouseX, mouseY, dataPackets[i].pos.x, dataPackets[i].pos.y);
if (d < 50) {
dataPackets[i].highlight();
}


How this was made:

I wanted the packets to move around naturally, but the math for the speed and direction was very hard to understand for me. I also couldn’t figure out how to stop them from disappearing into the edges of the screen before bouncing back. So I used AI to help me build the Packet class, specifically to get the physics right so they bounce off the walls smooth.

edges() {
if (this.pos.x > width – this.size/2 || this.pos.x < this.size/2) {
this.vel.x *= -1;
}
if (this.pos.y > height – this.size/2 || this.pos.y < this.size/2) {
this.vel.y *= -1;
}
}

Reflection and ideas for future work or improvements:

I am really proud of this work, however, to make it even more interactive I would make the packets actually travel between Node_1 and Node_2 instead of just floating aimlessly.