Week 4 – Generative Text Assignment

Concept:

For this project, I wanted to experiment with text functions while learning and applying different codes to create a scrolling lyrics display similar to Spotify, Apple Music, and YouTube. When I first looked at the assignment, I immediately wanted to recreate the full music interface that includes the album cover and the timeline of the song at the bottom. But instead, I decided to focus only on the scrolling lyrics to make it more creative and manageable.

I chose the song Yellow by Coldplay because it reminds me of my last bus ride after a field trip in senior year. It was our last day of school after finishing our final exams, and on the way back from IMG everyone in my class was saying goodbye to each other at the final stoplight before we all went home. That moment felt nostalgic and emotional which is why I wanted to incorporate that feeling into my work.

Inspo from Spotify: 

Embedded sketch: (try pressing on the screen)

How it was made:

I usually start by building the background and adding simple codes that I know like the colored box and the title text at the top, the background, the size of the canvas, etc. After that, I started off by creating an array to store the lyrics so I could easily reference each line later in the code.

Then I created the scroll variable so the lyrics would begin at the bottom of the screen. Using translate() along with push() and pop(), I was able to make the lyrics scroll upward. While working on this part, I kept experimenting because sometimes the text wouldn’t move the way I wanted it to move. I also had to adjust the speed because it was first set to 0.3 but since I included the full lyrics of the song, I felt that 0.3 was too slow. I decided to change it to 0.6 which made the movement feel more reasonable.

I used this loop:

for (let i = 0; i < lyrics.length; i++) { //going through the lyrics line by line 
  let yPos = i * 40; //each line is 40 pixels below the previous one -using the name yPos for the positioning of lines vertically (y-axis)

This allowed the lyrics to display line by line with 40 pixels of spacing between each one. That spacing helped create a smoother scroll and prevented the lines from looking crowded.

For interactivity, I added the mouseIsPressed function with the if/else functions so that when the mouse is pressed, the scroll speed increases to 30. When it’s not pressed, it goes back to the normal pace of 0.6. I liked adding this because it made the project more engaging instead of just automatically scrolling.

Resources:

Push and pop functions: (all the resources helped me understand how push and pop work through examples and descriptions I was able to make my own transformation)
https://www.youtube.com/watch?v=KSo_VEbsWks 

https://www.youtube.com/watch?v=o9sgjuh-CBM

https://p5js.org/reference/p5/push/

Translate:

https://p5js.org/reference/p5/translate/ (in order for my lyrics to scroll and keep moving up from their starting point I had to use the translate function)

Text:

https://p5js.org/tutorials/loading-and-selecting-fonts/ (learning how to use text fonts and functions)

https://p5js.org/reference/ (Typography section to understand the types of text functions)

I also kept going back to Professor Aya’s slides, Week 4.1 and Week 4.2

I also used Musixmatch to get the lyrics of the song Yellow by Coldplay

Hardest Part of the Code (and the Part I’m Most Proud Of):

 //First layer of the lyrics 
push(); //starting a "transformation state" - using 'push' to save the current canvas settings
translate(10, height - scroll); //starting to move the original position 0,0 to 10 pixels from the left and being close to the bottom of the canvas 

for (let i = 0; i < lyrics.length; i++) { //going through the lyrics line by line 
  let yPos = i * 40; //each line is 40 pixels below the previous one -using the name yPos for the positioning of lines vertically (y-axis)
  
  //black txt if below the middle and white if above
  let currentY = (height - scroll) + yPos;//used to figure out the positions of the line
  if (currentY < height / 2) { //checking if the lyric is above the middle half, if it is it will change color
    fill(255); //the color of the text -white
  } else { //if it is below the screen it will..
    fill(0);
  }
  
  textSize(18); //text size of the lyrics 
  textStyle(BOLD); //adding bold text
  text(lyrics[i], 0, yPos, 280); //in order for the long lyrics to not go off the screen -lyrics is drawn inside this 280 sized pixel 
}
pop(); //concluding the end of the transformation so the other header doesnt move too

The hardest part was understanding how push(), pop(), and translate() all worked without affecting the rest of my design. The push() allowed me to save the current canvas settings before transforming it. Then with [translate(10, height – scroll);] I was able to shift the origin point so the lyrics would start near the bottom and move upward as the scroll value increased.

Inside the loop, [let yPos = i * 40;] this function made each lyric line 40 pixels below the previous one which keeps everything equal and smooth.

Then I used [let currentY = (height – scroll) + yPos;] to calculate the piston of each line on the canvas so that I can check where the lyric is positioned which will determine if it would change from black text to white (similar to Spotify). If the lyric was above the middle of the screen, it changed to white and if not it remained black until it reaches that point.

Similar to the issues I faced before, I had a hard time keeping the text inside the canvas because it would always go out. I decided to use [text(lyrics[i], 0, yPos, 280);] that draws each lyric at the x-position 0 and y-position yPos while being inside a 280-pixel text box so long lines wouldn’t overflow off the screen.

I’m proud of this section because even though it took time to understand, I was able to control the translation without changing the rest of my code. At one point I accidentally deleted the entire section, which was frustrating because it took me a while to feel confident in it, but since I practiced it before, I was able to rewrite it again.

Issues I faced:

At first, the lyrics started in the middle of the canvas and would bleed outside the frame which was a struggle because I couldn’t figure out how to fix it for a second. I remembered Professor Mang explaining how small positioning errors can happen when centering the text exactly in the middle because it will start exactly there instead of being all on the center. I also carefully adjusted the placement using translate() and the text box width: [text(lyrics[i], 0, yPos, 280);] that helped keep everything within the screen and made the scrolling smoother.

Final code: 

let lyrics = [//using the name lyrics for the array/list
  //adding all the lyrics of the song from Yellow -Coldplay
  "Look at the stars",
  "Look how they shine for you",
  "And everything you do",
  "Yeah, they were all yellow",
  "I came along",
  "I wrote a song for you",
  "And all the things you do",
  "And it was called, \"Yellow\"",
  "So, then I took my turn",
  "Oh, what a thing to have done",
  "And it was all yellow",
  "Your skin, oh yeah, your skin, and bones",
  "Turn into something beautiful",
  "And you know, you know I love you so",
  "You know I love you so",
  "I swam across",
  "I jumped across for you",
  "Oh, what a thing to do",
  "'Cause you were all yellow",
  "I drew a line",
  "I drew a line for you",
  "Oh, what a thing to do",
  "And it was all yellow",
  "And your skin, oh yeah, your skin, and bones",
  "Turn into something beautiful",
  "And you know, for you, I'd bleed myself dry",
  "For you I'd bleed myself dry",
  "It's true",
  "Look how they shine for you",
  "Look how they shine for you",
  "Look how they shine for-",
  "Look how they shine for you",
  "Look how they shine for you",
  "Look how they shine",
  "Look at the stars",
  "Look how they shine for you",
  "And all the things that you do"
];

let scroll = 0; //letting the lyrics start scrolling vertically

function setup() {
  createCanvas(300, 500); //canvas size
  textAlign(LEFT, TOP);  //postion of the text
  textFont('Helvetica'); //text font 
}

function draw() {
  background(158, 91, 28); //background color 'burnt orange'

   //First layer of the lyrics 
  push(); //starting a "transformation state" - using 'push' to save the current canvas settings
  translate(10, height - scroll); //starting to move the original position 0,0 to 10 pixels from the left and being close to the bottom of the canvas 
  
  for (let i = 0; i < lyrics.length; i++) { //going through the lyrics line by line 
    let yPos = i * 40; //each line is 40 pixels below the previous one -using the name yPos for the positioning of lines vertically (y-axis)
    
    //black txt if below the middle and white if above
    let currentY = (height - scroll) + yPos;//used to figure out the positions of the line
    if (currentY < height / 2) { //checking if the lyric is above the middle half, if it is it will change color
      fill(255); //the color of the text -white
    } else { //if it is below the screen it will..
      fill(0);
    }
    
    textSize(18); //text size of the lyrics 
    textStyle(BOLD); //adding bold text
    text(lyrics[i], 0, yPos, 280); //in order for the long lyrics to not go off the screen -lyrics is drawn inside this 280 sized pixel 
  }
  pop(); //concluding the end of the transformation so the other header doesnt move too
  
  //The scrolling movement 
  scroll += 0.6; //Speed of the scroll to make it a little faster since its the full song being used

  //Restarting the lyrics loop
  //checking if the scroll distance is greater > than the total height of the list
   if (scroll > (lyrics.length * 40) + height) { //calculation of height from the number of lines multiplied by 40 pixels each
   scroll = 0; //restarting the loop so the lyrics can come back from the bottom
  }

  //The title on the top
  noStroke(); //removing the outline of the rect
  fill(158, 91, 28); //color of background 
  rect(0, 0, width, 100); //adding a rect so that the lyrics can go under it -similar to spotify

  fill(255); //color of the text 'yellow'
  textAlign(CENTER); //adding it to the center of the frame
  textStyle(NORMAL);
  textSize(14); //size of text
  text("Yellow", width / 2, 45); //name of text + size
  
  textSize(12); //size of the second text of the band
  fill(255, 200); //color of the text -making it a little less white
  text("Coldplay", width / 2, 65); //name of text + size

  //Interactivity
  //when the mouse doesn't click, the lyrics move normally 
  //if mouse is clicked and stays on the canvas the lyrics will speed up
  if (mouseIsPressed) { //mouse pressed function
    scroll += 30; //move fast 
  } else {
    scroll += 0.6; //move at the normal speed
  }

}

Future improvements:

Even though this is my first time coding and creating generative text, I’m proud of how it turned out especially because of the scrolling effect and how similar it feels to Spotify’s lyrics feature. In the future, I’d like to add the time duration of the song at the bottom, along with play and pause buttons to make it feel more realistic. I also want to add small music note icons and experiment with the spacing between specific lines to match the original lyrics.

Assignment 4: The Text that Spins.

“You can make anything by writing” – C. S. Lewis

Concept:

I’ve been watching a few of Patt Vira’s videos on coding and one of them about generative text jumped out to me. In this video she made the text rotate in a interesting pattern. So I followed along the video and decided to add more to it to make it more interactive in that sense. I wanted to see if it is possible to change the font, to change the message and have some sort of mouse contact with it. Whilst the font change and user inputted message was fine, learning to manipulate with position vectors was a bit of a challenge to learn. But this was quite a fun project to extend and make. Below is the final product.

How it’s made:

So the code is done with points, where the points are displayed based on the text’s poistion. Then lines are drawn to give that 3D effect of the code. Now this code utilizes the angles, and degrees which I will be honest, I struggle to understand as they were quite, finiky to say the least.

But then the text itself is displayed on the screen, in the rotational motion and in 3D. Again, learning this was quite a challenge but it was interesting nonetheless. And then of course, making it so the user could input a bit of code was done with the createInput function. There’s a text box below where the user can generate any text they want and it will be displayed.

And of course then came making a list of different fonts, and a mousePressed function to cycle through the various different fonts.

But the challenging part was still the vectors and manipulating the mouse.

Highlighted bit of Code I’m proud of:

So figuring this out took some time but I believe I got it down for the most part. The idea is to see the distance of the mouse with the points on screen. In this way, we can measure how far the mouse is from a given point so it can have some force when applied.

Then seeing the distance as it gets closer, the force in terms of a vector is applied to a point. Then its just simply adding or subtracting that vector so that point can go back to its original position.

But of course to make it smoother, I found out there is a function called lerp which calculates the number between two numbers, following some incriment. In this case, it can be used to see the distance between the origin point, and the vector point, and in a sense, make a line. Then depending on the incriment, that number, or in our case the point, will travel based on the speed provided from the incriment.

let mX = mouseX - 100;
let mY = mouseY - 300;

for (let i = 0; i < points.length; i++) {
let p = points[i];

// The variable d checks the distance from the mouse to any given point
let d = dist(mX, mY, p.x, p.y);

// These if elses make it so if the mouse is getting closer, then some force is applied to push the points
if (d < 50) {
let pushForce = 5; 
if (mX < p.x) p.x += pushForce;
else p.x -= pushForce;

if (mY < p.y) p.y += pushForce;
else p.y -= pushForce;
}

//I found this lerp function makes it so the points return back to their original position
p.x = lerp(p.x, p.originX, 0.1);
p.y = lerp(p.y, p.originY, 0.1);

Reflection

I will say, I wish I could do more with this code. Obviously time constraints and many assignments coming up did hinder the overall product but I feel like some ways I can expand on it is by making different designs of the typography. Or even, finally figuring out how to make the text spin in different directions. However I feel confident in what I learned so far through this assignment so hopefully I can use this to expand on it for the midterm project.

Week 4- Reading

One thing that drives me crazy is QR-code restaurant ordering. I scan the code and it opens a slow website that is hard to use. Important things are hidden, like how to add notes (“no ice,” “no peanuts”), and the buttons are often small or confusing. Sometimes the page refreshes and my order disappears, so I have to start over. It makes me feel like I’m doing extra work just to buy food.

Using Norman’s design ideas, this could be improved in a few simple ways. First, the main actions should be obvious, like “Order,” “Ask for help,” and “Pay.” Second, the steps should match how people actually think: pick items, customize, review, then submit. Third, the system needs clear feedback, like “Added to cart,” “Order sent,” and a confirmation screen, so I know it worked. It should also prevent common mistakes by reminding me if I forgot a required choice, like size or toppings. Finally, it should save my progress if the internet is bad, instead of deleting everything.

We can apply the same principles to interactive media, like games, apps, VR, or interactive art. The most important thing is discoverability: people should quickly understand what they can do. Interactive objects should have clear signs, like a highlight, an icon, or a small animation that hints “touch me” or “pick me up.” Controls should also feel natural. If I move something left, the result should move left, not the opposite, unless the experience clearly explains why.

Feedback is also essential in interactive media. When I tap, grab, or press something, the system should respond right away with sound, vibration, movement, or a visual change. This makes the experience feel reliable. Good design also helps users recover from errors. There should be a clear way to undo, restart, or exit, so users don’t get stuck feeling confused. Overall, Norman’s principles remind us that if many people struggle, the design should change—not the user.

Week 4 – Creative Reading

Norman’s idea that when a design doesn’t work for multiple people, the design itself is the problem actually changed the way I view things. Normally when certain designs don’t work, I either get annoyed at myself for not knowing how to use them or just confused. One thing that drives me crazy is the D2 sensory doors on campus because even though they are automatic, I cannot seem to get into D2 smoothly without fighting with the doors. When pushing the door, it takes a while for it to move, and then sometimes when I enter while the door is opening, it just closes on me with no signal or sign for me to move. When I first came to university during my Marhaba Week and the first week of classes, I would always worry about the doors because something would always happen to me before I could actually get in the building to eat lunch or breakfast. After reading and applying Norman’s principles, I understand what has been happening for all those weeks I struggled with this issue. There is a lack of clear feedback and signifiers due to the lack of sensors (there is one sensor on one door, but it takes a few seconds to open, and it is only for the exit). There should be a system that responds to give clues and hints for the users. This model can be improved easily, but unfortunately, it is still a work in progress.

In interactive media, I realized that when a sketch takes a while to load because of an error, for example, or maybe the functions or buttons on the canvas don’t react, it causes a delay in the system. Users will tend to be confused and won’t know how to solve those issues. If they try to play around with the system or reset it, it can cause even more delays. Norman’s human-centered design reminds me that interaction is not just about making something work; instead, it’s actually about making it understandable. This is something I hope to carry with me moving forward, especially after becoming aware of these issues and experiencing them in real life.

Week 4 – Data Visualization

Concept

I am from Moscow, and recently somehow I had a lot of conversations about metro.  Moscow metro has a lot of different lines and more than 300 stations, and I wanted to visualize it in some way.

© Transport.mos.ru, 2025

I found data on all the stations and lines on official dataset by Moscow Government and used it (link doesn’t open without Russia VPN). Sadlly, even this the fullest dataset didn’t have coordinates on stations, so I decided to adjust the concept. Now, my piece displays all the stations with their respective color in the random places on the canvas, and then slowl draws connections between them. This way, it shows how complex the system is and how many connection there are, because at some point it becomes impossible to even differentiate which line is from which points, and I only draw one connection from one dot. I think it perfectly serves to the idea of showing complexity of the metro at my hometown.

Highlight Code

The part I struggled the most in the coding was extracting data: in the row, it was divided by semicolons, not commas, and the language was Russian, of course, and the writing system was cyrillic. I struggled to understand what is written where in the original document and to clear the data so I can properly extract parts that I need.

//clear the data from garbage that prevents from proper extraction of data
function cleanCell(dirtyData) {
  if (!dirtyData) return "";
  let str = String(dirtyData);
  let match = str.match(/value=(.*?)\}/); //The Regex from GEMINI: see if there's repeated character up to the curly braces
  if (match && match[1]) return match[1]; //return actual data from regex
  return str.replace(/^"|"$/g, '').trim(); //replace the quotations from the beggining and the end of the line and clear up additional spaces
}

This was the part I learned from the most. It uses Regex (.*?)\}/ and /^”|”$/g to check the data. Basically these characters represent some pattern the computer is checking. For instance, /^”|”$/g: /^” matches the quotation mark in the beggining of the line, | serves as logical OR, “$/ matches the mark in the end of the line, g allows the program run even after the first match. I didn’t know about this method but I find it really useful in working with data.

Overall, I created a class for stations, so each station object holds the line name and the station name, and has a method for drawing the node as a small circle with color of its line. All stations are added to the dictionary as values for the key that is their line name. Then, by the line name computer accesses all the stations on this line and slowly draws connections one by one in random order using lerp function. Also, the user can access the code and toggle the names of the stations: choose to show them or see the sketch without them at all. Upon click the user can restart the sketch thanks to mouseClicked() function.

Reflection

I think it would be really nice to somehow find data on stations with actual coordinates, so I can display them on canvas as they positioned in real life. After that, I believe it’s possible to experiment with way of connection all them: from real way, to more sharp or abstract style. I believe that this way it will look more like data respresentation and closer to my original idea.

Also I thought about grouping the stations by district and this way sort them by allocation each district a position on the canvas that will be close to its position on the real map.

Week 4 Generative Text Artwork Zere

Concept: I felt inspired by the generative text artworks we reviewed in our last class. I decided to construct the scene using repeated words, rather than the usual shapes or images.

Process: I really tried to simplify my task of creating this piece, as I think that my skills with JavaScript are quite limited. The challenging part for me was trying to understand how to map out/divide the canvas into regions for text. It’s not a shape with particular coordinates, and that is why it was a little hard for me. Here is an example from the code:

// sky
function drawSky() {
  fill(100, 160, 255);
  textSize(14);

  for (let y = 0; y < height / 2; y += 20) {
    for (let x = -50; x < width; x += 60) {
      text("sky", x + offset % 60, y);

My code:

let offset = 0;

function setup() {
  createCanvas(400, 400);
  textFont('Arial');
}

function draw() {
  background(255);
  offset += 0.5;

  drawSky();
  drawSun();
  drawBuildings(); //  static buildings!!!!!
  drawRoad();
  drawCars();     
}
// sky
function drawSky() {
  fill(100, 160, 255);
  textSize(14);

  for (let y = 0; y < height / 2; y += 20) {
    for (let x = -50; x < width; x += 60) {
      text("sky", x + offset % 60, y);
    }
  }
}
// sun
function drawSun() {
  fill(255, 180, 0);
  textSize(16);

  for (let y = 40; y < 120; y += 18) {
    for (let x = 250; x < 350; x += 40) {
      text("sun", x, y);
    }
  }
}
// bldngs
function drawBuildings() {
  fill(80);
  textSize(12);

  for (let y = height / 2; y < height - 80; y += 18) {
    for (let x = 0; x < width; x += 55) {
      text("building", x, y);
    }
  }
}
// road
function drawRoad() {
  fill(120);
  textSize(14);

  for (let y = height - 80; y < height; y += 20) {
    for (let x = -40; x < width; x += 60) {
      text("road", x - offset % 60, y);
    }
  }
}
//cars 
function drawCars() {
  textSize(16);

  let colors = [
    color(255, 0, 0),     // red
    color(255, 200, 0),   // yellow
    color(0, 180, 0)      // green
  ];

  let roadTop = height - 80;

  for (let i = 0; i < 3; i++) {
    fill(colors[i]);

    let y = roadTop + 25 + i * 15;
    let speed = 6 + i * 2; // FAST
    let x = (frameCount * speed) % (width + 80) - 80;

    text("car", x, y);
  }
}

Reflection: I constantly mention this, but I feel that, due to my limited ability with JavaScript, I’m unable to create pieces that match my imagination, which is why I tend to stick to safer and simpler options for the sake of my sanity. I will try to do more elaborate artworks in the future and expand my coding skills.

Week 4 Project – Kamila Dautkhan

My  concept:

I’ve been messing around with this p5.js sketch that’s basically a visualization of data moving through a network. I call it a packet stream. You’ve got these static “nodes” acting like servers, and then these little “packets” that just zip around the screen. It’s supposed to look like some kind of live monitor for a server. I also made it interactive so you can basically click anywhere to put a new packet into the mix, and if you hover your mouse near one it literally creates a yellow line like you’re intercepting it.

A highlight of some code that you’re particularly proud of:

I am really proud of this code because it isn’t just a simple hover effect, it actually uses a distance check to create a connection.

let d = dist(mouseX, mouseY, dataPackets[i].pos.x, dataPackets[i].pos.y);
if (d < 50) {
dataPackets[i].highlight();
}


How this was made:

I wanted the packets to move around naturally, but the math for the speed and direction was very hard to understand for me. I also couldn’t figure out how to stop them from disappearing into the edges of the screen before bouncing back. So I used AI to help me build the Packet class, specifically to get the physics right so they bounce off the walls smooth.

edges() {
if (this.pos.x > width – this.size/2 || this.pos.x < this.size/2) {
this.vel.x *= -1;
}
if (this.pos.y > height – this.size/2 || this.pos.y < this.size/2) {
this.vel.y *= -1;
}
}

Reflection and ideas for future work or improvements:

I am really proud of this work, however, to make it even more interactive I would make the packets actually travel between Node_1 and Node_2 instead of just floating aimlessly.

Week 4 – Reading Response | THE PSYCHOPATHOLOGY OF EVERYDAY THINGS

When I was younger, like every other midrange Gen-Z kid, I used to scroll on Buzzfeed as much as I could in class in middle school. The quizzes, the news, and the articles. I remember there would be lists of things in articles (25+ times X did Y! or 45+ gifts to get your X on Y!), and I’d find the ones about bad design choices really funny. Seeing the assignment for this reading response reminded me of these articles, so here are my own personal favourite (well, least favourite) bad design choices:

  • Microsoft Office’s “Save As” option. Schools here love using Office365, so we would use it for EVERYTHING. Class notes, essay drafts and final essays, powerpoints and even calling your friends during COVID. However, one thing that frustrated us throughout, was that in order for you to save your document, rather than letting you save it to your most active parent folders, it always, ALWAYS defaults to some remote directory, usually the OneDrive Cloud directory. Maybe I’m being dramatic, but this was a nightmare for us, because we were all living under a timer. Our schools would delete our OneDrives almost as soon as we would leave the school or graduate.

I get that this may be a marketing tactic to get people to use their products more, but maybe they could also consider getting people to LIKE the usability of their products more too. I’m not sure if they’ve made it easier now because I’ve switched and resorted to using Google sites more (easier sharing, easier saving, etc.). If I was to change this product in a non-marketing mindset, I would just make an option to save it to your folders next to the option to save it to your drive. If you want people to save it to OneDrive, you could just add that button first, but also have the other button there too.

  • Apple’s alarm sounds before iOS 17. I’m an avid user of Apple alarms, and I use Apple’s alarm sound that is literally titled “Alarm.” It sounds a lot like an alarm, in more of a ‘fire alarm, I need to run’ way and not a ‘wow, I could dance myself to be awake right now’, but it was one of Apple’s most used alarms nonetheless. Unfortunately, after updating my phone to iOS 17 (I had no choice), I realized that I couldn’t find that sound unless I scroll alllllll the way to the bottom of the list of alarm sounds, and then afterwards, you’d need to press on a button called “classic”, and THEN ONLY do you see the sound. As someone who is an avid alarm user every day and sleeps through them all (thus, the need for me to set 8-9 alarms every morning at varying times), I prefer having the same sound for all of them. It’s a hassle to individually change the sound each time.

Maybe it’s not as serious as I’m making it, and maybe the newer sounds are actually better. I haven’t listened to them yet. However, I don’t like the alarm sound interface in general. Regarding this problem in specific, however, would it not be easier to start off with two categories (‘new sounds’ and ‘old sounds’) and then users could decide whether they wanted the newer or the classic sounds? Rather than listing all the newer ones and then having to scroll and then click to see the older ones, it would be easier to sort it from the beginning.

The examples in this reading were very relatable, especially the example of the doors. I hate it when I push a door and it doesn’t push, so I need to pull it, but there is no way I could have known that it was a ‘pull’ door and not a ‘push’ door. I’ve bumped into the revolving doors at Galleria so often that now I need to stick my hands in front of me so I don’t hit my head. There were some principles that were mentioned in the text in regards to Human-Centered Design, which were affordances / signifiers / mapping / feedback / constraints. I was surprised that I hadn’t seen these principles before, because they made a lot of sense to me. It’s also one thing to understand a product, but you need to be able to discover the product well enough to understand it. If a product doesn’t follow HCD and we don’t understand it, what is the point? To apply the author’s principles of design to Interactive Media, maybe it’s a good idea to keep the user in mind. Rather than focusing on affordances of a product, I should focus on the signifiers instead, because they tell you how you can use the product the way it is meant to be used, not how to use the product for every possible use you can probably think up of. I want to look a bit more into UI/UX design in regards to mapping, because I think that would be much more useful. If I take all of these principles into account, I can make projects that are not only fun and interactive, but also understandable and used the way they are intended to.

Week 4 – Generative Text Assignment (Updated)

Concept:

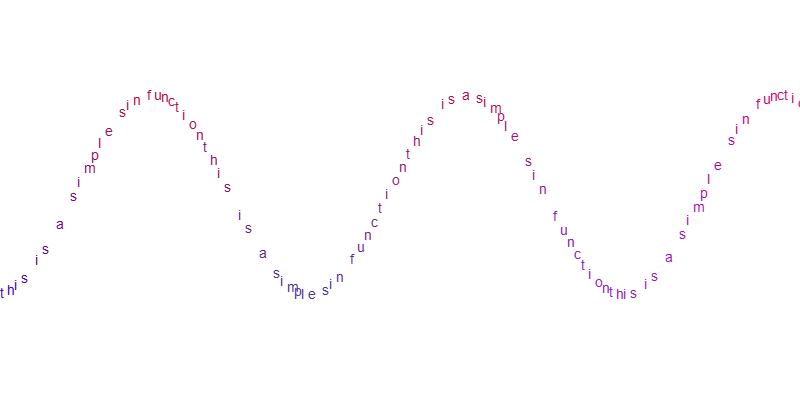
I sought a degree of inspiration from Camillie Utterback’s Text Rain. One key difference, while Utterback made text fall under ‘gravity’ and react to people’s silhouette, I decided to map text onto continuous mathematical functions (see example below)
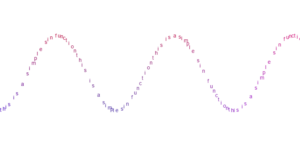
*The image above depicts a sine curve with the text ‘this is a simple sin function’.

Core Functionality and Features

The program contains a class appropriately called ‘fun’ (abbreviation for ‘function’) that contains attributes and methods, including a ‘display’ method to draw the curve onto the canvas. ‘fun’ also contains methods for changing the type of function – example from a ‘sin’ to a ‘log’ – and a method for fetching the function’s value from the parameter ‘t’ which in this case, spans the width of the canvas.

The ‘fun’ class once instantiated into an object contains data that alters how the drawn function appears. For example, the ‘sin’ function has the following ‘fun.function_data’:

let SineFunction = new fun("sin");

SineFunction.function_data[0] = 100;    // AMPLITUDE 'a'
SineFunction.function_data[1] = 0.01;   // Frequency 'r'
SineFunction.function_data[2] = 10;     // X Translation 'x'
SineFunction.function_data[3] = 200;    // Y Translation 'y'

/*
SineFunction.getF(t) {
  return a * Math.sin( r * t - x ) + y
}
*/

There are 7 basic types of mathematical functions that ‘fun’ can represent, namely sine (sin), cosine (cos), tangent (tan), hyperbolic sine (sinh), hyperbolic cosine (cosh), hyperbolic tangent (tanh), logarithmic (log).

Additionally, for more advanced generation, there is an additional class ‘algebricF’, that is used in a very similar way to ‘fun’, except that it can store up to two ‘fun’ or ‘algebricF’ classes in it, and performs a variety of specified algebraic operations on the class. Please do not mind the spelling mistake in the name of the class. The operations include addition, subtraction, multiplication, and division.

For interesting visuals, each drawn function’s text is assigned a color. The color is blue near the bottom of the screen, red near the top, and then this is blended with linear interpolation based on its ‘y’ position divided by the canvas ‘height’. A second linearly interpolated color is then chosen for the lateral span, from green at the left and purple (updated 20:20 GST, 16 FEB) at the right. The result of this interpolation is then linearly interpolated with the color of the vertical component, to grant a final color. The vertical color component gets priority because of how the third interpolation is carried out.

Demo

There are 3 demonstrations built into the code itself (courtesy of myself). They can be alternated between by pressing the keys ‘1’, ‘2’, ‘3’, or ‘0’ to disable all demonstrations. Click the screen to toggle whether the drawing moves or is paused.

Settings & Configurable Components

Certain settings and components may be configured in the Configuration section at the absolute top of the sketch. It is recommended that you read the comment or description given to each setting before playing around. It is also highly recommended to NOT alter any code beyond this unless you know what you are doing.

To create your own equations, declare an empty variable just before the setup function, and instantiate the correct ‘fun’ or ‘algebricF’ object inside of the setup function itself. Then, call its display method inside of the draw function. You may need to play around with the various components that constitute towards the function, especially amplitude and the y-translation.

Known Bugs

While there is a toggleable variable called ‘ADJUST_SCREEN’ in the Configuration section – which strives to adjust the screen to capture off-screen parts of the graph – it does not work correctly for all cases, thus it is recommended to use functions that stay within the screen if it is so that you actually want to see stuff.

Code & Additional Credits

As no external media or assistance (exception below) was used, I (Raja Qasim Khan) am the sole author and developer of the project’s code.

(Exception): https://p5js.org/reference/ was used for parts such as fetching date and time (for the canvas capture functionality) and the syntax of certain keywords in the language. No additional sources were employed.

Notes from the developer: I began by starting with the absolute basics of the project in the Processing 3 IDE for Python. Once the basics were done with, I re-wrote the code in JavaScript in p5.js and finished most of the remaining features there.

Please find the code below.

// CONFIGURATION
let TEXT_SIZE = 14; // size of the displayed text
let POINT_INCREMENT = 7; // the increment of character positioning in the display

// The gradient of colors in the Y axis
let MIN_COLOR_Y;
let MAX_COLOR_Y;

// The gradient of colors in the X axis
let MIN_COLOR_X;
let MAX_COLOR_X;

let MOVE_RESISTANCE = 1.2; // The resistance coefficient in moving the graph across the screen. -ve for backwards motion.

let ADJUST_SCREEN = false; // If the screen should translate to include outside points.

let PREBUILT_DISPLAY_NUMBER = 2; /*

Prebuilt by me for demo purposes:

0: don't display any demo.
1 : single 'cos' function.
2: multiple function demo.
3: algebric function demo.
4 show credit information.

*/

let OVERLAY_ENABLED = true; // whether the information overlay is enabled or not.

let BACKGROUND_COLOR = [255, 255, 255, 255]; // the background color RGBA

// GLOBALS
let current_offset = 0;
let isMoving = false;

// MAIN CODE

let F1;
let F2;

let F3;
let F4;

let FUN1;
let FUN2;
let FUN3;

let AF12;
let AF;

let CR;

function setup() {
  frameRate(30);
  createCanvas(800, 400);
  
  background(color(BACKGROUND_COLOR[0], BACKGROUND_COLOR[1], BACKGROUND_COLOR[2], BACKGROUND_COLOR[3]));
  
  F1 = new fun("cos");
  
  F1.function_data[0] = 100;
  F1.function_data[1] = 0.02;
  
  F1.function_data[2] = 0;
  F1.function_data[3] = 200;
  
  F2 = new fun("cos");
  
  F2.function_data[0] = -100;
  F2.function_data[1] = 0.02;
  
  F2.function_data[2] = 0;
  F2.function_data[3] = 200;
  
  F3 = new fun("tan");
  
  F3.function_data[0] = 20;
  F3.function_data[1] = 0.02;
  
  F3.function_data[2] = 0;
  F3.function_data[3] = 370;
  
  F4 = new fun("tan");
  
  F4.function_data[0] = 20;
  F4.function_data[1] = 0.02;
  
  F4.function_data[2] = 0;
  F4.function_data[3] = 30;
  
  FUN1 = new fun("sin");
  FUN1.function_data[0] = 100;
  FUN1.function_data[1] = 0.02;
  
  FUN1.function_data[2] = 0;
  FUN1.function_data[3] = 200/3;
  
  FUN2 = new fun("sin");
  FUN2.function_data[0] = 50;
  FUN2.function_data[1] = 0.04;
  
  FUN2.function_data[2] = 0;
  FUN2.function_data[3] = 200/3;
  
  FUN3 = new fun("cos");
  FUN3.function_data[0] = 100/3;
  FUN3.function_data[1] = 0.06;
  
  FUN3.function_data[2] = 0;
  FUN3.function_data[3] = 200/3;
  
  AF12 = new fun("algebricF");
  AF12.eq.fun1 = FUN1;
  AF12.eq.fun2 = FUN2;
  
  AF = new fun("algebricF");
  AF.eq.fun1 = AF12;
  AF.eq.fun2 = FUN3;
  
  CR = new fun("sin");
  
  CR.function_data[0] = 10;
  CR.function_data[1] = 0.005;
  
  CR.function_data[2] = 0;
  CR.function_data[3] = 200;
  
  MIN_COLOR_Y = color(0, 0, 255);
  MAX_COLOR_Y = color(255, 0, 0);
  
  MIN_COLOR_X = color(0, 255, 0);
  MAX_COLOR_X = color(255, 0, 255)
}

class algebricF {
  constructor() {
    /*
    (None) -> None
    
    A custom computation that MUST be an algebric combination of two 'fun's.
    
    can also be made of two algebricF's, or one algebricF.
    
    Operators: "+", "-", "/", "*"    
    */
    this.operator = "+";
    
    this.fun1 = "null";
    this.fun2 = "null";
  }
  
  getF(t) {
    if (this.operator == "+") {
      return this.fun1.getF(t) + this.fun2.getF(t);
      
    } else if (this.operator == "-") {
      return this.fun1.getF(t) - this.fun2.getF(t);
      
    } else if (this.operator == "/") {
      return this.fun1.getF(t) / this.fun2.getF(t);
      
    } else if (this.operator == "*") {
      
      return this.fun1.getF(t) * this.fun2.getF(t);
    }
  }
}

class fun {
  constructor(function_type) {
    /*
    (str) -> None
    
    Creates a new, displayable function.
    function_type s:
        "sin", "cos", "tan", "sinh", "cosh", "tanh", "log"
    */
    
    this.function_type = function_type;
    this.function_data = [];
    this.eq = new algebricF();
  }
  
  getF(t) {
    /*
    (float) -> float
    
    Returns the result of the function at 't'.
    */
    
    // Please do not mind the atrocity below. That is how I normally code else..if statements before deciding to switch to more readable ones for the sake of this class.
    
    if (this.function_type == "sin") {
      
      let a = this.function_data[0];
      let r = this.function_data[1];
      let x = this.function_data[2];
      let y = this.function_data[3];
      
      return a * Math.sin(r * t - x) - y;
    } else {
      
      if (this.function_type == "cos") {
        let a = this.function_data[0];
        let r = this.function_data[1];
        let x = this.function_data[2];
        let y = this.function_data[3];
      
        return a * Math.cos(r * t - x) - y;
      } else {
        
        if (this.function_type == "sinh") {
          let a = this.function_data[0];
          let r = this.function_data[1];
          let x = this.function_data[2];
          let y = this.function_data[3];
      
          return a * Math.sinh(r * t - x) - y;
        } else {
          
          if (this.function_type == "cosh") {
            let a = this.function_data[0];
            let r = this.function_data[1];
            let x = this.function_data[2];
            let y = this.function_data[3];
      
            return a * Math.cosh(r * t - x) - y;
          } else {
            
            if (this.function_type == "tan") {
              let a = this.function_data[0];
              let r = this.function_data[1];
              let x = this.function_data[2];
              let y = this.function_data[3];
      
              return a * Math.tan(r * t - x) - y;
            } else {
              
              if (this.function_type == "tanh") {
                let a = this.function_data[0];
                let r = this.function_data[1];
                let x = this.function_data[2];
                let y = this.function_data[3];
      
                return a * Math.tanh(r * t - x) - y;
              } else {
                
                if (this.function_type == "log") {
                  let b = this.function_data[0];
                  let r = this.function_data[1];
                  let x = this.function_data[2];
                  let y = this.function_data[3];
      
                  return r * Math.log(t - x) / Math.log(b) - y;
                } else {
                  
                  if (this.function_type == "algebricF") {
                    return this.eq.getF(t);
                  }
                }
              }
            }
          }
        }
      }
    }
  }
  
  changeTo(new_function_type) {
    /*
    (str) -> None
    
    Changes the function type and replaces all function_data with default values.
    */
    
    this.function_type = new_function_type;
    
    if (this.function_type == "sin" || this.function_type == "cos" || this.function_type == "sinh" || this.function_type == "cosh" || this.function_type == "tan" || this.function_type == "tanh" || this.function_type == "log") {
      this.function_data = [
        10,
        0.1,
        0,
        50
      ];
    } else if (this.function_type == "algebricF") {
      this.function_data = [];
      this.eq = new algebricF();
    }
  }
  
  display(txt) {
    /*
    (str) -> None
    
    Draws the function on screen using characters from txt.
    */
    
    let entry = -this.getF(current_offset * MOVE_RESISTANCE);
    let exit = -this.getF(width + current_offset * MOVE_RESISTANCE)
    
    let Y_OFFSET = (entry + exit) / 2
    
    if (Y_OFFSET < 0) {
      // pass
    } else if (Y_OFFSET > height) {
      // pass
    } else {
      Y_OFFSET = 0;
    }
    
    if (!ADJUST_SCREEN) {
      Y_OFFSET = 0;
    }
    
    for (let i = 0; i <= Math.trunc(width / POINT_INCREMENT); i++) {
      
      let Y = -this.getF(i * POINT_INCREMENT + current_offset * MOVE_RESISTANCE) - Y_OFFSET; // Inverted because of the coordinate system.
      
      if (isNaN(Y)) {
        continue;
      }
      
      let selected_char = txt[Math.trunc(i) % txt.length];
      
      fill(lerpColor(lerpColor(MAX_COLOR_Y, MIN_COLOR_Y, abs(Y) / height), lerpColor(MIN_COLOR_X, MAX_COLOR_X, i * POINT_INCREMENT / width), abs(i*Y * POINT_INCREMENT)/(width*height)));
      textSize(TEXT_SIZE);
      text(selected_char, i * POINT_INCREMENT, Math.trunc(Y));
    }
  }
}

function draw() {
  background(color(BACKGROUND_COLOR[0], BACKGROUND_COLOR[1], BACKGROUND_COLOR[2], BACKGROUND_COLOR[3]));
  
  if (PREBUILT_DISPLAY_NUMBER == 2) {
    
    F1.display("from nothing we were raised and with nothing we return");
    F2.display("from nothing we were raised and to everything we built");
  
    F3.display("and return to gardens we may");
    F4.display("and return to flames we will");
  } else if (PREBUILT_DISPLAY_NUMBER == 3) {
    
    AF.display("this is an algebric function");
  } else if (PREBUILT_DISPLAY_NUMBER == 1) {
    
    F1.display("this is a simple sin function");
  } else if (PREBUILT_DISPLAY_NUMBER == 4) {
    
    CR.display("Raja Qasim Khan (rk5260)")
  }


  if (isMoving) { // This translates the graph to create a cool moving illusion.
    
    current_offset++; // a tanslation for the lateral movement of the function(s).
  } else if (OVERLAY_ENABLED) {
    
    // display overlay menu.
    fill(color(255-BACKGROUND_COLOR[0], 255-BACKGROUND_COLOR[1], 255-BACKGROUND_COLOR[2])); // the inverse color
    textSize(14);
    
    text("Click to toggle.", 100, 20);
    text("Demo (press key): ", 100, 34);
    text("0: Disable demo.", 100, 48);
    text("1: Single cos demo.", 100, 62);
    text("2: Multi-function demo.", 100, 76);
    text("3: Algebric demo.", 100, 90);
    text("4: Credits info", 100, 104);
    text("T: Disable overlay!", 100, 118);
    text("C: Capture canvas (image).", 100, 132);
  }
}

function mouseClicked() {
  
  isMoving = !isMoving;
}

function keyPressed() {
  
  // Switch displayed prebuilt simulation.
  if (keyCode == 48) {
    
    PREBUILT_DISPLAY_NUMBER = 0;
  } else if (keyCode == 49) {
    
    PREBUILT_DISPLAY_NUMBER = 1;
  } else if (keyCode == 50) {
    
    PREBUILT_DISPLAY_NUMBER = 2;
  } else if (keyCode == 51) {
    
    PREBUILT_DISPLAY_NUMBER = 3;
  } else if (keyCode == 52) {
    
    PREBUILT_DISPLAY_NUMBER = 4;
  } else if (keyCode == 84) {
    
    OVERLAY_ENABLED = !OVERLAY_ENABLED;
  } else if (keyCode == 67) {
    
    // capture screenshot of canvas.
    saveCanvas("rqk_TextualGraphics_HH" + hour().toString() + "_MM" + minute().toString() + "_SS" + second().toString() + "_dd" + day().toString() + "_mm" + month().toString() + "_yyyy" + year().toString())
  }
}

Link to project: https://editor.p5js.org/rk5260/sketches/Y8JIsLCxj

Week 4 – Click to affirm, I guess? (Generative Text and Data Assignment)

Concept:

I really like Frutiger Aero, and I love things that are designed so badly that they just become funny and it actually works. I’ve fallen victim so many times to buying products with designs that were just so ugly and horrendous that it made me laugh. Lately, on my Pinterest, I keep seeing these stupid affirmation memes with really loud and emphatic text and completely random background and this horrendous gradient border. Naturally, I was so drawn to it, that now I have these stuck up on my wall back home. My parents are frustrated. My sister loves it.

I’m not a fan of making the same thing as something I see, but since I’m still a beginner to Javascript, I wanted to make something that I would enjoy making, especially in such a short period of time. So, I decided to make my own version of these. I hope you find this as funny as I do.

Artwork:

(I laughed a lot while making this.)

Process:

I had to make so many sections and so many functions and so many variables and etcetera, etcetera. Firstly, I had to import each image into the program, and I named each image by number so that importing them would be easier. I also made a list of affirmations I found online and through my friends onto a spreadsheet and imported it as a .csv file. Since I wanted the option of inputting your own affirmations, I made another list for user input.

function preload(){
  table = loadTable('Affirmations.csv','csv'); //csv file
  for (let i=0; i < totalImages; i++)
  {
    images.push(loadImage(i+'.jpg'));
  }
}

I loaded each row from the .csv file.

// load from csv file (I'm starting on row 2 because header lol)
 for (let r = 2; r < table.getRowCount(); r++){
   let line = table.getString(r,0);
   if (line) Affirmations.push(line); // prevent empty
)

After adding user input, I made a function to generate a new image every 3 seconds. There were multiple steps I had to take for this, which were:

FIRSTLY! Pick a random nature image:

let nextImgIndex;
  do {
    nextImgIndex = floor(random(images.length));
  } while (nextImgIndex == lastImgIndex);
  currentImg = images[nextImgIndex];
  lastImgIndex = nextImgIndex;

SECONDLY! Pick which list is currently active (the .csv file or the user input list):

let activeList;
if (modeCheckbox.checked() &&
   userAffirmations.length > 0) {
  activeList = userAffirmations;
} else {
  activeList = Affirmations;
}

THIRDLY! Pick a random affirmation from the chosen list:

if (activeList.length > 0){
   let nextTextIndex;
   do {
     nextTextIndex = floor(random(activeList.length));
   } while (nextTextIndex === lastTextIndex && activeList.length > 1);
   
   currentText = activeList[nextTextIndex];
   lastTextIndex = nextTextIndex;
 }

FOURTHLY! Add glow. Yay!

colorMode(HSB, 360, 100, 100);
 glowColor = color(random(360), 85, 100);
 colorMode(RGB);

For drawScene(), I used this code. I realized I could crop the nature images in the code (code is so cool… wow) so I did it in this.

function drawScene() {
  if (!currentImg || currentImg.width <= 1) return;

  // automatic crop image to square size
  let imgAspect = currentImg.width / currentImg.height;
  let canvasAspect = width / height;
  let sx, sy, sw, sh;
  if (imgAspect > canvasAspect) {
    sh = currentImg.height;
    sw = sh * canvasAspect;
    sx = (currentImg.width - sw) / 2;
    sy = 0;
  } else {
    sw = currentImg.width;
    sh = sw / canvasAspect;
    sx = 0;
    sy = (currentImg.height - sh) / 2;
  }
  
  image(currentImg, 0, 0, width, height, sx, sy, sw, sh);
  drawGlowBorders();

  // text style
  let txt = currentText;
  let maxWidth = width * 0.85;
  let fontSize = constrain(map(txt.length, 0, 50, 80, 40), 35, 90);

  push();
  translate(width / 2, height / 2);
  scale(1, 1.7); 
  textAlign(CENTER, CENTER);
  textFont('Arial');
  textStyle(BOLD);
  textSize(fontSize);

  drawingContext.shadowBlur = 30;
  drawingContext.shadowColor = glowColor.toString();
  fill(255);
  noStroke();
  
  text(txt, -maxWidth/2, -height/3.4, maxWidth, height/1.7);
  
  drawingContext.shadowBlur = 0;
  text(txt, -maxWidth/2, -height/3.4, maxWidth, height/1.7);
  pop();
}

I thought the glow borders at the very end were really funny to figure out, but this is what I ended up with.

function drawGlowBorders() {
  let bSize = 45;
  noFill();
  for (let i = 0; i < bSize; i++) {
    let alpha = map(i, 0, bSize, 180, 0);
    stroke(red(glowColor), green(glowColor), blue(glowColor), alpha);
    strokeWeight(1);
    rect(i, i, width - i*2, height - i*2);
  }
}

Reflection:

There’s a lot of things I want to improve. Obviously, with the current skill level and time that I have, I don’t think this would be feasible, but I wanted to make sure you could save your custom affirmations into a file you can download later. I also wanted to let you delete affirmations you didn’t like and add more (database management? I guess?).  I also found out that .csv files cannot store images, so I was limited to using only 21 images for now. I honestly made this so it could double not only as an assignment but also a funny thing for my friends to laugh at, so I think I achieved this, but I would like to play more with the generative aspect and data aspect of this. The text itself on the screen is not interactive (e.g. if I click it, nothing happens) and the data is not really visualized, more being used as a list to remove the need to individually type each affirmation into the code. I’m glad I figured out parts of the code that I know in Python though (like input) so hopefully that should make future projects easier.