
Concept
I am from Moscow, and recently somehow I had a lot of conversations about metro. Moscow metro has a lot of different lines and more than 300 stations, and I wanted to visualize it in some way.
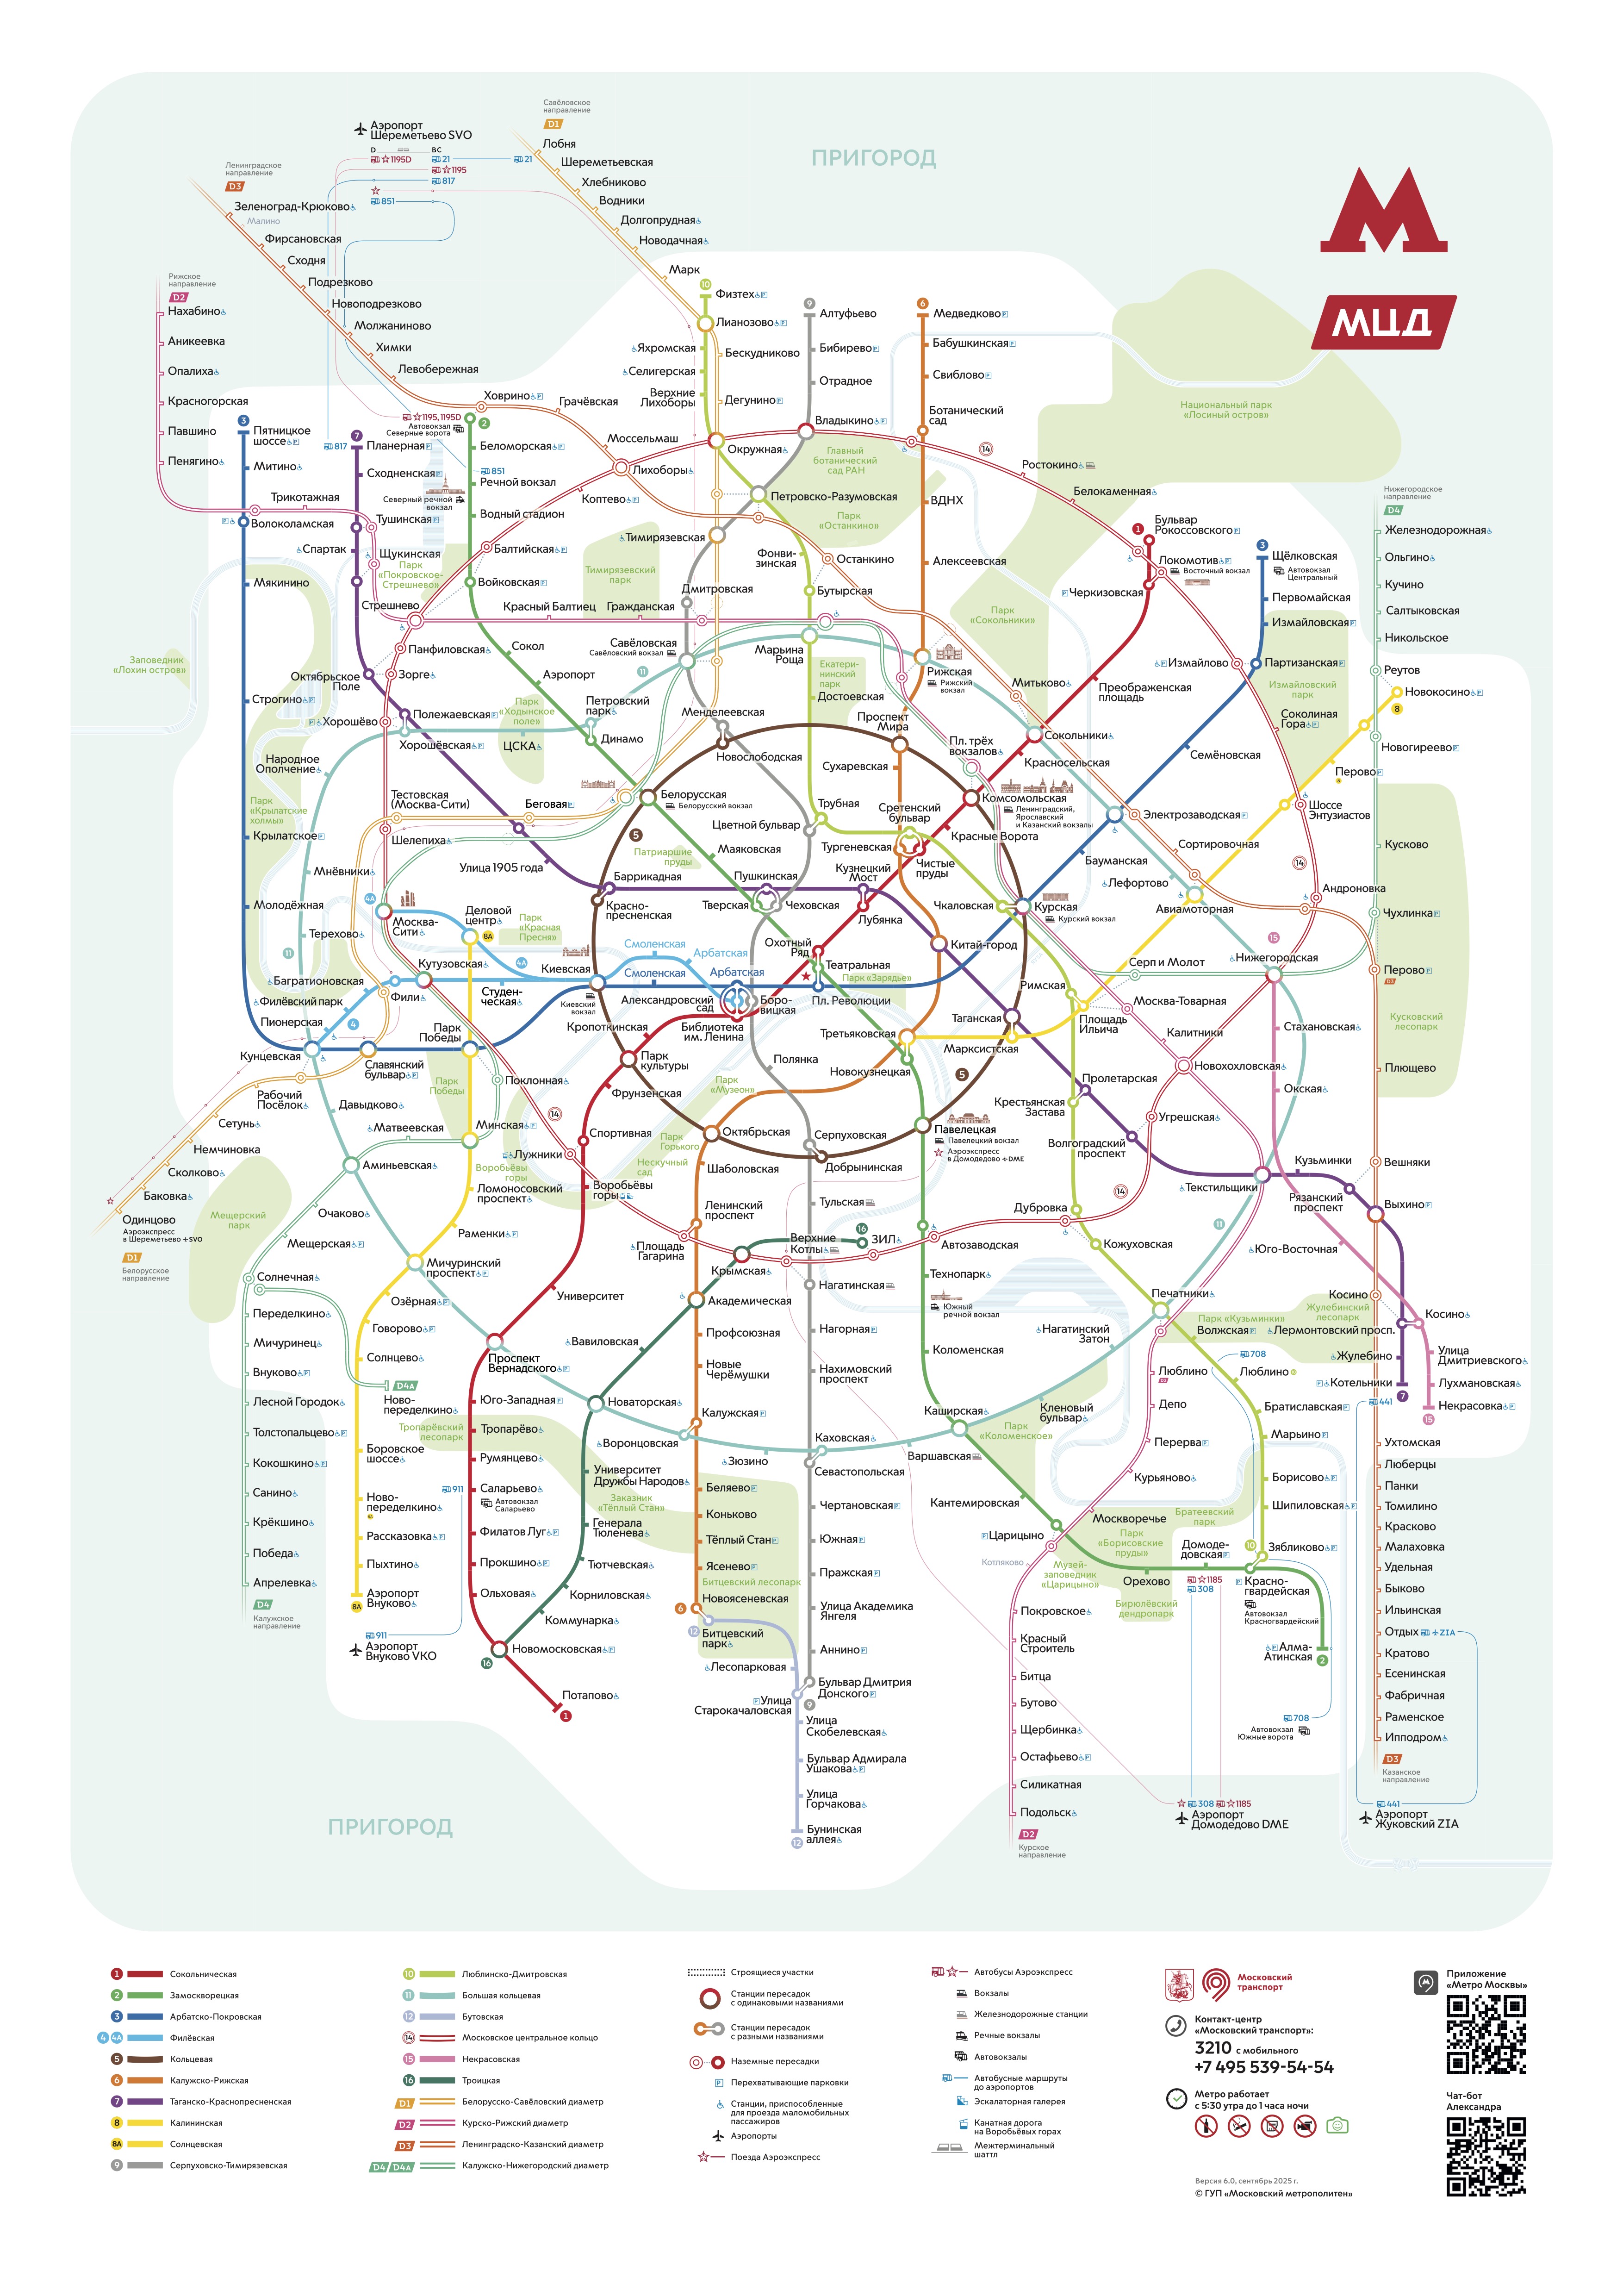
I found data on all the stations and lines on official dataset by Moscow Government and used it (link doesn’t open without Russia VPN). Sadlly, even this the fullest dataset didn’t have coordinates on stations, so I decided to adjust the concept. Now, my piece displays all the stations with their respective color in the random places on the canvas, and then slowl draws connections between them. This way, it shows how complex the system is and how many connection there are, because at some point it becomes impossible to even differentiate which line is from which points, and I only draw one connection from one dot. I think it perfectly serves to the idea of showing complexity of the metro at my hometown.
Highlight Code
The part I struggled the most in the coding was extracting data: in the row, it was divided by semicolons, not commas, and the language was Russian, of course, and the writing system was cyrillic. I struggled to understand what is written where in the original document and to clear the data so I can properly extract parts that I need.
//clear the data from garbage that prevents from proper extraction of data
function cleanCell(dirtyData) {
  if (!dirtyData) return "";
  let str = String(dirtyData);
  let match = str.match(/value=(.*?)\}/); //The Regex from GEMINI: see if there's repeated character up to the curly braces
  if (match && match[1]) return match[1]; //return actual data from regex
  return str.replace(/^"|"$/g, '').trim(); //replace the quotations from the beggining and the end of the line and clear up additional spaces
}
This was the part I learned from the most. It uses Regex (.*?)\}/ and /^”|”$/g to check the data. Basically these characters represent some pattern the computer is checking. For instance, /^”|”$/g: /^” matches the quotation mark in the beggining of the line, | serves as logical OR, “$/ matches the mark in the end of the line, g allows the program run even after the first match. I didn’t know about this method but I find it really useful in working with data.
Overall, I created a class for stations, so each station object holds the line name and the station name, and has a method for drawing the node as a small circle with color of its line. All stations are added to the dictionary as values for the key that is their line name. Then, by the line name computer accesses all the stations on this line and slowly draws connections one by one in random order using lerp function. Also, the user can access the code and toggle the names of the stations: choose to show them or see the sketch without them at all. Upon click the user can restart the sketch thanks to mouseClicked() function.
Reflection
I think it would be really nice to somehow find data on stations with actual coordinates, so I can display them on canvas as they positioned in real life. After that, I believe it’s possible to experiment with way of connection all them: from real way, to more sharp or abstract style. I believe that this way it will look more like data respresentation and closer to my original idea.
Also I thought about grouping the stations by district and this way sort them by allocation each district a position on the canvas that will be close to its position on the real map.