
Sketch and demo video below!
Concept:
This took a while to make but I am quite happy with how it turned out! First my reference for this was this Reddit post I saw about the visualization of a 4 bit adder. I thought it would be a perfect idea for data visualization, going back to the roots of how a computer performs calculations. This idea gave birth to this p5.js digital version.
Implementation:
The core logic of this code was simply drawing paths and gates at the time I specified them to draw them at. I will show an example of what I mean.
The coordinates are drawn manually, in a segments.
let b0_pA_to_X1 = [
  { x: 420, y: 630 },
  { x: 420, y: 600 },
  { x: 210, y: 600 },
  { x: 70, y: 600 },
  { x: 70, y: 450 },
];

let b0_pX2_to_sum = [
  { x: 165, y: 320 },
  { x: 165, y: 200 },
  { x: 810, y: 200 },
  { x: 810, y: 100 },
];

let b1_pX2_to_sum = [
  { x: 320, y: 320 },
  { x: 320, y: 250 },
  { x: 770, y: 250 },
  { x: 770, y: 100 },
];
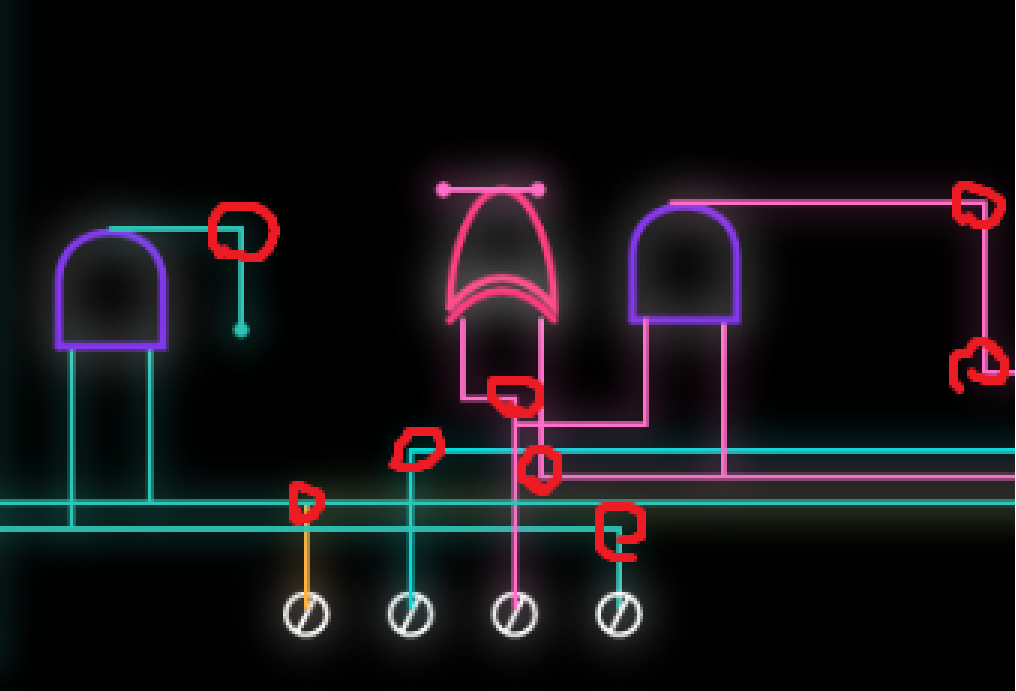
And what I mean by segments, is the areas highlighted with a red circle, any part of the path which switches direction is the segment I note down, and we use a drawpath function to draw a straight line from one segment to the next.
Now this is the paths we set, but how do we draw them? Once we click the start button, we have a variable that keeps track of this and when it is true we start drawing everything. Example:
if (timer > 1250 + 9500 * 0.5) {
  drawPath(b2_pA_to_An1, getP(1250 + 9500 * 0.5, 1500), cB2);
  PathStart = 1250 + 9500 * 0.5;
  PathDur = 1500;
  if (timer > PathStart + PathDur) {
    drawAND(
      917,
      550,
      50,
      40,
      cAnd,
      getP(PathStart, PathDur),
      startT + PathDur + PathStart
    );
    if (timer > PathStart + PathDur + 1000) {
      drawPath(b2_pAn1_to_Or, getP(PathStart + PathDur + 1000, 5000), cB2);
    }
  }
}
Here we check if a certain time has passed before we start drawing the path of the 3rd bit that goes from the first point to the first and gate. We use our drawpath function to get it drawn with a duration of 1.5 seconds that we specified. And since is the last path to the gate that we are drawing it to, we draw the and gate right after! Repeat this with every single path and gate and we have our sketch done… (Absolutely tedious)
Before moving on to the code I am proud of.
The nToB function converts a number no into its binary representation with n+1 bits. It works by checking each bit from the most significant to the least significant:
– no >> i shifts the number i bits to the right, bringing the target bit to the least significant position.
– & 1 extracts that bit (0 or 1).
– b.push(…) adds the bit to the array.
The result is an array of 0s and 1s representing the binary digits of the number, with the most significant bit first.
I am quite proud of the function I wrote that draws the paths and here is why.
// We use a signal here to keep track of everything. Uses progress (pr) to interpolate coordinates between wire nodes
function drawPath(pts, pr, col) {
  push();
  drawingContext.shadowBlur = 15; // Creating neon glow through canvas shadow context
  drawingContext.shadowColor = color(col);
  stroke(col);
  strokeWeight(2);
  noFill();
  let segs = pts.length - 1;
  let cur = floor(pr * segs); // Identifies which wire segment the signal is on
  let sPr = (pr * segs) % 1; // Progress within that specific segment (0.0 - 1.0)

  // Draws all wire segments that the signal has already "charged"
  for (let i = 0; i < cur; i++)
    line(pts[i].x, pts[i].y, pts[i + 1].x, pts[i + 1].y);

  if (cur < segs) {
    // lerp() calculates the point between A and B based on sPr percentage
    let x = lerp(pts[cur].x, pts[cur + 1].x, sPr);
    let y = lerp(pts[cur].y, pts[cur + 1].y, sPr);
    line(pts[cur].x, pts[cur].y, x, y);
    fill(col);
    circle(x, y, 4); // The "head" pulse of the path flow
  }
  pop();
}
The function itself takes 3 parameters, the points which are arrays of segment objects, the current progress of our path, and the color of the path.
What do I mean by segment objects? An object in java script can be made as such: {x:400, y:500} for example, where x and y are properties of the object, and 400 and 500 is the value of these properties (It is quite similar to how dictionaries work in python, if you wanna read more on java script objects go here). And for each path we have an array of these segment objects. For the progress, there a small function that takes in the start time, and the duration of the path and calculates the progress based on how much time has passed. And finally the color simply takes in a hex value. After that we define the design of the path and then we get into the main logic of the function.
The function itself is pretty well commented so I will briefly explain how the logic goes.
We first check how many segments the path has, and identify what segment we are currently on, and how much have we progressed through that specific segment (This is calculated by using the duiration we want givern in the code). We have a loop that draws every segment we have completed on screen, but how do we draw the incomplete segments giving us that smooth animation? Simple! That is where linear interpolation comes in play (Really look into this function if you are doing animations it is splendid).
If our current segment is before the last segment, we draw the path of the current segment, but we don’t wanna draw the full thing if we have not reached it yet yes? that is where we use the variable that tracks how much of the segment we traversed. So for example if we traveled 60% of the way of segment 2, we fully draw segment 1 and draw up to 60% of segment 2. We draw a circle at the point we are to have that leading circle animation of the path. And boom! That is how we get the smooth animation of the paths being drawn! Pretty nifty no?
Anyway besides that, the gates were simply messing around with bezier curves and a lot of trial and error till I got the shape I wanted.
Reflection:
I am very happy with how it turned out, however I wish to eventually remake this with a more… automated logic, since drawing everything manually was a pain, and if we have more than 4 bits this would simply take way too long to do. So if there is something I would want to improve about it, is to try lessen the manual aspect of writing this code and instead try to automate it, maybe with random segment points within a certain boundary could work.