Love making machine

In my mind, love is just a matter of increasingly intense oscillatory motion until one reaches a breaking point. I don’t replicate the ‘increasingly intense’ part in my project, but I do try to replicate the oscillatory nature of love, and love making. If you can successfully make the sensor oscillate between two thresholds in a certain time, the lights will go off, providing that sweet sweet release we all lust for. If you can’t do it fast enough, a single light will flash suggestively. Rhythmic motion is the essence of love! I’ll post a video as soon as I get my phone in the IM lab.

The hardware part of this project was pretty simple to hook up, but figuring out the software side was a little trickier. My code is messy and not very impressive. I did use some arrays, and for loops to light up 4 lights, instead of doing each one individually. This is useful because I could put in more lights, and all I’d have to do is tell my script that I have more lights, and just throw the new pin number in an array. I wonder if I can iterate over arrays directly in Arduino, like in Python…

Fooling the Machines

Code from class

So far, we’ve managed to get the micro controller to read digital & analog inputs, ad set a variety of fancy LED effects. Now it’s time to make some even more fancy things happen.

The microcontroller has the ability to red variable voltages, but what about sending out a variable voltage? Unfortunately, unless we’re using a high end microcontroller with a built in DAC (digital to analog converter), there’s no way to get a true analog voltage out of the microcontroller. However, we can fake it with a technique called Pulse Width Modification (PWM).

Continue reading “Fooling the Machines”

gravity snake game/live arduino plotting using matplotlib

A video showing my project in action can be found here. This week I spent more time developing the software behind my project than the hardware. On the hardware side things are pretty simple. I took the basic Arduino we made in lab on Wednesday, plugged in a pressure sensor I found lying around, and wrote the value of the analog port to the serial monitor. I even disabled the light. I discovered that Python has two interesting characteristics that allow one to interact with an Arduino. One, it has a library, pyserial, which allows one to read values coming in from a USB port, much like the serial monitor built into the Arduino software. Two, one can plot data in real time via matplotlibContinue reading “gravity snake game/live arduino plotting using matplotlib”

Potentiometer controls LED lights

This project is about potentiometer and LED lights. When you press the certain parts of potentiometer, the matched LEDs will be on. In this circuit, I divided the potentiometer into three parts according its shape are the top, middle and bottom.

Potentiometer Controls LED Lights

Continue reading “Potentiometer controls LED lights”

LightPulb

I spent a while refreshing on the coding we learned the other day, and found the part that involves sensors most intriguing. I tried analog input with the potentiometer, flex sensor, and photocell. I also asked Scott about the RGB LED and tried it with switches on my board. But all this review work didn’t really give me an idea what to do for the assignment. So I looked closely at the shelf full of electric parts, and found this magic stuff:

Continue reading “LightPulb”

Mood Ring

What My Project Does:

For this project I used an RGB light and the temperature sensor to create a simplified version of a mood ring. When the user touches the temperature sensor, the sensor detects a certain temperature that correlates with an output RGB color that could be associated with someone’s mood. The red indicates that person is very warm, possibly happy, and energetic. Green indicate the person is stable, under normal conditions. Blue, finally, indicates the person is cold from air conditioning, or is just feeling bitter that day.

How I Did It:

I read up the Arduino site figure out how to get the temperature sensor to spit out a number that correlated with temperature. When I was able to find the code online on how to get an output number from the sensor, I found specific ranges to use when determining when the specific color would turn on.

The red color turns on when the output voltage reads above 0.80. The green turns on between 0.78 and 0.80. Finally, anything below 0.78 is blue. These are all correlated to temperatures between 24° and 26° Celsius.

For the temperature coding, essentially I used a code that would take a floated number retrieved from the A0 pinhole, and then that number, when multiplied by 0.004882814 (as I found online), produces the voltage number. Within my loop function, I assigned the variable ‘voltage’ to the voltage number received by the sensor. This number then, when subtracted from 0.5 and multiplied by 100 (again, as I found online), was the equivalent to degrees Celsius. I then had the voltage and degrees C° printed in order to find the ranges for the lighting and to make sure the sensor was outputting stable numbers. At one point, the sensor I was using overheated and started outputting the temperature as -25°, so when I changed it out for another sensor it worked fine.

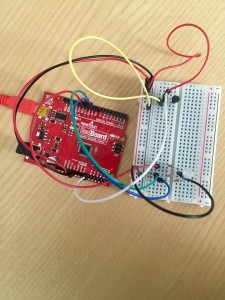
That’s a brief explanation of how the coding works. Below is the code with a few bits of commentary on what the coding means, followed by a video and set-up photo.

const int temperaturePin = 0;
int red = 11; //these correspond to the RGB pinholes
int green = 10;
int blue = 9;
void setup(){
  Serial.begin(9600); //For the sensor, this is the initial baud rate needed to match the speed of the code I'm running
  pinMode(red,OUTPUT);
  pinMode(green,OUTPUT);
  pinMode(blue,OUTPUT);
 
}
void loop() {
  float voltage, degreesC;
  
  voltage = getVoltage(temperaturePin); //(see below for the function that retrieves the voltage

  degreesC = (voltage - 0.5) * 100.0; //conversion of voltage to degrees

  Serial.print("voltage: "); //printing the voltage and corresponding degrees C
  Serial.print(voltage);
  Serial.print("  deg C: ");
  Serial.println(degreesC);
  delay(1000); 

  if(voltage > 0.80){ //for warmer temperatures, the light turns on as red
  digitalWrite(red,HIGH);
  } else {
    digitalWrite(red,LOW);
  }
  if(voltage > 0.78 && voltage < 0.80){ //for stable room temperature, the light turns on green
    digitalWrite(green,HIGH);
  } else {
    digitalWrite(green,LOW); 
  }
  if(voltage < 0.78){
    digitalWrite(blue,HIGH); //blue light for cooler temperatures
  } else {
    digitalWrite(blue,LOW);
  }
 
}

float getVoltage(int pin)   //This takes the A0 input and floats the number
{

 return (analogRead(pin) * 0.004882814); //the A0 number is multiplied by this to retrieve the voltage  
}


Setup of RedBoard:

12047560_1217202044962162_1230835908_n