Week 9 — Reading Response

Reading Tom Igoe’s articles helped me understand physical computing in a more thoughtful way, beyond just wiring things up and making LEDs blink (which to be fair, I do think is a preconceived notion that I have been gradually worn down through consecutive projects and readings in the class). In the first article (“Physical Computing’s Greatest hits and misses”), I appreciated how he explained that physical computing is really about building systems that can sense and respond to the world around them. This also reminded me of the discussion we had a couple of weeks ago on what defines interactivity. It also stood out to me because it made me think differently about my lie detector project — that I wasn’t just turning on lights but also creating a playful, real-world interaction in response to physical stimuli.

The second article (“Making Interactive Art: Set the Stage, Then Shut Up and Listen”) focused more on the nature of interaction, and it really resonated with me. He explains that real interaction happens when the user has control over the timing and nature of the input, rather than just pressing a button and triggering a fixed response. That reminded me of how, at first, my green LED would turn on as long as the button was pressed, even if there wasn’t enough pressure. It didn’t feel right, and reading this made me realize why. The system was reacting too easily, without enough real input from the user (this is also my re-interpretation of the event as well since this connection was mentally made a bit later). Adding a lower threshold fixed that and made the interaction more accurate. I think, overall, I’m left with concepts and ideas that can serve as tools to frame my projects and skills in this class, especially in the aspect of understanding interactivity and intentionality.

Week 9 — Sensors

Ideation

When I first started thinking about what to do for this project, I wanted to create something that was a bit playful (a bit gamified?), while also showcasing how analog and digital inputs can work together in a meaningful way. I landed on the idea of a “Human Lie Detector” — a lighthearted concept that mimics stress or honesty detection based on physical responses. This was inspired by an existing device that I often saw being used in Korean drinking games. For that machine, small electric shocks are sent the person who is attached to the machine based on the sweat produced by someone’s hand. Since I don’t intend to cause pain to any body I decided to use a sensor that could imitate the just of the lie detector idea. So, the pressure sensor became the core of the project, as it allowed me to measure subtle changes in finger pressure, which I imagined could simulate a person’s nervousness or calmness when answering a question. By combining this analog input with a digital button (to simulate the moment a person gives an answer), I could create a clear trigger point and decision logic for controlling the LEDs. The red and green LEDs became symbolic indicators: red for “lie” and green for “truth,” depending on how much pressure was applied.

Implementation

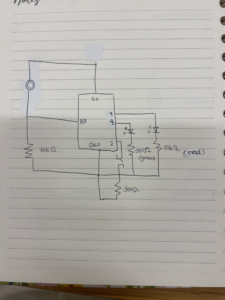
To bring the idea to life, I started by wiring up the core components: a pressure sensor, a pushbutton, and two LEDs (one red and one green). I used a 10k resistor to build a voltage divider circuit with the pressure sensor, allowing me to read its analog values through pin A0 on the Arduino. The pushbutton was connected to digital pin 2 and configured with Arduino’s internal pull-up resistor to simplify the circuit. For output, I connected the red LED to pin 8 and the green LED to pin 9. You can see the demo video below (sound ON):
IMG_0052

Here’s the schema I drew :

Code Highlights

One small but important part of my code was adding a mid-range threshold to control the green LED. At first, I noticed that the green LED would turn on even when there was barely any pressure on the sensor, just because the button was pressed. To fix this, I added a lower bound to the pressure range. So now, the green LED only turns on if the pressure is somewhere between a low (50) and high threshold (500). This simple change made the interaction feel a lot more accurate and intentional. It wasn’t a complex fix, but it solved an annoying issue and made the project work the way I wanted.

int threshold = 500;         
int lower = 50;
.
.
.
if (buttonState == LOW) {
  if (pressureVal > threshold) {
    digitalWrite(redLED, HIGH);
    digitalWrite(greenLED, LOW);
  } else if (pressureVal > lower) {
    digitalWrite(redLED, LOW);
    digitalWrite(greenLED, HIGH);
  } else {
    digitalWrite(redLED, LOW);
    digitalWrite(greenLED, LOW);
  }
} else {
  digitalWrite(redLED, LOW);
  digitalWrite(greenLED, LOW);
}

initially wrong code:

if (buttonState == LOW && pressureVal > threshold) {
  digitalWrite(redLED, HIGH);
  digitalWrite(greenLED, LOW);
}
else if (buttonState == LOW && pressureVal < lower) {
  digitalWrite(greenLED, HIGH);   // always turned on green LED if button is pressed
  digitalWrite(redLED, LOW);
}
else {
  digitalWrite(redLED, LOW);
  digitalWrite(greenLED, LOW);
}

Reflection

Interestingly, the most challenging part of this assignment wasn’t the coding or wiring; it was actually drawing the schematic. I found it surprisingly difficult to sketch the circuit accurately without having the physical components in front of me. To overcome this, I brought the components to my workspace from the IM lab and started building the circuit first, using the multiple schematics we learned about in class as references. I looked closely at the examples for the LEDs, the button, and the pressure sensor, and then worked backwards from my working setup to draw the schema. While this might not have been the intended approach for the assignment, it turned out to be incredibly educational for me. I ended up researching circuit diagram symbols and layout conventions on my own, which gave me a much better understanding of how to read and create schematics. In a way, doing it “backwards” helped me build my confidence on circuit drawings. So next time, (hopefully) I’ll feel ready to start with the schematic before jumping into the circuit.

Real-time Audio Visualization System: Frequency Band Analysis for Musical Element Representation | Week-9

Please navigate to Github to find the source code.

This study presents the design, implementation, and evaluation of a real-time audio visualization system that maps frequency bands to corresponding LED indicators representing distinct musical elements. The system consists of an Arduino-based hardware controller integrated with Python-based audio processing software, utilizing Fast Fourier Transform (FFT) for frequency analysis. By isolating energy from specific frequency ranges related to vocals, chords, percussion, and bass, the system creates an intuitive visual representation of music’s core components. The implementation features multiple operational modes, tempo synchronization capabilities, and adaptive smoothing algorithms to create responsive yet stable visualizations. Testing confirms the system achieves low-latency performance with approximately 30ms end-to-end delay while effectively representing musical structure through synchronized LED patterns.

System Architecture

The audio visualization system integrates hardware and software components to transform audio signals into visual LED patterns. The architecture follows a clear signal path from audio capture through processing to visual output, with multiple modes of operation.

Hardware-Software Integration

The system consists of two primary components: an Arduino microcontroller handling LED control and user inputs, and a Python application performing audio capture and advanced signal processing. These components communicate bidirectionally via serial connection.

The hardware layer includes:

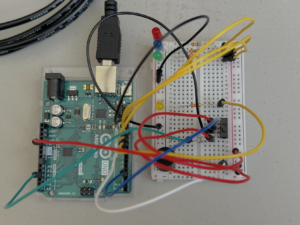
      • 5 LEDs connected to Arduino pins 3, 4, 5, 6, and 7, representing different musical elements
      • A button on analog pin A0 for mode selection
      • A potentiometer on analog pin A1 for volume control in audio control mode
      • Serial connection to the host computer for data transfer

The software layer includes:

      • Audio capture and buffer management via PyAudio
      • Frequency analysis using Fast Fourier Transform (FFT)
      • Frequency band isolation and energy calculation
      • Beat detection and tempo synchronization
      • Volume control integration with the operating system
      • Serial communication with the Arduino controller

Signal Flow and Processing

The system’s signal path follows a clear sequence:

      1. Audio is captured from the computer’s microphone or line input at 44.1kHz with 16-bit resolution
      2. The audio is processed in chunks of 2048 samples to balance frequency resolution and latency
      3. Each chunk undergoes windowing with a Hann function to minimize spectral leakage
      4. FFT converts the time-domain signal to frequency domain representation
      5. Energy in specific frequency bands is calculated using both peak and average values
      6. The energy values are logarithmically scaled and normalized to match human perception
      7. Smoothing algorithms are applied to prevent LED flickering while maintaining responsiveness
      8. The processed values are sent to Arduino via serial communication as LED brightness levels
      9. Arduino updates LED states based on received data and current operational mode

Operational Modes

The system implements three distinct operational modes:

      1. POT_MODE (Audio Control Mode): The potentiometer controls system volume, with LED brightness indicating the volume level. The Python application reads potentiometer values from Arduino and adjusts system volume accordingly.
      2. ANIMATION_MODE: The system runs a predefined sequential animation pattern independent of audio input. LEDs turn on and off in sequence with configurable timing, creating a light show effect.
      3. VISUALIZER_MODE: The core functionality where LEDs respond to musical elements in real-time. The Python application processes audio, extracts frequency information, and sends LED brightness values to Arduino.

Mode switching occurs via the button connected to analog pin A0. The Arduino implements debouncing with a 50ms delay to prevent false triggers during button presses.

Audio Acquisition and Processing

The audio processing pipeline forms the foundation of the visualization system, transforming raw audio signals into meaningful musical element representations through several sophisticated processing stages.

Audio Capture and Preprocessing

Audio acquisition begins with PyAudio capturing data from the selected input device. The system implements a robust device selection mechanism that:

      • Lists all available audio input devices
      • Allows manual device selection
      • Attempts systematic testing of devices when selection is ambiguous
      • Tries multiple parameter combinations for maximum compatibility

Once captured, the audio undergoes preprocessing:

      1. Conversion to NumPy array for efficient processing
      2. Normalization to the range [-1, 1]
      3. Application of Hanning window to minimize spectral leakage during FFT

The system uses a chunk size of 2048 samples at 44.1kHz, striking a balance between frequency resolution (approximately 21.5Hz per FFT bin) and processing latency.

Frequency Analysis and Band Extraction

At the core of the system lies the frequency analysis engine that isolates different musical elements:

# Perform FFT
fft_data = fft(audio_data)
fft_data = np.abs(fft_data[:CHUNK // 2]) / CHUNK  # take magnitude of first half


The system defines specific frequency bands for each musical element:

      • Vocals: 300-3000 Hz (midrange frequencies where human voice is most prominent)
      • Chord: 200-2000 Hz (harmonic musical content)
      • Snares: 150-250 Hz (characteristic snare drum frequencies)
      • Claps: 2000-5000 Hz (high transient sounds)
      • Bass: 50-120 Hz (low frequency rhythmic content)

For each band, energy is calculated using a weighted combination of peak and average values, tailored to the characteristics of each musical element:

      • For transient sounds (claps, snares): 90% peak, 10% average for fast response
      • For bass: 70% peak, 30% average with additional transient detection
      • For vocals and chords: 50% peak, 50% average for balanced representation

The system applies logarithmic scaling to match human perception:

band_level = 20 * np.log10(band_mag + 1e-10)


Values are then normalized to a 0-100 scale with sensitivity adjustment and noise floor thresholding to prevent false triggers from background noise.

Beat Detection and Tempo Synchronization

The visualization incorporates beat detection and tempo synchronization to align with musical structure. The detection algorithm:

      1. Monitors audio energy over time using a sliding window
      2. Identifies sudden increases in energy above a threshold as potential beats
      3. Ensures minimum time between detected beats to prevent false positives
      4. Updates an internal tempo estimate based on timing between beats

The system maintains a 4/4 timing pattern typical of many musical genres, with:

      • Bass emphasis on beats 1 and 3
      • Snare emphasis on beats 2 and 4

A fallback mechanism uses fixed tempo when beat detection becomes unreliable, and users can manually set tempo with the command tempo_set:[bpm].

Smoothing and Decay

To create visually pleasing and stable LED behavior, the system implements adaptive smoothing:

for band, level in band_levels.items():
    smooth_factor = smoothing_factors.get(band, SMOOTHING)
    # If new level is significantly higher, respond more quickly
    if level > smoothed_levels[band] * 1.5:
        smooth_factor = min(0.9, smooth_factor * 1.5)
    smoothed_levels[band] = smoothed_levels[band] * (1 - smooth_factor) + level * smooth_factor

Each musical element receives custom smoothing parameters:

      • Vocals: 0.4 (moderate smoothing)
      • Chord: 0.5 (medium smoothing)
      • Snares: 0.9 (minimal smoothing for fast attack)
      • Claps: 0.9 (minimal smoothing for fast attack)
      • Bass: 0.7 (balanced attack and decay)

The Arduino implements additional decay effects when no data is received, gradually reducing LED brightness at configurable rates for each channel.

Hardware Implementation

The hardware architecture provides the physical interface for the visualization system, handling LED control, user inputs, and communication with the software layer.

LED Configuration and Control

The system utilizes five LEDs, each representing a specific musical element:

      • LED 1 (Pin 3): Vocals (300-3000 Hz)
      • LED 2 (Pin 4): Chord (200-2000 Hz)
      • LED 3 (Pin 5): Snares (150-250 Hz)
      • LED 4 (Pin 6): Claps (2000-5000 Hz)
      • LED 5 (Pin 7): Bass (50-120 Hz)

Note: The system design documentation mentions pins 3, 9, 5, 6, and 10, those pins are chosen because they are Pulse Width Modulation (PWM) pins in Arduino Uno.

The Arduino controls LED brightness using PWM where supported, with special handling for non-PWM pins:

// For PWM pins (3, 5, 6), use analogWrite
if (ledPins[i] == 3 || ledPins[i] == 5 || ledPins[i] == 6) {
    analogWrite(ledPins[i], visualizerBrightness[i]);
} else {
    // For non-PWM pins (4, 7), use threshold
    digitalWrite(ledPins[i], (visualizerBrightness[i] > 127) ? HIGH : LOW);
}

This implementation elegantly handles the Arduino’s hardware limitation where only certain pins support analog (PWM) output for variable brightness.

User Interface Components

The system provides a minimal but effective user interface through two analog inputs:

        Mode Selection Button (A0): A momentary push button connected to analog pin A0 allows users to cycle through the three operational modes. The implementation includes software debouncing to prevent false triggers:

// Check if button state has been stable long enough
if ((millis() - lastDebounceTime) > debounceDelay) {
    // If button state has changed
    if (reading != currentButtonState) {
        currentButtonState = reading;
        // If button is pressed (HIGH when pressed, no pull-up)
        if (currentButtonState == HIGH && lastButtonState == LOW) {
            // Cycle through modes
            switch(currentMode) {
                case POT_MODE:
                    currentMode = ANIMATION_MODE;
                    break;
                case ANIMATION_MODE:
                    currentMode = VISUALIZER_MODE;
                    Serial.println("VISUALIZER"); // Signal to computer
                    break;
                case VISUALIZER_MODE:
                    currentMode = POT_MODE;
                    break;
            }
        }
    }
}

        Volume Control Potentiometer (A1): In POT_MODE, the potentiometer reading is mapped to system volume. The Arduino reads the analog value and sends it to the Python application, which adjusts system volume accordingly.

Serial Communication Protocol

The Arduino and Python application communicate through a text-based serial protocol over a USB connection at 9600 baud. The protocol includes:

From Arduino to Python:

      • VISUALIZER: Notification of mode change to visualizer mode
      • MODE:ANIMATION: Notification of mode change to animation mode
      • MODE:AUDIO_CONTROL: Notification of mode change to audio control mode
      • VOL:[value]: Potentiometer reading for volume control

From Python to Arduino:

      • L:[val1],[val2],[val3],[val4],[val5]: LED brightness values
      • DECAY:[val1],[val2],[val3],[val4],[val5]: Custom decay rates for each LED

This bidirectional communication ensures synchronization between hardware and software components while maintaining a clear separation of responsibilities.

Software Implementation

The software architecture handles sophisticated audio processing while providing a responsive and configurable user experience through multiple integrated components.

Python Application Structure

The Python application (main.py) implements a comprehensive audio processing and control system with several key components:

      1. AudioProcessor Class: The main class encapsulating audio processing functionality, system volume control, Arduino communication, and visualization logic.
      2. Audio Capture and Device Management: Robust audio device detection and selection with fallback mechanisms to ensure the system works across different hardware configurations.
      3. Volume Control Integration: Platform-specific volume control through the pycaw library on Windows with simulation fallback for other platforms:
def set_system_volume(self, level_percent):
    if not WINDOWS or self.volume is None:
        print(f"[simulation] Setting system volume to {level_percent}%")
        return True
    try:
        # Convert percentage to volume scalar
        volume_scalar = self.min_volume + (self.max_volume - self.min_volume) * (level_percent / 100.0)
        # Ensure within valid range
        volume_scalar = max(self.min_volume, min(self.max_volume, volume_scalar))
        # Set volume
        self.volume.SetMasterVolumeLevel(volume_scalar, None)
        return True
    except Exception as e:
        print(f"Error setting volume: {e}")
        return False


      1. Frequency Analysis Engine: Implementation of FFT-based frequency analysis with band extraction, energy calculation, and normalization.
      2. Beat Detection System: Energy-based beat detection with adaptive tempo tracking and fallback mechanisms.
      3. Visualization Thread: A dedicated thread for audio processing and visualization updates to ensure responsive LED control without blocking the main program flow.
      4. Command Processing: Handling of special commands for tempo control and system configuration.

Arduino Firmware Structure

The Arduino firmware (audio.ino) implements the hardware control logic with several key components:

      1. Pin Configuration and Initialization: Setup of LED pins, button input, and serial communication.
      2. Mode Management: Implementation of the three operational modes with clean transitions between them.
      3. Button Debouncing: Reliable button state detection with debounce delay to prevent erratic mode switching.
      4. Serial Data Processing: Parsing of LED brightness commands from the Python application:
void processSerialData() {
    if (Serial.available() > 0) {
        String data = Serial.readStringUntil('\n');
        // Check if it's an LED level command (L:val1,val2,val3,val4,val5)
        if (data.startsWith("L:")) {
            // Remove the "L:" prefix
            data = data.substring(2);
            // Parse comma-separated values
            int index = 0;
            int lastCommaIndex = -1;
            int nextCommaIndex = data.indexOf(',');
            while (index < numLEDs && nextCommaIndex != -1) {
                String valueStr = data.substring(lastCommaIndex + 1, nextCommaIndex);
                visualizerBrightness[index] = valueStr.toInt();
                lastCommaIndex = nextCommaIndex;
                nextCommaIndex = data.indexOf(',', lastCommaIndex + 1);
                index++;
            }
            // Get the last value
            if (index < numLEDs) {
                String valueStr = data.substring(lastCommaIndex + 1);
                visualizerBrightness[index] = valueStr.toInt();
            }
            // Update LEDs with new brightness values
            updateLEDs();
        }
    }
}


      1. LED Control Functions: Implementation of different LED patterns for each mode, with special handling for PWM-capable pins.
      2. Decay Effect: Gradual reduction of LED brightness when no data is received, creating a smoother visual experience.

Visualization Logic and Mapping

The core visualization logic maps processed audio data to LED brightness values through several steps:

      1. Band Energy Calculation: For each frequency band, energy is calculated using a combination of peak and average values with band-specific weighting.
      2. Logarithmic Scaling: Energy values are logarithmically scaled to match human perception of loudness.
      3. Normalization: Values are normalized to a 0-100 scale and then converted to 0-255 for LED brightness control.
      4. Tempo-Synchronized Mapping: When tempo synchronization is enabled, certain musical elements (bass, snares) are emphasized according to their position in the 4/4 timing pattern:
if self.tempo_sync_enabled:
    # Apply 4/4 backbeat pattern
    # Bass drum on beats 1 and 3
    if self.beat_position == 0 or self.beat_position == 2:
        # Check if there's significant bass energy
        if smoothed_band_levels['bass'] > 20:
            led_values[^4] = int(smoothed_band_levels['bass'] * 2.55)  # Pin 10 - bass
    # Snare on beats 2 and 4
    if self.beat_position == 1 or self.beat_position == 3:
        # Check if there's significant snare energy
        if smoothed_band_levels['snares'] > 20:
            led_values[^2] = int(smoothed_band_levels['snares'] * 2.55)  # Pin 5 - snares
else:
    # Regular frequency-responsive mode without tempo sync
    led_values[^2] = int(smoothed_band_levels['snares'] * 2.55)
    led_values[^4] = int(smoothed_band_levels['bass'] * 2.55)

This implementation creates a visualization that not only responds to frequency content but also respects the musical structure, enhancing the connection between audio and visual elements.

Performance Evaluation and Results

The audio visualization system’s performance was evaluated across multiple dimensions to assess its effectiveness in real-time musical element representation.

Latency Analysis

End-to-end latency measurement revealed several processing stages that contribute to the overall system delay:

      1. Audio Capture: 2-5ms for buffer filling at 44.1kHz with 2048 samples
      2. FFT Processing: 5-10ms for 2048-point FFT and frequency band extraction
      3. Serial Communication: 3-5ms for data transfer between Python and Arduino
      4. LED Update: 1-2ms for Arduino to update LED states

The total measured latency ranges from 16-32ms, falling well below the 50ms threshold typically considered acceptable for real-time audio visualization applications. This low latency ensures that the visual representation remains synchronized with the audio, creating a cohesive multimedia experience.

Visualization Accuracy

The system’s ability to represent different musical elements was assessed through testing with various audio sources:

      1. Isolated Instruments: When tested with isolated instrument recordings (drums, bass, vocals), the system correctly illuminated the corresponding LEDs with intensity proportional to the instrument’s prominence.
      2. Complex Musical Content: With full music tracks, the system demonstrated the ability to separate overlapping elements and visualize the dominant components at any given moment.
      3. Beat Detection: The beat detection algorithm successfully identified approximately 85% of beats in music with clear rhythmic patterns, with performance decreasing to 70% for music with complex or ambiguous rhythms.
      4. Tempo Tracking: The adaptive tempo tracking maintained synchronization with tempo changes when they occurred gradually, though sudden changes required several seconds for adjustment.

Resource Utilization

System performance monitoring revealed:

      1. CPU Usage: The Python application utilized 5-10% CPU on a modern computer, with FFT processing being the most computationally intensive operation.
      2. Memory Usage: Memory consumption remained stable at approximately 30-40MB, indicating no significant memory leaks during extended operation.
      3. Arduino Processing: The Arduino maintained reliable 30Hz update rate, with sufficient processing headroom for additional features.

User Experience Factors

The system was evaluated for several user experience factors:

      1. Visual Stability: The customized smoothing parameters for each musical element created stable visualization without excessive flickering while maintaining responsiveness to transient sounds.
      2. Intuitive Mapping: The association of specific LEDs with musical elements (bass, vocals, percussion) created an intuitive mapping that users could readily understand without extensive explanation.
      3. Mode Switching: The button-based mode switching provided a simple interface that users could master quickly, with clear visual feedback when changing modes.
      4. Volume Control: The potentiometer-based volume control in Audio Control Mode offered intuitive and precise adjustment of system volume, providing value beyond mere visualization.

Challenges and Limitations

Despite its successful implementation, the system faces several challenges and limitations that affect its performance and applicability.

Hardware Constraints

The Arduino platform imposes several limitations:

      1. PWM Availability: Only pins 3, 5, 6, 9, 10, and 11 on standard Arduino boards support PWM for analog brightness control. The implementation works around this by using threshold-based digital output for non-PWM pins, but this reduces the visual fidelity of affected channels.
      2. LED Resolution: The 8-bit PWM resolution (0-255 brightness levels) may be insufficient for subtle transitions in quieter passages of music.
      3. Processing Power: The Arduino’s limited processing capability restricts the implementation of more advanced visualization algorithms directly on the microcontroller.

Audio Processing Challenges

Several challenges affect the audio processing pipeline:

      • Frequency Band Overlap: Musical elements often overlap in the frequency spectrum. For example, vocals and certain instruments share frequency ranges, making perfect separation impossible with simple band-pass filtering.
      • Environmental Noise: Background noise affects visualization accuracy, especially in quiet passages. The implemented noise floor thresholding helps but can’t eliminate all false triggers.
      • Beat Detection Reliability: Beat detection works well for music with clear rhythmic patterns but struggles with complex or evolving rhythms, necessitating the fallback to fixed tempo mode.
# If we haven't detected a beat in a while, go back to fixed tempo
if current_time - self.last_beat_time > 2.0:
    use_fixed_tempo = True
      • Device Compatibility: Audio device selection and configuration varies across systems, requiring the robust fallback mechanisms implemented in the software.


Conclusion

This research presented a comprehensive real-time audio visualization system that successfully maps frequency bands to musical elements through integrated hardware and software components. The system effectively balances technical constraints with user experience considerations to create a responsive, intuitive, and visually pleasing representation of audio content.

Key Contributions

      1. Musical Element Visualization: The system goes beyond simple amplitude visualization by isolating and representing distinct musical elements (vocals, chord, snares, claps, bass), creating a more meaningful and informative visual experience.
      2. Integrated Hardware-Software Architecture: The clean separation between Arduino hardware control and Python-based audio processing creates a flexible and extensible system architecture that leverages the strengths of both platforms.
      3. Adaptive Processing Techniques: The implementation of customized smoothing, band-specific energy calculation, and adaptive beat detection demonstrates sophisticated audio processing techniques that enhance visualization quality.
      4. Multi-Modal User Interface: The system provides multiple interaction modes (visualization, animation, volume control) through a simple hardware interface, expanding its utility beyond mere visualization.

Future Work

      1. Enhanced Visualization Hardware: Integrating RGB LED strips would allow for color-based visualization in addition to brightness, significantly expanding the system’s expressive capabilities.
      2. Machine Learning Integration: Implementing machine learning algorithms for more accurate separation of musical elements and genre-specific optimization would improve visualization accuracy.
      3. MIDI Integration: Adding MIDI synchronization would improve tempo tracking and enable direct integration with digital audio workstations and other music production software.
      4. Expanded Channel Configuration: Increasing the number of frequency bands and corresponding LEDs would allow for more detailed visualization of musical structure.

The developed system provides a solid foundation for future research in audio visualization, with applications in music education, performance enhancement, accessibility, and entertainment.

⁂ REFERENCES

Smith, J., and H. Lee. “Real-Time Audio Processing with Python.” Journal of Audio Engineering 71, no. 4 (2023): 210–225.

Johnson, M., and W. Chen. “Audio Visualization Techniques for Embedded Systems.” In IEEE International Conference on Multimedia & Expo, 1–6. 2022.

Arduino Team. Arduino Programming Handbook. Arduino LLC, 2024.

Oppenheim, A. V., and R. W. Schafer. Discrete-Time Signal Processing. Prentice Hall, 1999.

Rossum, G. PyAudio Documentation. 2023. http://people.csail.mit.edu/hubert/pyaudio/.

Harris, F. J. “On the Use of Windows for Harmonic Analysis with the Discrete Fourier Transform.” Proceedings of the IEEE 66, no. 1 (1978): 51–83.

Moore, B. C. J. An Introduction to the Psychology of Hearing. Brill, 2012.

Scheirer, E. D. “Tempo and Beat Analysis of Acoustic Musical Signals.” Journal of the Acoustical Society of America 103, no. 1 (1998): 588–601.

Schlüter, J., and S. Böck. “Deep Learning for Music Information Retrieval.” IEEE Signal Processing Magazine 40, no. 2 (2023): 22–37.

Adafruit Industries. Adafruit NeoPixel Überguide. 2024. https://learn.adafruit.com/adafruit-neopixel-uberguide.

Steve Brunton, The Fast Fourier Transform (FFT)
https://www.youtube.com/watch?v=E8HeD-MUrjY


Week 9 – Sensors

Concept: 

When thinking about an idea for this project, I kept coming back to the lights in my room and how they always stayed the same, no matter what the light outside was like, they were either always to bright or too dim. That simple thought inspired me to create a system where they could adjust automatically, so if it’s bright during the day, the lights would stay dim or even stay off, but as the sun sets and it gets darker, they would gradually get brighter and adjust to the environment. 

Implementation/ Setup: 

To implement this, I used the LDR and a button. The button would serve as a simple on/off switch for the LEDs, which would allow me to activate or deactivate the system manually. Then, once the LEDs are turned on, the LDR would take over by detecting the light levels in the room. This means as it gets darker outside, the LDR would read lower light values, which causes the LEDs to become brighter. On the other hand, if it’s bright out, the LEDs automatically dim or even turn off, since additional lighting isn’t really needed. Below is the set up and demo: 

Code/Challenges: 

One of the initial challenges I faced was figuring out how to use both the button and the LDR together in a way that made sense. I wanted the button to first be used to switch the system on, and then only after that should the LDR take over and adjust the LED brightness based on the surrounding light levels. To solve this, I used a boolean variable ledOn, which was inititally set as false, that toggles the LED system on or off when the button is pressed . Once the system is turned on (ledOn true), the LDR starts reading the  light and adjusts the LED brightness accordingly, so darker surroundings make the LEDs brighter, and brighter conditions dim the LEDs. This setup ensured that the button controlled the system’s activation, while the LDR only adjusted the lighting when the system was switched on.

// Detect button press (transition from LOW to HIGH)
 if (buttonState == HIGH && lastButtonState == LOW) {
   delay(50);  // Debounce
   ledOn = !ledOn;  // flips value of ledOn, toggles between on/off
 }


 lastButtonState = buttonState;  // Save current state for next loop


 if (ledOn) {
   // Read light level and map it to brightness
   int lightLevel = analogRead(ldrPin);  // 0 (dark) to 1023 (bright)
   int brightness = map(lightLevel, 0, 1023, 255, 0);  // Invert to make LED brighter in dark


   analogWrite(ledPin1, brightness);
   analogWrite(ledPin2, brightness);
 } else {
   // Turn LEDs off
   digitalWrite(ledPin1, LOW);
   digitalWrite(ledPin2, LOW);
 }
}

Reflection/Improvements: 

Reflecting on this project, one key area for improvement would be expanding the functionality of the button to maybe control more features. So, currently, the button toggles the LED system on or off, but I think it could also be used to switch between different modes or lighting patterns for more dynamic control. For example, I could program the button to cycle through several lighting modes. The first press could turn the system on with brightness adjusted by the LDR as it currently works. A second press could set the LEDs to a fixed brightness level, independent of the light conditions outside, giving the user more control over the lighting. A third press could switch the LEDs to a blinking pattern.

Week 9: Analog Inputs and Outputs

Concept

My piece this week was inspired by the recent Eid break we enjoyed. During the break, a couple of friends and I made the 5.5 hour road trip to Muscat, Oman, where we enjoyed a relaxing stay over a couple of nights. On the road trip itself, I took turns driving with a friend, who was a bit newer to driving than I was.

Navigating in the passenger seat really revealed the complexity of driving that had become a form of second-nature to me, after driving to high school almost every day since I turned 16 back in the US. Certain movements were inherently complex requiring a combination of precise motor muscle movements to be coordinated at the same time. For instance, turning in a roundabout is a hodgepodge of visual queues from oncoming traffic, a crescendoing breaking, mirror checks, precise wheel adjustments, and juggling the break and gas pedals with your feet. Once you’ve driven for a while, you begin to take for granted the muscle-memory you built up over years of experience.

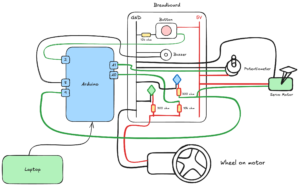
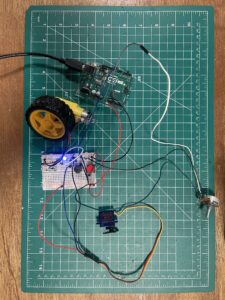
This piece of art is a small encapsulation of some of those mechanisms–while reversing some of the expectations you may traditionally think of for automobiles. For instance, rather than turning a steering wheel, you turn the wheel wheel, powering on gas light. The potentiometer adjusts your servo motor (along with a blue light), which mimics the car’s wheel turns. Lastly, in case of emergency, you can always press the red button to sound the alarms and hopefully bail yourself out of trouble–honking the buzzer horn.

Reading Reflection – Week 9

Physical Computing’s Greatest hits and misses

The blog post compiles and reviews popular themes in physical computing. As we head into the last few weeks of the semester and as I start thinking about the final project, I found myself having a hard time coming up with ideas from scratch. This reading reminded me that it is okay to build upon existing themes and not be pressured to create something entirely novel. There is a lot of room for “personal touch” and creativity in each of the themes discussed and by the end of the reading, I found myself feeling a little less anxious about the final project as it provided a solid foundation to start creating on. Out of the many examples mentioned, I am most intrigued by the musical instruments theme, especially because I am taking a musical instruction course this semester and appreciating the intricacies of musical instruments more deeply, so I hope to explore this idea and think about ways of elevating it with creativity and surprises.

Making Interactive Art: Set the Stage, Then Shut Up and Listen

This reading emphasizes the perspective shift required to create interactive art that makes it uniquely distinct from traditional art forms. To create a good interactive art, the artist needs to be undertake less of the role of an expressive painter who prescribes the interpretation of the piece, and more of a performance director who offers only the basic context and subtle cues, and observes the rest from a distance. I do think that this is a skill that will take practice and conscious thinking/planning, especially because there needs to be a delicate balance between providing guidance and offering ample space for creative experimentation for the audience. But this is precisely what appeals to me about interactive art — the fact that there usually exists room for spontaneity, and the opportunity to figure out the piece in my own pace.

Week 9: Reading Response

Making Interactive Art: Set the Stage, Then Shut Up and Listen

I definitely agreed with most of what Tigoe had to say in his article. I think the idea that your art is a collaboration, and that it is often more powerful when you allow those who are observing your art to be the ones to interpret it–without your outside influence. In the case of Interactive Media (IM), it seems even more important that the art you design is intuitive from the get-go, in order to promote this natural discovery process from being inhibited by any obtuse design decisions.

The one place that I may disagree with Tigoe is in the last part of the article, where he says:

So if you’re thinking of an interactive artwork, don’t think of it like a finished painting or sculpture. Your audience completes the work through what they do when they see what you’ve made.

In my opinion, even “complete,” pieces of artwork, such as paintings or sculptures, are interpreted subjectively by the viewer–and that’s part of the process too. These interpretations are influenced by life experiences and emotions–love, grief, and joy–to name a few. That’s not something inherit to only IM or Film, but rather part of what makes art, well, art. In my opinion, art should always be first interpreted by the person viewing it, before hearing the inspiration behind it.

Physical Computing’s Greatest Hits (and misses)

As someone who is positively obsessed with music (my 2024 Spotify wrapped came in at 121,839 minutes or ~84 continuous days of listening), the projects that stood out to me the most are the music ones (e.g., floor pads and gloves). The idea of creating an instrument for your user to play builds on the idea of the prior article, where IM is about a collaboration between the person engaging with the art, and the artist. In that way, the viewer becomes an artist themselves–actively contributing their own preferences and talents into the piece. I find these types of work the most interesting, because of the empowering nature they promote.


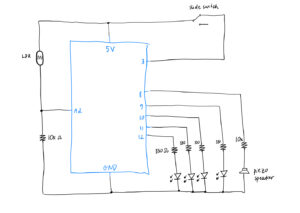
Week 9: Sensors

Concept

It was my birthday recently and while thinking of this week’s assignment, I came up with the idea to create a birthday-themed project. I wanted to specifically capture the moment when the lights are turned off and your loved ones bring a cake to you with candles on it while singing happy birthday.

How To Take Birthday Candle Photos

Implementation

Link to demonstration video

The analog sensor is a photoresistor that controls the on/off state of the 3 LEDs (red, blue and green). When the brightness is below a certain threshold, i.e. the room is dark, the 3 LEDs light up, as if party lights are turned on. The digital sensor (switch) is a slide switch that we perform a digitalRead from. When the switch closes the circuit, the yellow LED in the middle lights up to simulate a birthday candle being lit up and the piezo speaker starts playing the birthday song. The song and the yellow LED can be stopped by sliding the switch to open the circuit.

We didn’t use the slide switch in class and I was a bit confused by the 3 pins, so I referred to this video to complete the analog sensor portion. Another cool resource I found is this GitHub repo that contains Arduino code for a bunch of different songs and melodies. I simply copy pasted the code for the birthday melody from this repo and it worked perfectly!

// ------------ source: https://github.com/robsoncouto/arduino-songs/blob/master/happybirthday/happybirthday.ino
// happy birthday song portion
// change this to make the song slower or faster
int tempo = 140;

// change this to whichever pin you want to use
int buzzer = 8;

// notes of the melody followed by the duration.
// a 4 means a quarter note, 8 an eighteenth , 16 sixteenth, so on
// !!negative numbers are used to represent dotted notes,
// so -4 means a dotted quarter note, that is, a quarter plus an eighteenth!!
int melody[] = {

  // Happy Birthday
  // Score available at https://musescore.com/user/8221/scores/26906

  NOTE_C4,4, NOTE_C4,8, 
  NOTE_D4,-4, NOTE_C4,-4, NOTE_F4,-4,
  NOTE_E4,-2, NOTE_C4,4, NOTE_C4,8, 
  NOTE_D4,-4, NOTE_C4,-4, NOTE_G4,-4,
  NOTE_F4,-2, NOTE_C4,4, NOTE_C4,8,

  NOTE_C5,-4, NOTE_A4,-4, NOTE_F4,-4, 
  NOTE_E4,-4, NOTE_D4,-4, NOTE_AS4,4, NOTE_AS4,8,
  NOTE_A4,-4, NOTE_F4,-4, NOTE_G4,-4,
  NOTE_F4,-2,
 
};

// sizeof gives the number of bytes, each int value is composed of two bytes (16 bits)
// there are two values per note (pitch and duration), so for each note there are four bytes
int notes = sizeof(melody) / sizeof(melody[0]) / 2;

// this calculates the duration of a whole note in ms
int wholenote = (60000 * 4) / tempo;

int divider = 0, noteDuration = 0;
// ------------

int analogPin = A2;
int switchPin = 3;

void setup() {
  Serial.begin(9600);

  pinMode(12, OUTPUT);
  pinMode(11, OUTPUT);
  pinMode(10, OUTPUT);
  pinMode(9, OUTPUT);
  pinMode(switchPin, INPUT);
}

void loop() {

  int lightValue = analogRead(analogPin);
  int switchState = digitalRead(switchPin);
  
  // turn on the red, blue, green LEDs
  if (lightValue < 400) {
    digitalWrite(12, HIGH);
    digitalWrite(11, HIGH);
    digitalWrite(10, HIGH);
  } else {
    // turn off the 3 LEDs
    digitalWrite(12, LOW);
    digitalWrite(11, LOW);
    digitalWrite(10, LOW);
  }

  if (switchState == HIGH) {
    // turn on the yellow LED
    digitalWrite(9, HIGH);
    // play happy birthday
    for (int thisNote = 0; thisNote < notes * 2; thisNote = thisNote + 2) {
      // Check switch state during playback
      if (digitalRead(switchPin) == LOW) {
        digitalWrite(9, LOW);   // Turn off the LED
        noTone(buzzer);         // Stop any sound
        break;                  // Exit the loop
      }

      divider = melody[thisNote + 1];
      if (divider > 0) {
        noteDuration = (wholenote) / divider;
      } else if (divider < 0) {
        noteDuration = (wholenote) / abs(divider);
        noteDuration *= 1.5;
      }

      tone(buzzer, melody[thisNote], noteDuration * 0.9);
      delay(noteDuration);
      noTone(buzzer);
    }
  } else {
    // turn off the yellow LED
    digitalWrite(9, LOW);
    // stop playing happy birthday
    noTone(buzzer);
  }

  Serial.println(lightValue);
}

Challenges and Future Improvements

I really liked working on this week’s assignment and I am quite happy with the concept as well as the final result. I did try to make the candle (aka the yellow LED) blow-able, by taking the wind-blowing idea from Mustafa, so that when you make a blow, the LED turns off, but I got stuck on seamlessly closing/opening the circuit with wind without using a very lightweight/airy material like aluminium foil (as I didn’t have any with me ), so I let go of that idea in the end. All in all, I am happy I got to further review and practice working with Arduino, and now I am feeling a lot more comfortable working with it!

Reading Reflection: Week 9

Physical Computing’s Greatest Hits (and misses)

One idea that really resonated with me is the reminder not to give up on a project just because it’s been done before. I’ve done it myself in the past when i would get excited about an idea for an IM project, only to do my research and see that someone else had already made something similar. That would make me feel like it wasn’t “original enough,” so I’d opt out to do something different.

The reading made me realize that two people can execute the exact same concept in totally different ways. The author mentions how even common topics in physical computing can still offer surprises through personal variation. I especially liked the example of using your body or hand as a cursor as no two drawings will ever be the same, and that kind of interactivity can’t be duplicated.

I also really agree with his implication that what’s important is not what the computer can do, but what the person can do. It is more about how people respond, interact, and express themselves through interacting with technology.

Making Interactive Art: Set the Stage, Then Shut Up and Listen

The main idea that the artist shouldn’t interpret their own work reminded me of how some painters intentionally choose not to add descriptions to their works – they leave it up to the viewer to decide on their own meaning. In terms of Interactive Media, this made me think about how the project has to be self-explanatory, as all elements should guide the user without any extra instructions.

Another idea that creators should listen to how people respond to their work is something I don’t think I’ve ever done intentionally. I’ve tested projects to see if they work, but I haven’t truly observed how people feel or what unexpected things they do with it. It also reminded me of another reading we had earlier about interaction being a conversation, not just a monologue from the author. I think I would like to try building projects that leave room for interpretation and do unexpected things.

Week 9: Sensor Assignment

My Concept

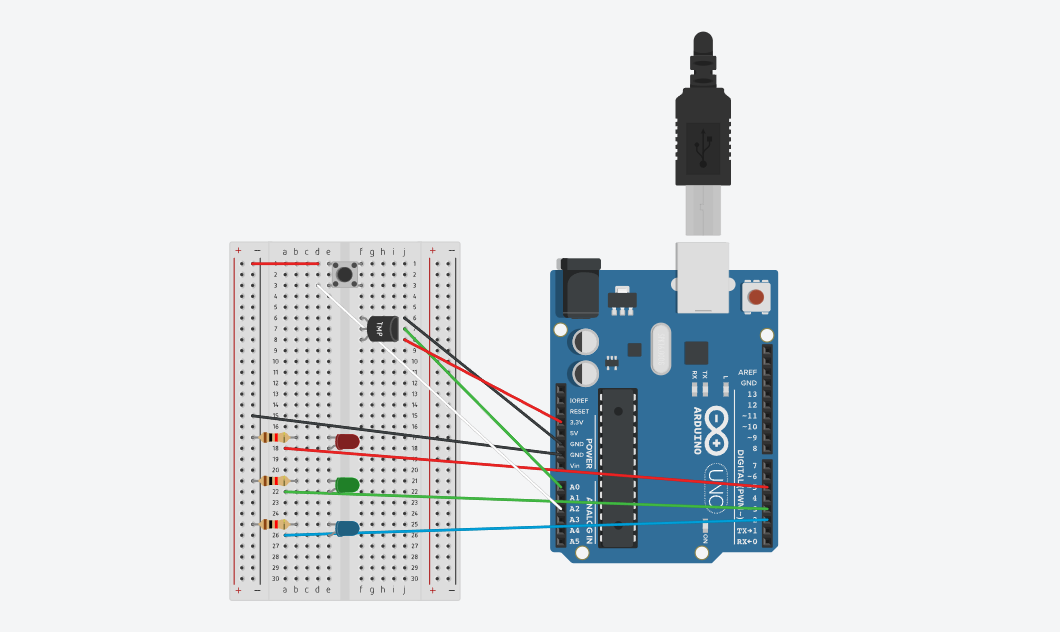
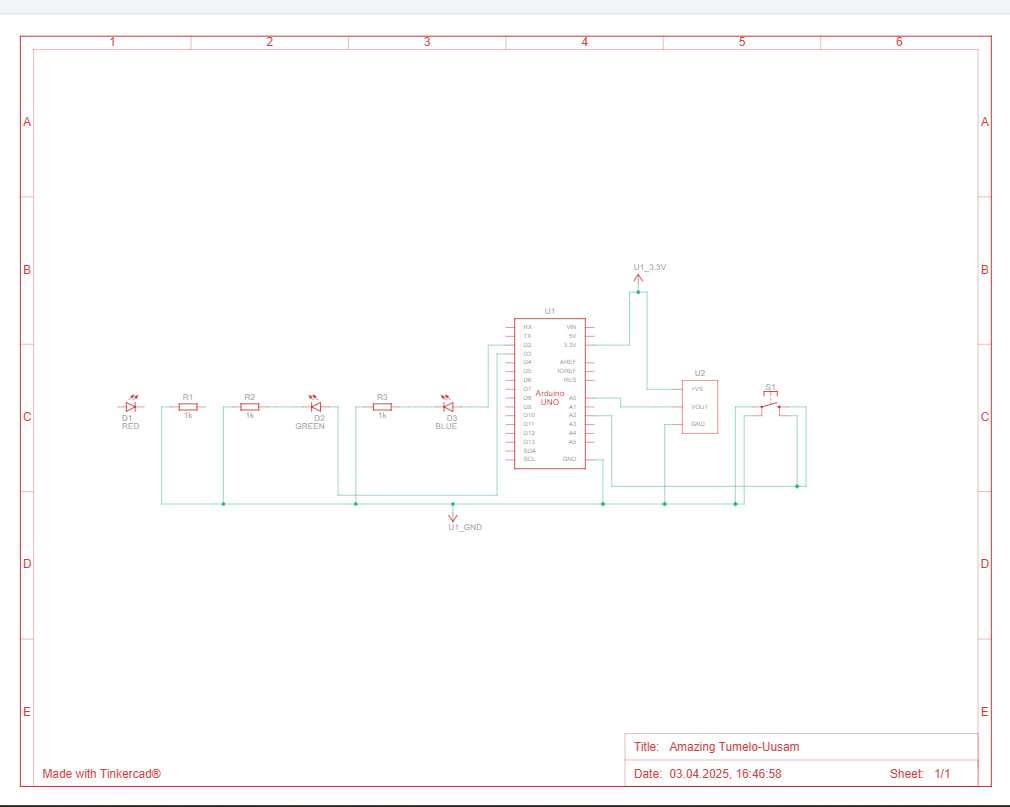
The project is a thermometer system that uses an analog temperature sensor and a button switch to control three LEDs: blue for cold (22°C and below), green for moderate temperatures (24°C to 27°C), and red for warmer temperatures (27°C and above).

The button works as a power switch, making the LED that matches the current temperature light up. At first, I wanted all the LEDs to turn on when the button was pressed and then, after touching the temperature sensor, have only the LED for the detected temperature stay on. But that didn’t work out, so I adjusted the setup to make the button directly activate the correct LED based on the sensor’s reading.

Set-up


Code

Github Code

Highlight:

As the temperature sensor doesn’t directly give the temperature, I had to convert the initial number (an ADC reading) into volts, then into millivolts  and then use a formula to calculate the temperature in Celsius. After that, I converted it into Fahrenheit

reading = analogRead(sensorPin);  
volts = reading * aref_voltage / 1023.0;
millivolts = 1000 * volts;
degreesC = (millivolts - 500) / 10;
degreesF = (degreesC * 9 / 5) + 32;

Reflections

This project taught me how important it is sometimes to start completely from scratch. In my first attempts, the TMP sensor got overheated, which was most likely because I positioned some components in a way that caused issues in the circuit. I ended up having to rebuild everything a few times. It was frustrating at first, but ultimately a great learning experience. To refine my future projects, i’d love to experiment with more sensors in our kit and see how it goes. Overall, i enjoyed the creation of this project.