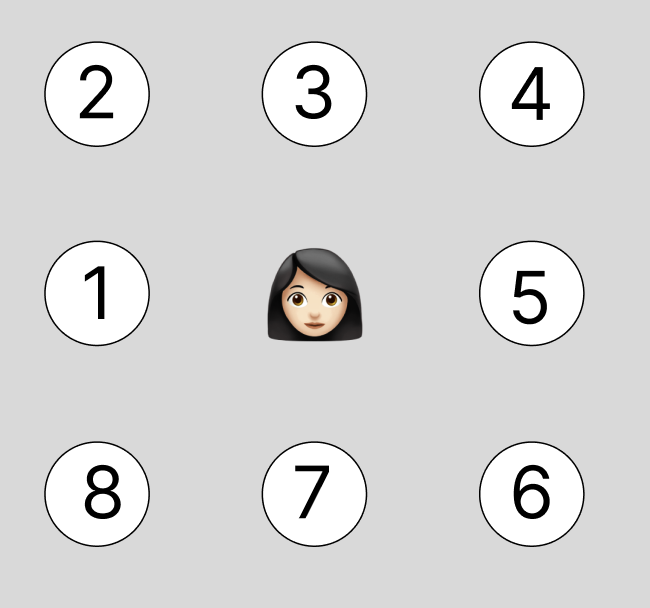
For my final project, I’m creating a physically interactive memory-sequence game centered around the metaphor of “recovering a fragmented memory.” The game uses four large LED pushbuttons wired to an Arduino, each with a built-in LED that flashes as part of a color sequence. The player must watch and memorize the flashing sequence and then repeat it correctly by pressing the matching buttons in order. With each successfully completed level, a blurry or pixelated image on the screen becomes clearer, symbolizing memory restoration. If the user gets the sequence wrong, the image distorts or glitches, as if the memory is slipping away. Only after completing all levels does the fully restored image appear.
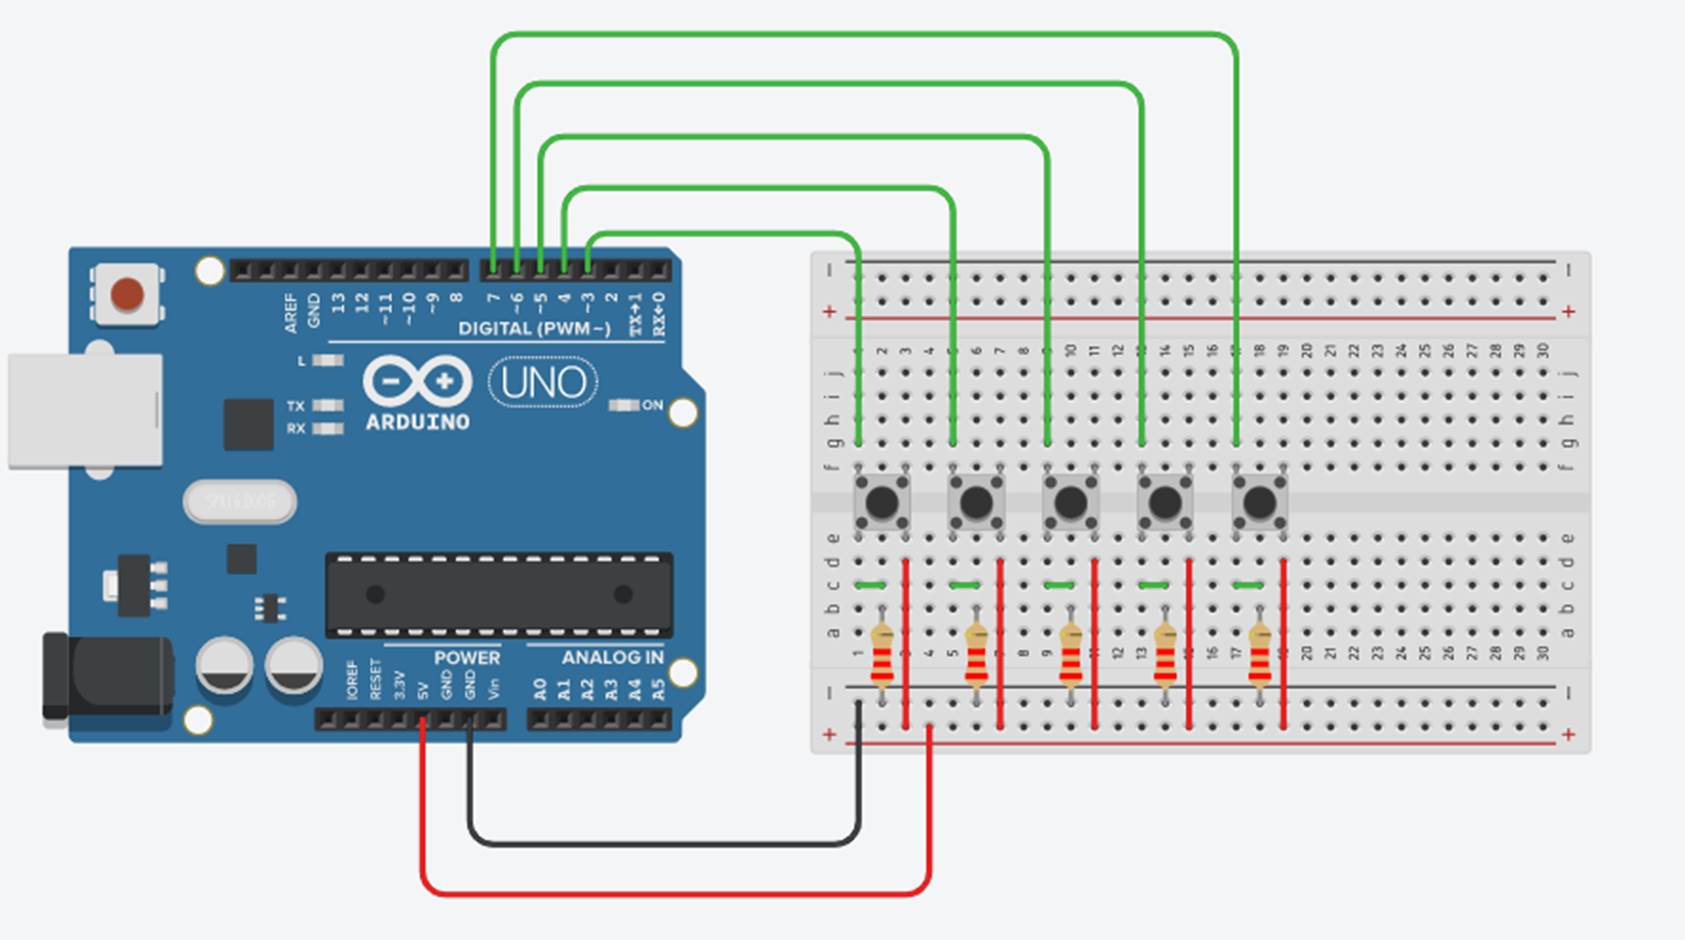
The Arduino handles all sensing and feedback related to physical input: it detects button presses using INPUT_PULLUP, flashes the LEDs during each round (based on input from P5), and sends messages to P5 whenever the player presses a button. Each button press is communicated over serial with a simple string like “BUTTON:0”, “BUTTON:1”, etc. P5 receives these signals, checks them against the correct sequence, and determines whether to progress the game, update the image clarity, or apply a glitch effect. On the flip side, P5 sends commands to Arduino to flash specific LEDs by sending numbers (0-3) over serial that correspond to the button LEDs.
On the P5 side, the sketch manages all game logic, sequence generation, visual feedback, and memory visualization. It starts with a low-resolution or blurred image and gradually resolves the image as the user completes levels. The sketch also gives instructions to the user and visual cues about success or failure. This layered system allows for a compelling interaction that blends precise physical input with expressive visual output.
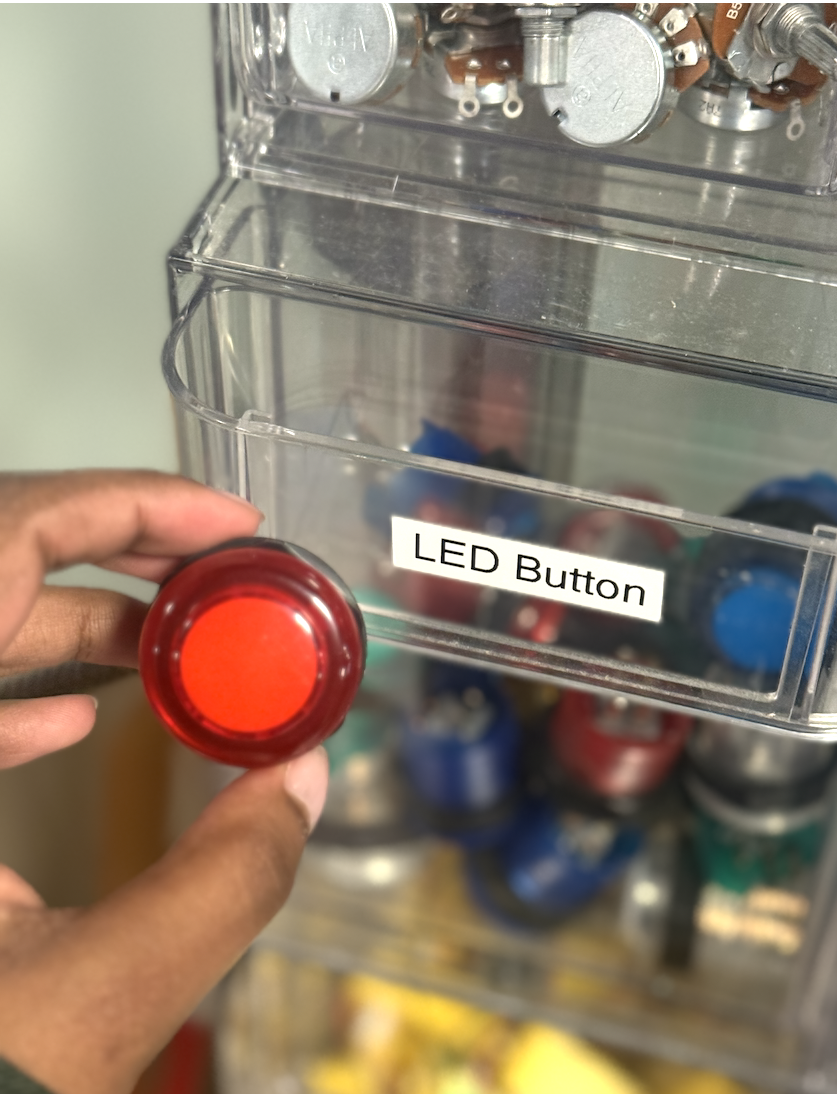
I’ve successfully soldered one of the large LED pushbuttons with its wires and tested it using the Arduino with the internal pull-up setup. The button press registers correctly, and the built-in LED lights up when triggered from code. This confirms that the wiring and logic are working as intended.
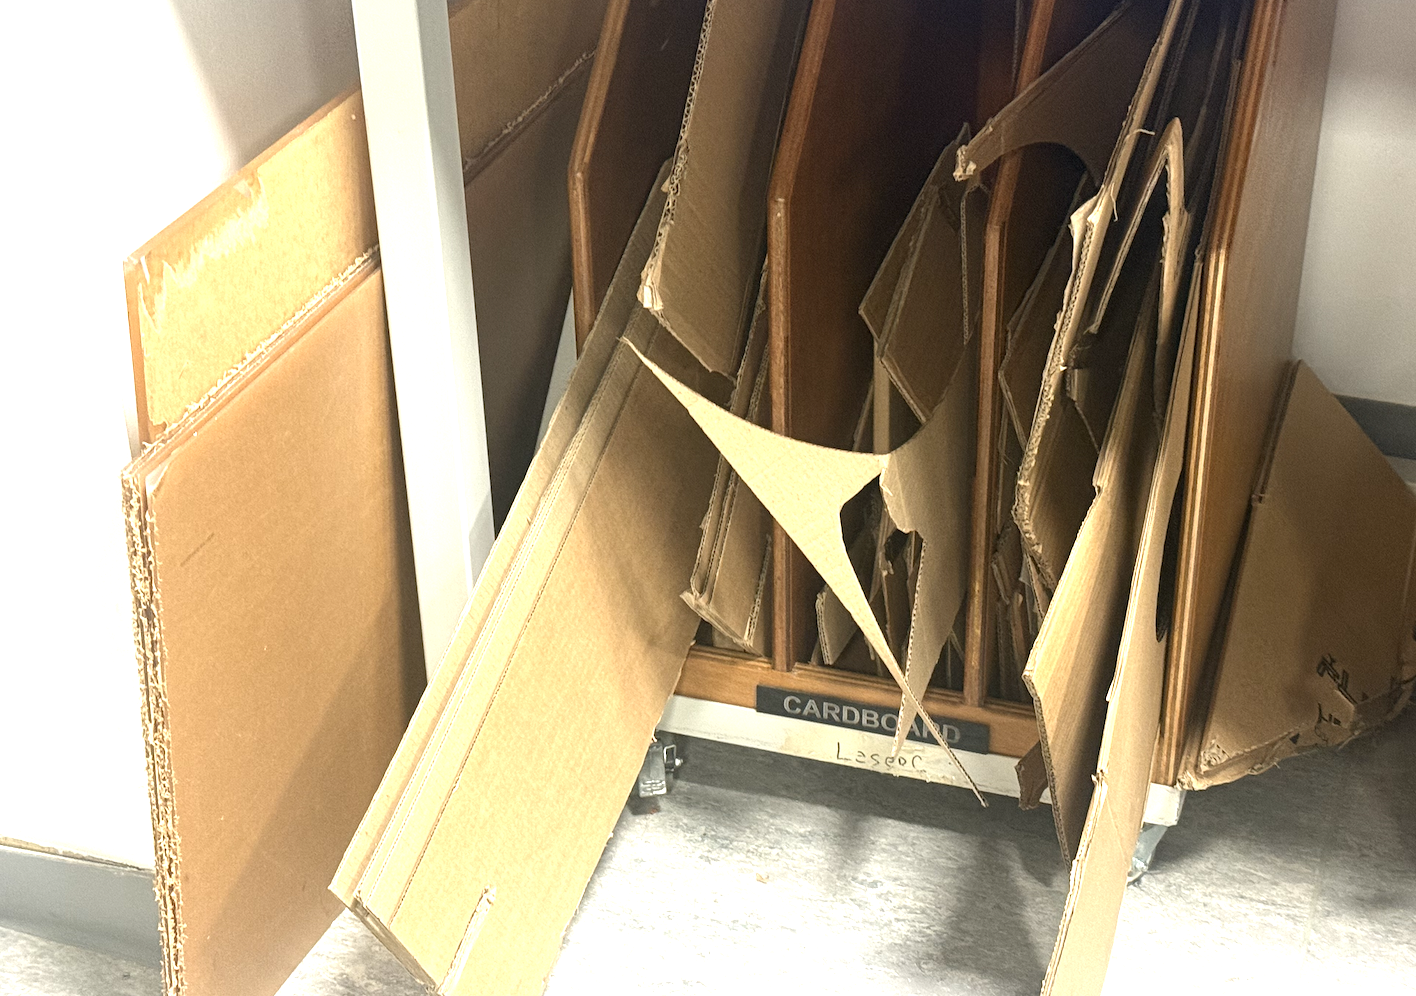
Next, I’ll repeat the soldering and wiring process for the remaining three buttons, ensuring each is connected to a unique input and output pin. I’ve also laser-cut the top panel of the box, which has four holes precisely sized to mount the pushbuttons. This will keep the layout organized and user-friendly for gameplay. Once all buttons are mounted and connected, I’ll move on to integrating all four into the Arduino code and begin syncing with the visual side in p5.js.
Laser Cutting Video: