All Posts

Generative Text_Aaron

Concept

The idea for this code was to generate a random text/ character on the canvas using noise feature. the canvas color becomes darker and darker with each word generated and printed on the screen. I was inspired by the idea of dots disappearing from my computer screen as I worked on a data visualization project I had given up on.

Implementation

The concept was implemented using p5.js. Key technical implementations includes preload and noise feature.

Challenges

Some of the challenges I faced was randomizing the position of both the word and character on the screen; I couldn’t solve it.

Generative Text – Aigerim

Inspiration/Concept

For this project, I created a fortune cookie application that gives a random fortune. I love getting fortune cookies and seeing my luck (even though I do not believe in them, it is still a fun activity), and I wanted to transfer that fun little moment into a web application. To create the effect of anticipation one gets when opening the cookie’s package I made a fortune come up as in a typewriter, letter by letter without revealing everything all at once.

The Product

I am really happy with the way it turned out, especially given that I was not really sure what I was going for when I just started the project. The product is really simple and minimalistic, and I love it this way because I want the focus to be on the fortune itself, which I think was achieved pretty nicely.

Challenges

The biggest challenge for me was restarting the typewriter when a user clicks on the mouse and the typewriter is done writing. Since my function is not blocking, I had multiple fortunes written on top of one another at some point. To solve this, I added a boolean printing that is set to True whenever I am about to enter the typeWriter function within start and set it back to False when I am about to leave it. Then, whenever a mouse is clicked, I first check whether the variable is true or not and print a new fortune when the previous one is done printing (or displaying) and the user clicks.

function start() {
  if (printing == false) {
    printing = true;
    typeWriter(random(fortunes), 0, 50, height / 2, 80);
  }
}

function mouseClicked() {
  start();
}


HW4: Generative Text Video

Inspiration

The inspiration for this generative text art was to use text to render a live video. The goal was to use the brightness of each pixel in a video capture to determine the color of a letter displayed in the center of the pixel and to keep rendering this video live. The code was inspired from a coding challenge by coding train.

Concept

The concept was to create a generative piece of art that was unique to the video input. The text displayed would change based on the brightness of each pixel, resulting in a dynamic and ever-changing piece of art. The text used was limited to the string “ME” and the letters were displayed in the center of each pixel. The string can also be changed to say something else.

Implementation

The implementation involved using the p5.js library to capture video input and display text on a canvas. The code loops through each pixel in the video capture, calculates the brightness of the pixel in grayscale, and uses that value to set the color of the displayed text. The text is displayed in the center of each pixel and changes based on the brightness of the pixel.

Challenges

One of the main challenges that I faced was to decide on an appropriate dimensions of the rendered video in order for p5.js to not break while looping through the video.

Reflections

Overall, this project was a successful exercise in creating generative art using code. The dynamic and ever-changing nature of the art is an interesting concept that can be expanded upon in future projects. The ability to use video input as the source for the art adds an extra level of interactivity and uniqueness to the piece.

Sketch Link: https://editor.p5js.org/swostikpati/full/U-0U4yVHN

References

Week 4 – Love Yourself :)

Overview:

For this assignment, I tried to utilize the typography concepts learned in class in combination with WebGL (Web Graphics Library), to create an interactive generative text.

Concept:

I’m really into typography and generative text art, so I particularly enjoyed working on this assignment. I was surfing though Pinterest for inspiration, and was inspired by the works below. Unable to choose between those two works, I decided to combine them.

The concept of this work is self-love and simplicity. I like setting these kind of photos as my phone wallpaper as a reminder to not compare my journey with other’s journey, because it’s hard to forget it or ignore it when it’s right in front of my nose 🙂 Therefore,  I decided to create my own wallpaper using the code.

Since the concept is “self-love”, I relied on the colors associated with love, such as red, white and black (as they’re basic colors). I also played around with the opacity of the text, and created a fade-away effect for the text as it progresses down the row.

Code:

The major highlights of my code are the sine-wave text and heart made of the word “love”. First, I created a sine-wave by using by displaying the string character by character and using sin() function to make y-value dependent on the x-value of the text.

To draw the heart, I used the mathematical formula based on the polar coordinates which is described in this video. However, I adapted the formula used there to my code so that instead of the vertices, my shape will consist of  the words “love”. I used beginShape() and endShape() to connect the words together to form a heart shape, and I used push() and pop() to limit the rotation only to the heart. To make the rotation effect, I utilized the rotateY() function of the WEBGL library, which allows us to rotate the shape around the y-axis.

I also tried to integrate some interactivity to this work: the user would be able to change the “mode” of the artwork from bright to dark by pressing the mouse (when the mode changes, the main text also changes). Also, the user can control the rotation by stopping or continuing it through the key “s”.

Here are the parts of the code I referenced:

//draw the heart
  let letter= "love";
  textSize(sizeHeart);
  
  //create a shape to be able to rotate it later
  beginShape();
  //use push and pop to apply the rotation only to the heart shape
  push();
  
  if(toStop==false){
    //rotate the heart around the y-axis
      rotateY(millis() / 1000);
  }

  
  //opacity of the heart is modifiable
  fill(210, 4, 45,heartOpacity);
   stroke(0);
  
  //if we set a to be 0.01, we will get a heart with densely located letters 
  for(let a=0; a<TWO_PI; a+=0.05){
    let r=10;
    let x= r*16*pow(sin(a),3);
    let y=-r*(13*cos(a) - 5*cos(2*a) - 2*cos(3*a) - cos(4*a))
    text(letter,x,y);
  }
  pop();
  endShape();
//draw the text
  let textLength = msg1.length;
  let tWidth = textWidth(msg1);
  noStroke();
  textSize(sizeMsg);
  
  //plce the text in the center
  let textStart_x = 0 - (tWidth / 2) + 20;
  
   //make the characters of the string follow a sine wave pattern
  for(j=0; j<5; j++){
    
    //since we have 5 rows of the same text, each of the rows will start at different y locations
    let textStart_y = -20 + j*20;
    
    for(i=0; i<textLength; i++){
      
      //change the text and its opacity when the mouse is pressed
      if(mouseIsPressed){
        fill(255,255,255,80*(j+1));
        msg1="trust yourself trust yourself trust yourself trust yourself trust yourself";
      }
      else{
        fill(0,0,0, 30*(j+1));
        msg1="love yourself love yourself love yourself love yourself love";
      }
      
      //print the text by printing characters one by one
      text(msg1[i],textStart_x+i*10, textStart_y+10*sin((textStart_x+i*10)/30));
    }
  }

Reflection and future Improvements:

Overall, I really enjoyed working on this assignment (I enjoyed it as much as making my self-portrait, haha) and I’m content with how my work turned out as well. One of the suggestions for further improvement would be using more heart shapes of different size and making them rotate in different pace and direction to emulate the heart-shaped medallion. Also, playing around with the color of the text and applying different colors to different rows or characters is also one suggestion.

Assignment 4- Generative text

INSPIRATION

In this assignment, out of the two prompts which we could provide a submission for, I decided to go with the “generative text” one. As usual, coming up with what to do was a challenge for me. I spent a lot of time going through YouTube videos and existing samples to draw inspiration from them but could not get any.  While perusing YouTube, I saw a video about Apple’s next big event. That was when it dawned on me that every time I got a new Apple device, the first welcome screen would write the word “hello” in many different languages. See below:

After watching the above video, I decided to recreate something similar to it.

PROCESS 

The code starts by initializing my variables and the array to hold the “hello” translations to be displayed. A word class is created. The Word object is initialized with the first word in the words array. Then, each time the display() method is called, the current word is displayed, and index is incremented. When the index reaches the end of the array, it is reset to 0 so that the words cycle through from the beginning again. Finally, in the draw() function, a new Word object is created every 100 frames using the update index value. To make the words look just like that of Apple’s I had to download and import the “California” font using the preload() and loadFont() functions.  I initially had the translations in so many languages including Japanese, Chinese and some other languages but the font-type I decided to use did not have support for writing in these languages so i had to take them out of my array.

WORK:


FUTURE IMPROVEMENT

In a future version, i intend to add more style to the written texts. I intend to make the display appear as though it is being written by hand just as it is in the original piece by Apple.


Assignment 4: Data Visualization

Concept:

Upon looking at a bunch of open source data sets, I found a data set for Exoplanets that have been documented outside our solar system by NASA: https://www.kaggle.com/datasets/adityamishraml/nasaexoplanets

I thought this would be pretty cool to implement as a form of data visualization as I don’t think I’ve seen any examples of data visualization for astronomy or space hence, I decided to implement this into my assignment.

Process and Planning:

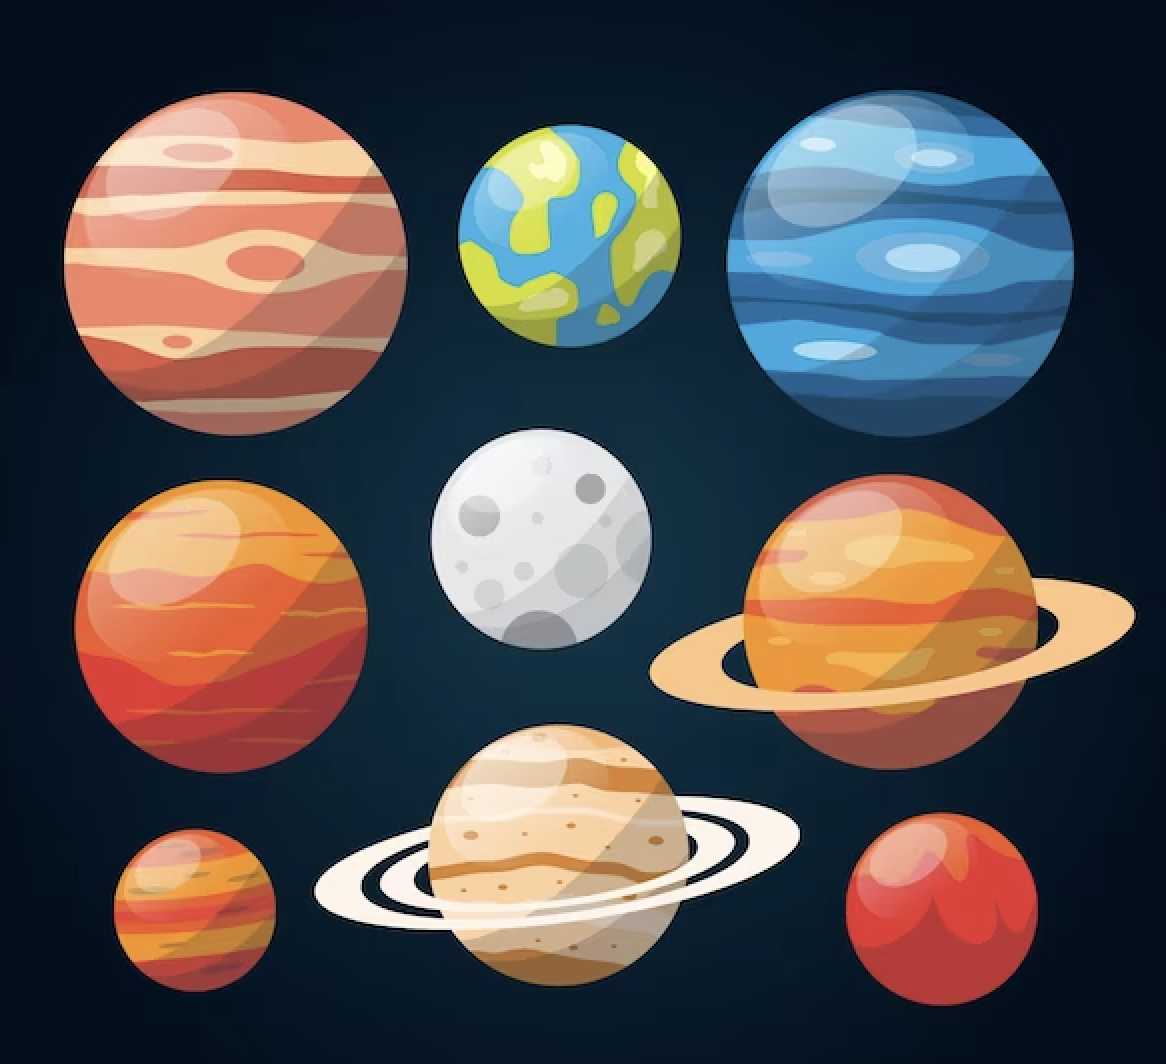
For visualizing the exoplanets, I didn’t want to simply draw an ellipse as I thought it wouldn’t look that great and it would be too simple. Hence, I found some nice planet art online and used some of them to visualize some of the exoplanets:

I used a few of these planets and put them into some img variables and then put them all into an array of planet designs so that I could access any design I wanted from this array anytime I wanted. I also loaded the entire exoplanets.csv dataset into an array called exoplanet_data which I would plan to use later in my code.

function preload() {
  exoplanet_data = loadStrings("exoplanets.csv");

  planet1_img = loadImage("Planet1.png");
  append(planet_designs, planet1_img);
  
  planet2_img = loadImage("Planet2.png");
  append(planet_designs, planet2_img);
  
  planet3_img = loadImage("Planet3.png");
  append(planet_designs, planet3_img);
  
  planet4_img = loadImage("Planet4.png");   
  append(planet_designs, planet4_img);
  
  planet5_img = loadImage("Planet5.png");
  append(planet_designs, planet5_img);
}

I knew that I would have to create a class in which each exoplanet would be its own object, hence I made one here:

class ExoPlanet {
  constructor() {
    this.x;                  //X coordinate for the planet                    
    this.y;                  //Y coordinate for the planet 
    this.planet_radius;      //Radius of the planet image
    this.design_num;         //Type of planet design from planet_designs
    this.data;               //String data of the planet
    this.data_split;         //Splits the data into an array of its data
    
    this.init();
    this.printData();
  }
  
  //This function initializes all the variables for each exoplanet.
  init() {
    this.design_num = int(random(5));
    this.planet_radius = planet_designs[this.design_num].width/10;
    
    this.x = mouseX;
    this.y = mouseY;
    
    this.data = exoplanet_data[data_count];
    this.data_split = split(this.data, ',');
    if(data_count != exoplanet_data.length) {
      data_count++;
    }
    else {
      print("All planets printed!");
    }
  }
  
  //This function takes a random planet image and draws it at a random (x,y) coordinate on the canvas
  draw() {
    image(planet_designs[this.design_num], this.x, this.y, planet_designs[this.design_num].width/5, planet_designs[this.design_num].height/5);   
  }
  
  displayData() {
    fill(255, 255, 180);
    rect(mouseX, mouseY, 500, 120);
    
    textAlign(LEFT);
    fill("black");
    
    text("Planet Name:", mouseX+10, mouseY+30);
    text("Distance from Earth (ly):", mouseX+10, mouseY+55);
    text("Stellar Magnitude (brightness):", mouseX+10, mouseY+80);
    text("Planet Type:", mouseX+10, mouseY+105);
    
    fill("red");
    text(this.data_split[0], mouseX+140, mouseY+30);
    text(this.data_split[1], mouseX+235, mouseY+55);
    text(this.data_split[2], mouseX+290, mouseY+80);
    text(this.data_split[3], mouseX+125, mouseY+105);
  }
  
  //This function is for debugging and code checking to ensure everything runs smoothly.
  printData() {    
    print("Planet Image:",this.design_num);
    print("Planet Radius:",this.planet_radius);
    print("Planet Data:",this.data);
    
    print("Planet Name:",this.data_split[0]);
    print("Distance (from Earth):",this.data_split[1]);
    print("Stellar Magnitude:",this.data_split[2]);
    print("Planet Type:",this.data_split[4]);
  }
}

In this class, each planet has:

  • An (X, Y) coordinate of the planet on the canvas (this would be where the user’s mouse is when they click)
  • The radius of the planet (so when the user moves close to the planet, its data pops up)
  • Design number: This indicates any one of the planet images shown perviously.
  • Data: This entails the particular planet data from the csv file for that planet.
  • Data_Split: This variable would be an array of each component of the data of the planet, hence, it would be easier to print out its data.

I had an initialize function, init(), to initialize it with some variables. I had another function which would draw the planet onto the canvas using the image(). Finally, I had a displayData() function which would print out a rectangle containing some of the vital information of the exoplanet’s data.

How does the data pop up?

//Here we continuously draw the planets on the canvas
for(let j=0; j<exoplanets.length; j++) {
  exoplanets[j].draw();
  planet_dist = dist(exoplanets[j].x, exoplanets[j].y, mouseX, mouseY);
  
  //If the mouse coordinates hit's the planet, it will print the data of that planet.
  if(planet_dist < exoplanets[j].planet_radius) {
    exoplanets[j].displayData();
  }
}

Essentially, in the draw() function, it will continuously print the exoplanet using the draw function from the class. It calculates the planet_dist between the planets coordinates and the user’s mouse. If the user’s mouse touches the planet, then it will call the displayData() function.

I added it such that the user can add a planet onto the canvas by simply clicking their mouse as well.

Final Piece:

Overall Thoughts:

Overall, I’m pretty happy with the interactivity and design with my assignment. Perhaps, for improvements I could have included more planet shapes, and maybe even added some cool sound effects to enhance the experience a little more. More improvements, I could have also made sure that if the planet size was bigger, the planet drawn could also be bigger and vice versa. This way the data visualization is even stronger.

Midterm Project Ideas:

For my midterm, I wanted to develop a game since I really love games and would love to get into game development. Some of the ideas that initially sparked in my head was perhaps something like “Battleship” or maybe something like a parody of “Subway Surfers” where the user can continuously run and get the highest score or something like that. For now these are the ideas I thought of initially but I’d love to come up with a cool unique game of my own.

Week 4 – Neon Sign

Inspiration:

I had a particularly challenging time with this assignment because I struggled to determine what to make for this topic. Despite scouring the internet for inspiration, I found examples that were either beyond my coding abilities or too basic. I tried multiple projects but was not satisfied because they weren’t creative enough. However, my fortunes changed when I received a Snapchat memory today, reminding me of a quote a friend wrote on my dorm’s whiteboard exactly one year ago. This quote has always been a source of inspiration for me to stay focused on my work and avoid procrastination, and it remains one of my favorite quotes. The Snapchat memory was:

I needed to come up with a unique way to showcase this text, which is when my roommate’s suggestion came in handy. While discussing ways to decorate our room, my roommate proposed the idea of using neon lights. The moment he mentioned this, I realized that adding a neon light effect to the quote could work.

Coding Process:

To begin with, I searched online for neon signs that can be used as room décor and was drawn to those with a cursive font. Hence, I opted for a cursive font and explored multiple websites until I found the “Havelberg” font. Following this, I researched how to add and implement this font using p5js. Once I gained this knowledge, I created a preliminary layout of the project, outlining where everything should be placed. The final skeleton looked somewhat like this:

Initially, I encountered challenges in making the project appear more visually appealing and imaginative. To tackle this, I got the idea of incorporating electricity that would flow through the wires and illuminate the sign upon pressing the “on” button. However, as I progressed, I realized that the end result was not as aesthetically pleasing as I had hoped. As a solution, I decided to remove the grey background and start with a blank canvas of darkness. The code for the electricity flowing looked like this:

if (on_button == true) {
    if (!sound.isPlaying()) {
      sound.play(); //the electric static voice
    }
    fill("gold"); //for the wires
    noStroke();
    //since upspeed is in negative values that is why we subtract
    if (height + upspeed > uplimit) {
      upspeed = upspeed + vertical_speed;
      rect(360, 400, wire_width, upspeed); //the first part of the wire and looks like electricity is travelling up
    } else {
      rect(360, 400, wire_width, upspeed); //when it has reached its limit, then it stops and stays there
      if (width + leftspeed > leftlimit) {
        //as soon as the wire part 1 has reached its designated limit, now we start moving to the left
        leftspeed = leftspeed + horizontal_speed; //horizontal speed is the same as upspeed so that it looks uniform
        rect(360, uplimit, leftspeed, wire_width); //leftspeed keeps updating so it looks like it is moving to the left
      } else {
        rect(360, uplimit, leftspeed, wire_width); //same as above
        if (height + upspeed2 > uplimit2) {
          upspeed2 = upspeed2 + vertical_speed; //upspeed2 is different from upspeed since the starting and ending points are different
          rect(360 + leftspeed, uplimit, wire_width, upspeed2);
        } else {
          rect(360 + leftspeed, uplimit, wire_width, upspeed2);
          stroke(57, 255, 20);
          strokeWeight(4);
          noFill(); //make rectangle after the last wire reaches the rectangle
          rect(25, 25, 350, 175, 20); //rectangle but with curved edges
          strokeWeight(1);
          fill(57, 255, 20, sin(frameCount * 0.1) * 255); //fills the text and adds a flicker effect to it
          text("you didnt come this far", 45, 95);
          text("just to come this far", 70, 145);
        }
      }
    }
  }

After adding the button, audio, and the mouseClicked() feature, the final product looked like this:

Reflection:

Despite feeling proud of the code I developed to create the electricity flow, I did not derive much personal satisfaction from this assignment. I felt that my creative potential was hindered and that the piece could have been more visually appealing if I had managed to let my creativity flow more freely. Unfortunately, I was experiencing a creative block that prevented me from fully enjoying the project. However, I plan to revisit this piece at a later date and explore ways to enhance its aesthetics. Apart from the creative aspect of it, I would want to add multiple neon signs in the future that take on random quotes from a csv file.

Generative Text – Week 4

Concept

This code defines a sketch that displays the letters “Zaid” in a random and animated way on a black background. The code is creating a canvas and for manipulating visual elements on the canvas. The code defines a font named “Courier New” and arrays for holding the letters to be displayed and the colors of those letters. It also creates a slider to adjust the speed of the animation. In the setup function, the canvas is created, the background color is set to black, and the font and text size are set.

The draw function is where the animation of the letters takes place. It starts by setting a slightly transparent black background. Then, it gets the value of the speed slider and iterates through the letters array. For each letter, it randomly changes its position, rotation, and size based on noise functions and the current frame count. It then uses the fill function to set the color of the letter based on the corresponding color in the colors array, and finally draws the letter using the text function. Overall, the code creates a dynamic and visually interesting display my name “Zaid” that changes in real-time based on the slider value.

Code

// Define the font to be used
let font = "Courier New";

// Define arrays for the letters and colors
let letters = [];
let colors = [];

// Define an array with the letters to display
let zaidLetters = ["Z", "a", "i", "d"];

// Define a variable to hold a slider for adjusting the speed
let speedSlider;

// Set up the canvas and other variables
function setup() {
  createCanvas(400, 400); // create a canvas with a size of 400x400 pixels
  background(0); // set the background color to black
  textFont(font); // set the font to the one defined earlier
  textSize(120); // set the text size to 120
  textAlign(CENTER, CENTER); // center the text alignment
  for (let i = 0; i < zaidLetters.length; i++) {
    letters.push(zaidLetters[i]); // add the letter to the letters array
    colors.push(color(random(255), random(255), random(255))); // add a random color to the colors array
  }
  speedSlider = createSlider(1, 10, 5); // create a slider for controlling the speed with a default value of 5
  speedSlider.position(10, 10); // set the position of the slider
}

// Draw the letters and animate them
function draw() {
  background(0, 20); // set the background color to a slightly transparent black
  let speed = speedSlider.value(); // get the value of the speed slider
  for (let i = 0; i < letters.length; i++) {
    // Randomly change the position and rotation of each letter
    let x = map(noise(i + frameCount / (50 * speed)), 0, 1, 0, width);
    let y = map(noise(i + 1000 + frameCount / (50 * speed)), 0, 1, 0, height);
    let angle = noise(i + 2000 + frameCount / (100 * speed)) * TWO_PI;
    let size = map(sin(i + frameCount / (30 * speed)), -1, 1, 90, 120);

    push();
    translate(x, y);
    rotate(angle);
    fill(colors[i]);
    textSize(size);
    text(letters[i], 0, 0);
    pop();
  }
}

Reflection / Future Improvements

This code is a fun and creative way to display text in a dynamic and animated way. It uses a combination of noise functions and various mapping techniques to generate the position, rotation, and size of each letter, resulting in a unique display with each run of the sketch.

One possible improvement for this code could be to add user interactivity by allowing the user to input their own text and select their own color palette. This could make the sketch more engaging for the user and allow for a wider range of creative possibilities. Another possible improvement could be to add more animation effects, such as scaling, fading, or moving the letters in different directions. This could add more visual interest and complexity to the sketch, making it even more dynamic and engaging. With some additional improvements and modifications, it could be further developed into a fully-featured text animation tool. The project was very fun to work with but it took time to get the hang of how to use text in a rather creative and artistic way.

Week 4 – Text Waterfall

My inspiration for this project came from the art piece called “Text Rain” made by Camille Utterback in 1999 where on a projected screen, letters from the alphabet were falling randomly. Only, in Camille’s piece, people could stand in front of the projector and “catch” the letters in order to try and make a word.

Below you can find my own project:

and below you can find the code for this project:

let letters = []; // array to store falling letters
let slider; // slider to control letter frequency

function setup() {
  createCanvas(600, 600);
  slider = createSlider(0, 50, 10); // create slider with range from 0 to 50 and default value of 10
  slider.position(10, height + 10); // position slider below canvas
}

function draw() {
  background(220);
  // generate new letters based on slider value
  for (let i = 0; i < slider.value(); i++) {
    letters.push(new Letter(random(width), -20, random(65, 91))); // add new letter with random position and uppercase letter code
  }
  // draw and update all letters
  for (let letter of letters) {
    letter.draw();
    letter.update();
  }
}

class Letter {
  constructor(x, y, code) {
    this.x = x;
    this.y = y;
    this.code = code;
    this.speed = random(1, 5);
  }
  
  draw() {
    text(String.fromCharCode(this.code), this.x, this.y); // draw letter at current position
  }
  
  update() {
    this.y += this.speed; // move letter down based on speed
    if (this.y > height) {
      // remove letter from array when it goes off screen
      let index = letters.indexOf(this);
      letters.splice(index, 1);
    }
  }
}

While obviously I am nowhere near the level to add Camille’s interactivity nor do I have the resources to do so, I took inspiration from this piece and tried to recreate it on my own. While her letters are a bit more scattered in order to make them easier to catch, I wasn’t limited by this feature and so tried to create a waterfall like effect in order to create a bombardment of letters. My reason for this is because one day in class, professor Mang mentioned something interesting about randomness and infinity in where say if letters keep falling randomly and for an infinite amount of time, eventually, they will end up spelling out a word. The thought of such a possibility intrigued hence why I wanted to create a waterfall in order to try and maximize that chance.

I’m especially proud of my implementation with the slider allowing the user to control how many letters should fell if it feels over or underwhelming for them. You can turn the slider to 0 if you are tired of the letters or max it out though I wouldn’t maybe recommend that if you have an especially old laptop.

I could definitely improve on this by adding more color to the background or adding some audio such as maybe a waterfall audio or such. It would add more personality and touch to the project though I guess you could say the simplicity if this project adds to it as well.

Weekly Assignment 4

Concept:

Initially I had some difficulty in choosing the data because I wasn’t sure what kind of data I should look for. Eventually, for my dataset, I chose a csv file that contained data regarding stars. The information contained in the csv are: temperature, luminosity, radius, absolute magnitude, star type, star color, and the spectral class. Of these categories, I used the radius, star type, and star color. Even after I chose my dataset, I wasn’t sure how to exactly visualize it since there wasn’t a category that specifically translated into x and y axis positions. So in the end I just ended up arranging the stars in order they had from the csv but separated by their type.

Coding:

My project consists of 6 different windows that can be navigated by the buttons on the top where each button switches the canvas to show the corresponding star type. The stars are aligned in the center and are arranged in order of the csv data and dare drawn by the color according to the data stored in the csv. Determining the radius of the stars was a bit tricky because the discrepancy between the smallest and the largest radius was too huge so I had to scale the radius for bigger and smaller stars.

switch(int(this.starType)){
      case 0:
        this.radius *= 100;
        break;
      case 1:
        this.radius *= 50;
        break;
      case 2:
        this.radius *= 1000;
        break;
      case 3:
        this.radius *= 20;
        break;
      case 4:
        this.radius *= 1;
        break;
      case 5:
        this.radius /= 10;
        break;
    }

So this is how I scaled the star sizes. For the bigger stars, since the radius is greater than the distance between the stars, the stars overlap and create a shape which is what I somewhat expected/aimed to achieve to create some sort of art. For the switching menus, I just created a separate drawing function that ignored all the stars that are not the current target to be drawn on the canvas.

Challenge:

My initial challenge for this assignment was deciding what kind of data to be used and how to visualize the chosen data. I couldn’t find an appropriate data and be creative with the data I have chosen so I basically had to compromise with what I found. Once I was working with the data set for my current final project, a challenge I ran into was that the data for each stars weren’t arranged by their types. So for example, after 10 type 0 stars, there would be 10 type 1 stars and later on after cycling through all the types there would be 10 type 0 stars again and so on. This was a problem for me since I wanted to arrange the stars based on the star types and align them in order. So I came up with a mechanism where I literally stored the x coordinates for all the stars in a 2d array where the columns were the star types and the rows are the arrays for actual x coordinates. And then in the instantiation of the star instances, for each star that is being instantiated, the counter for that star’s type will be increased and therefore the star’s x coordinate will be directed to the according x coordinate being stored in the 2d array. I know I could’ve took a different approach by sorting the array in a certain format, but I feel particularly proud with my problem solving skills even though it may not be the most efficient method.

let xCoArr = []
let xCoCounterArr = [0, 0, 0, 0, 0, 0];
   
... 

for(let i = 0; i < 6; i++){
  let xCo = 10; //the first x coordinate
  for(let j = 0; j < 40; j++){
    xCoRow.push(xCo); //Stores the x coordinate positions in the array
    xCo += 17; //the distance between the stars
  }
  xCoArr.push(xCoRow); //pushes each x coordinate array per star type
}

...

this.xCo = xCoArr[this.starType][xCoCounterArr[this.starType]];
xCoCounterArr[this.starType]++;


Reflection:

This wasn’t my particular favorite nor best assignment because I was really not sure what exactly to do till the last minute, but it still was a good experience in dealing with csv and using it to visualize through p5js. I think my best takeaway from this assignment is the problem solving experience with the arranging of the stars.