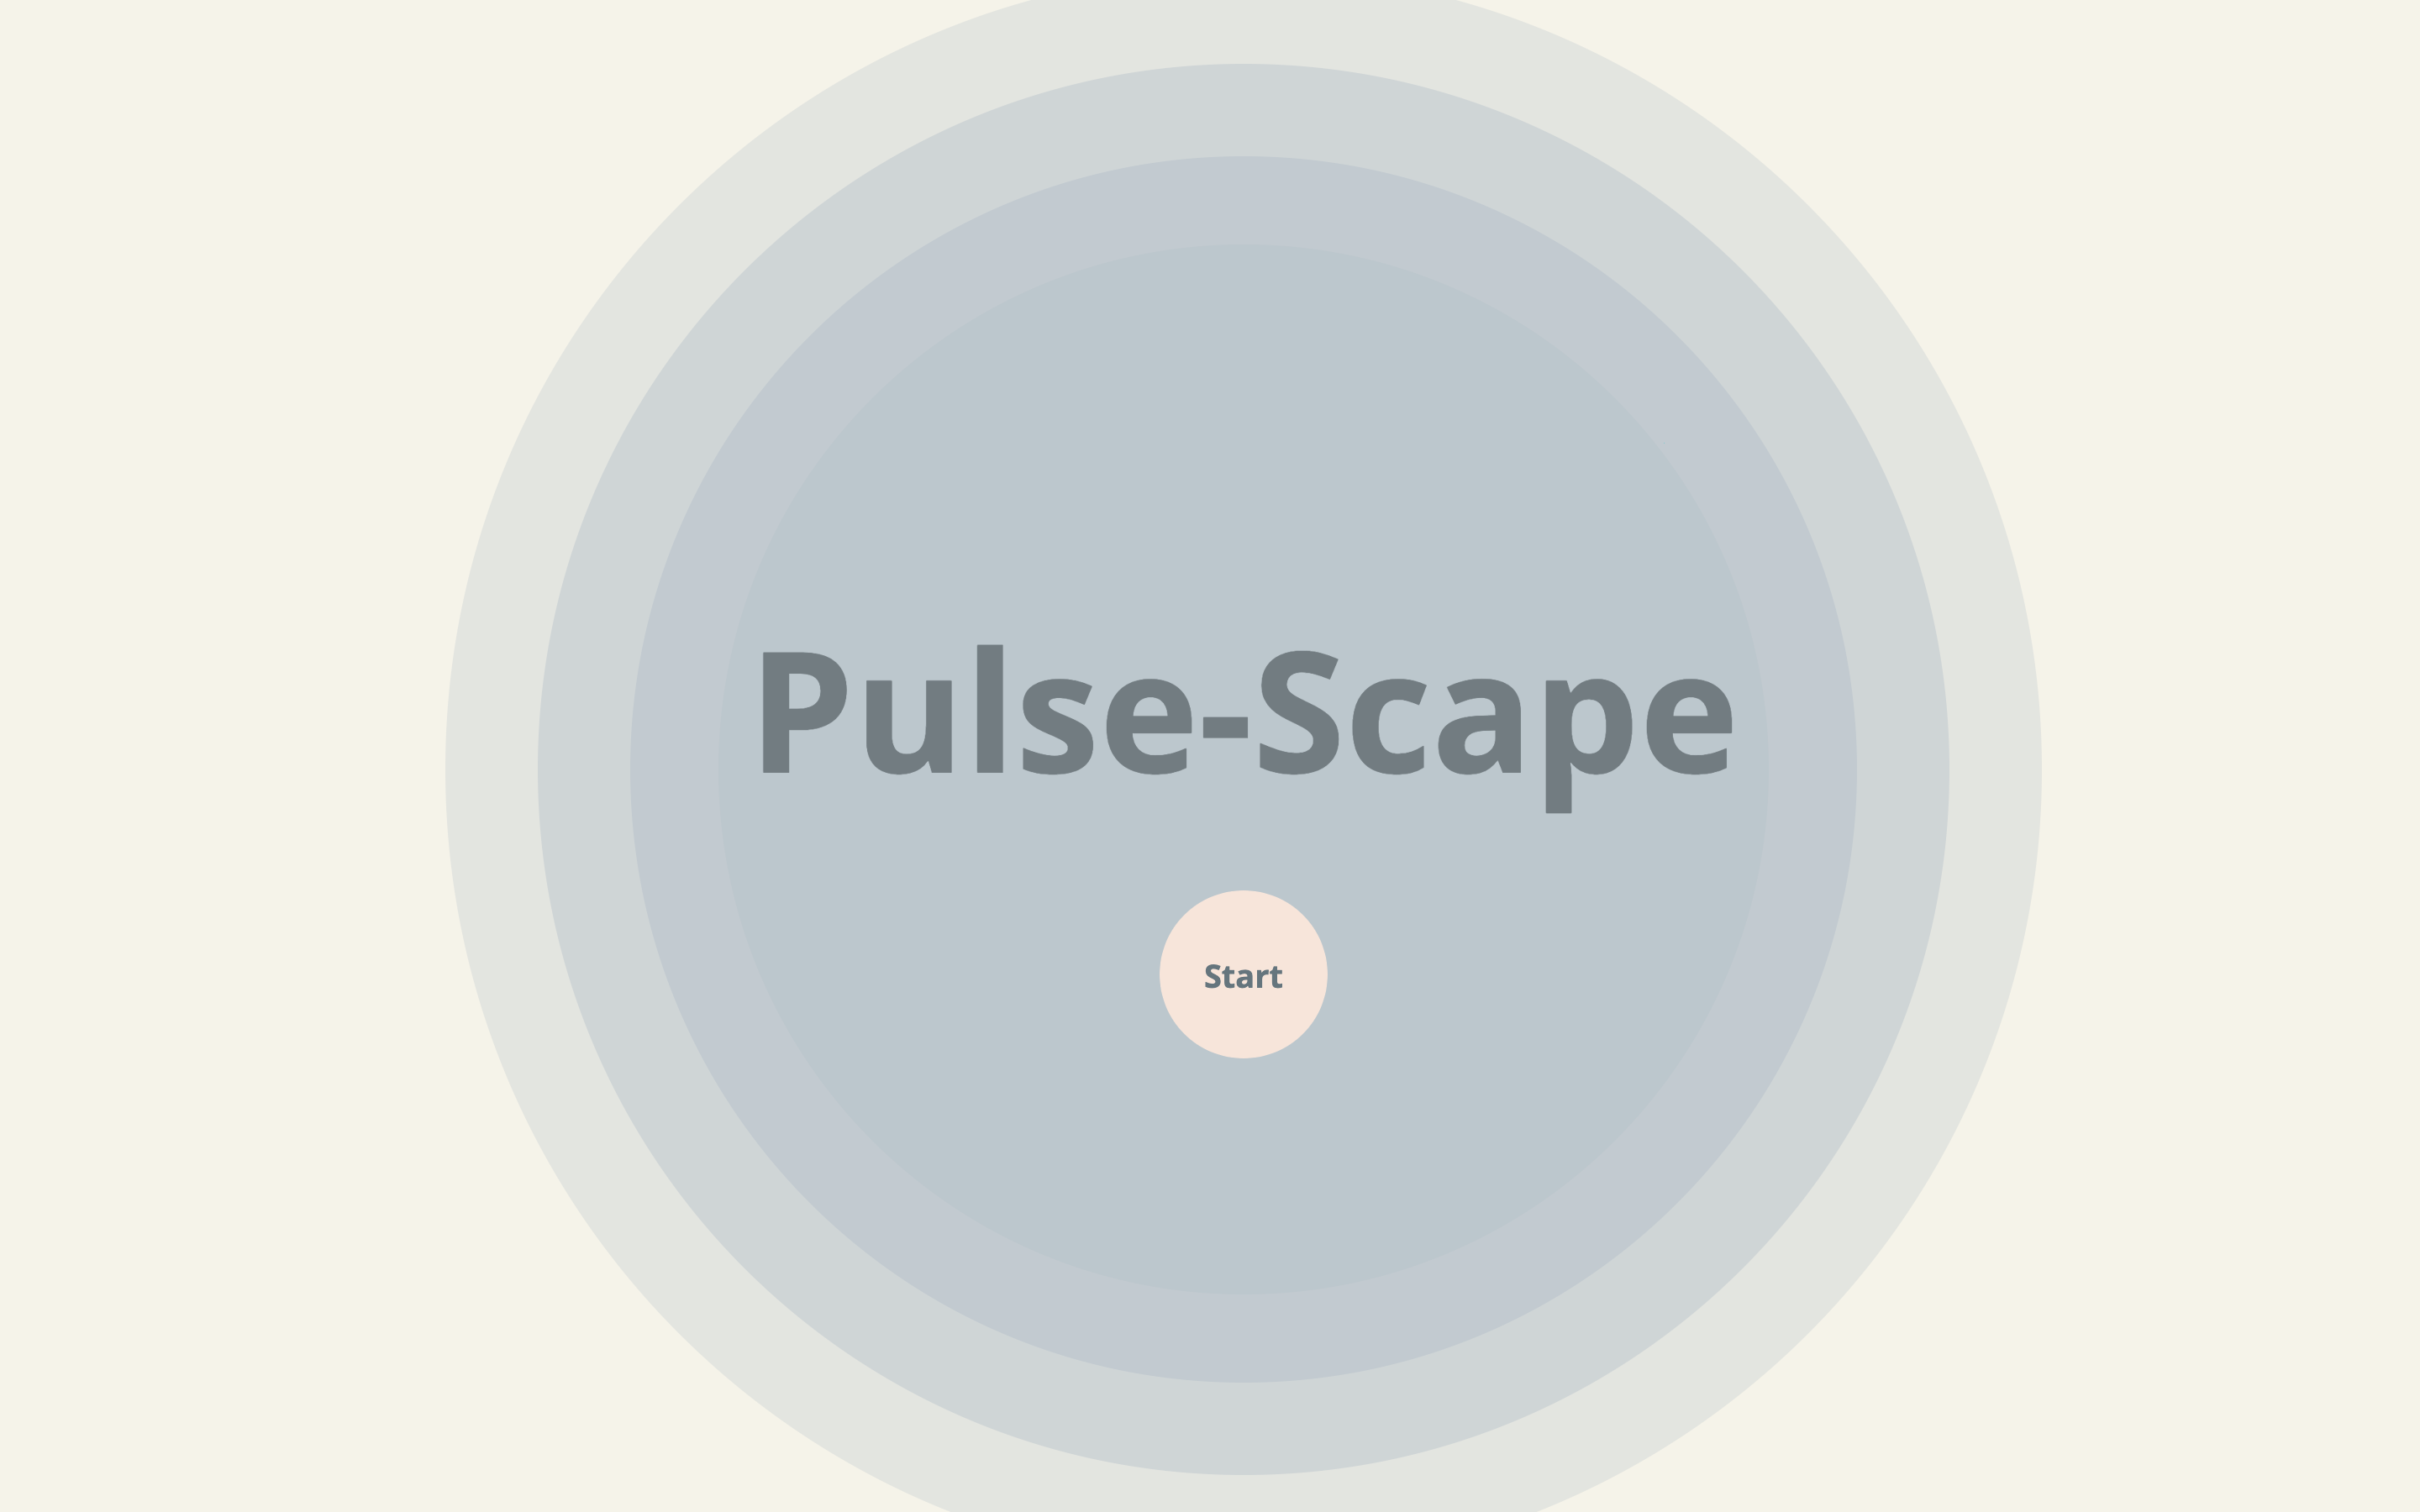
W14- Final Project: Pulse-Scape: An Interactive Experience

Pulse-Scape

An Interactive Experience

By Aysha AlMheiri :))


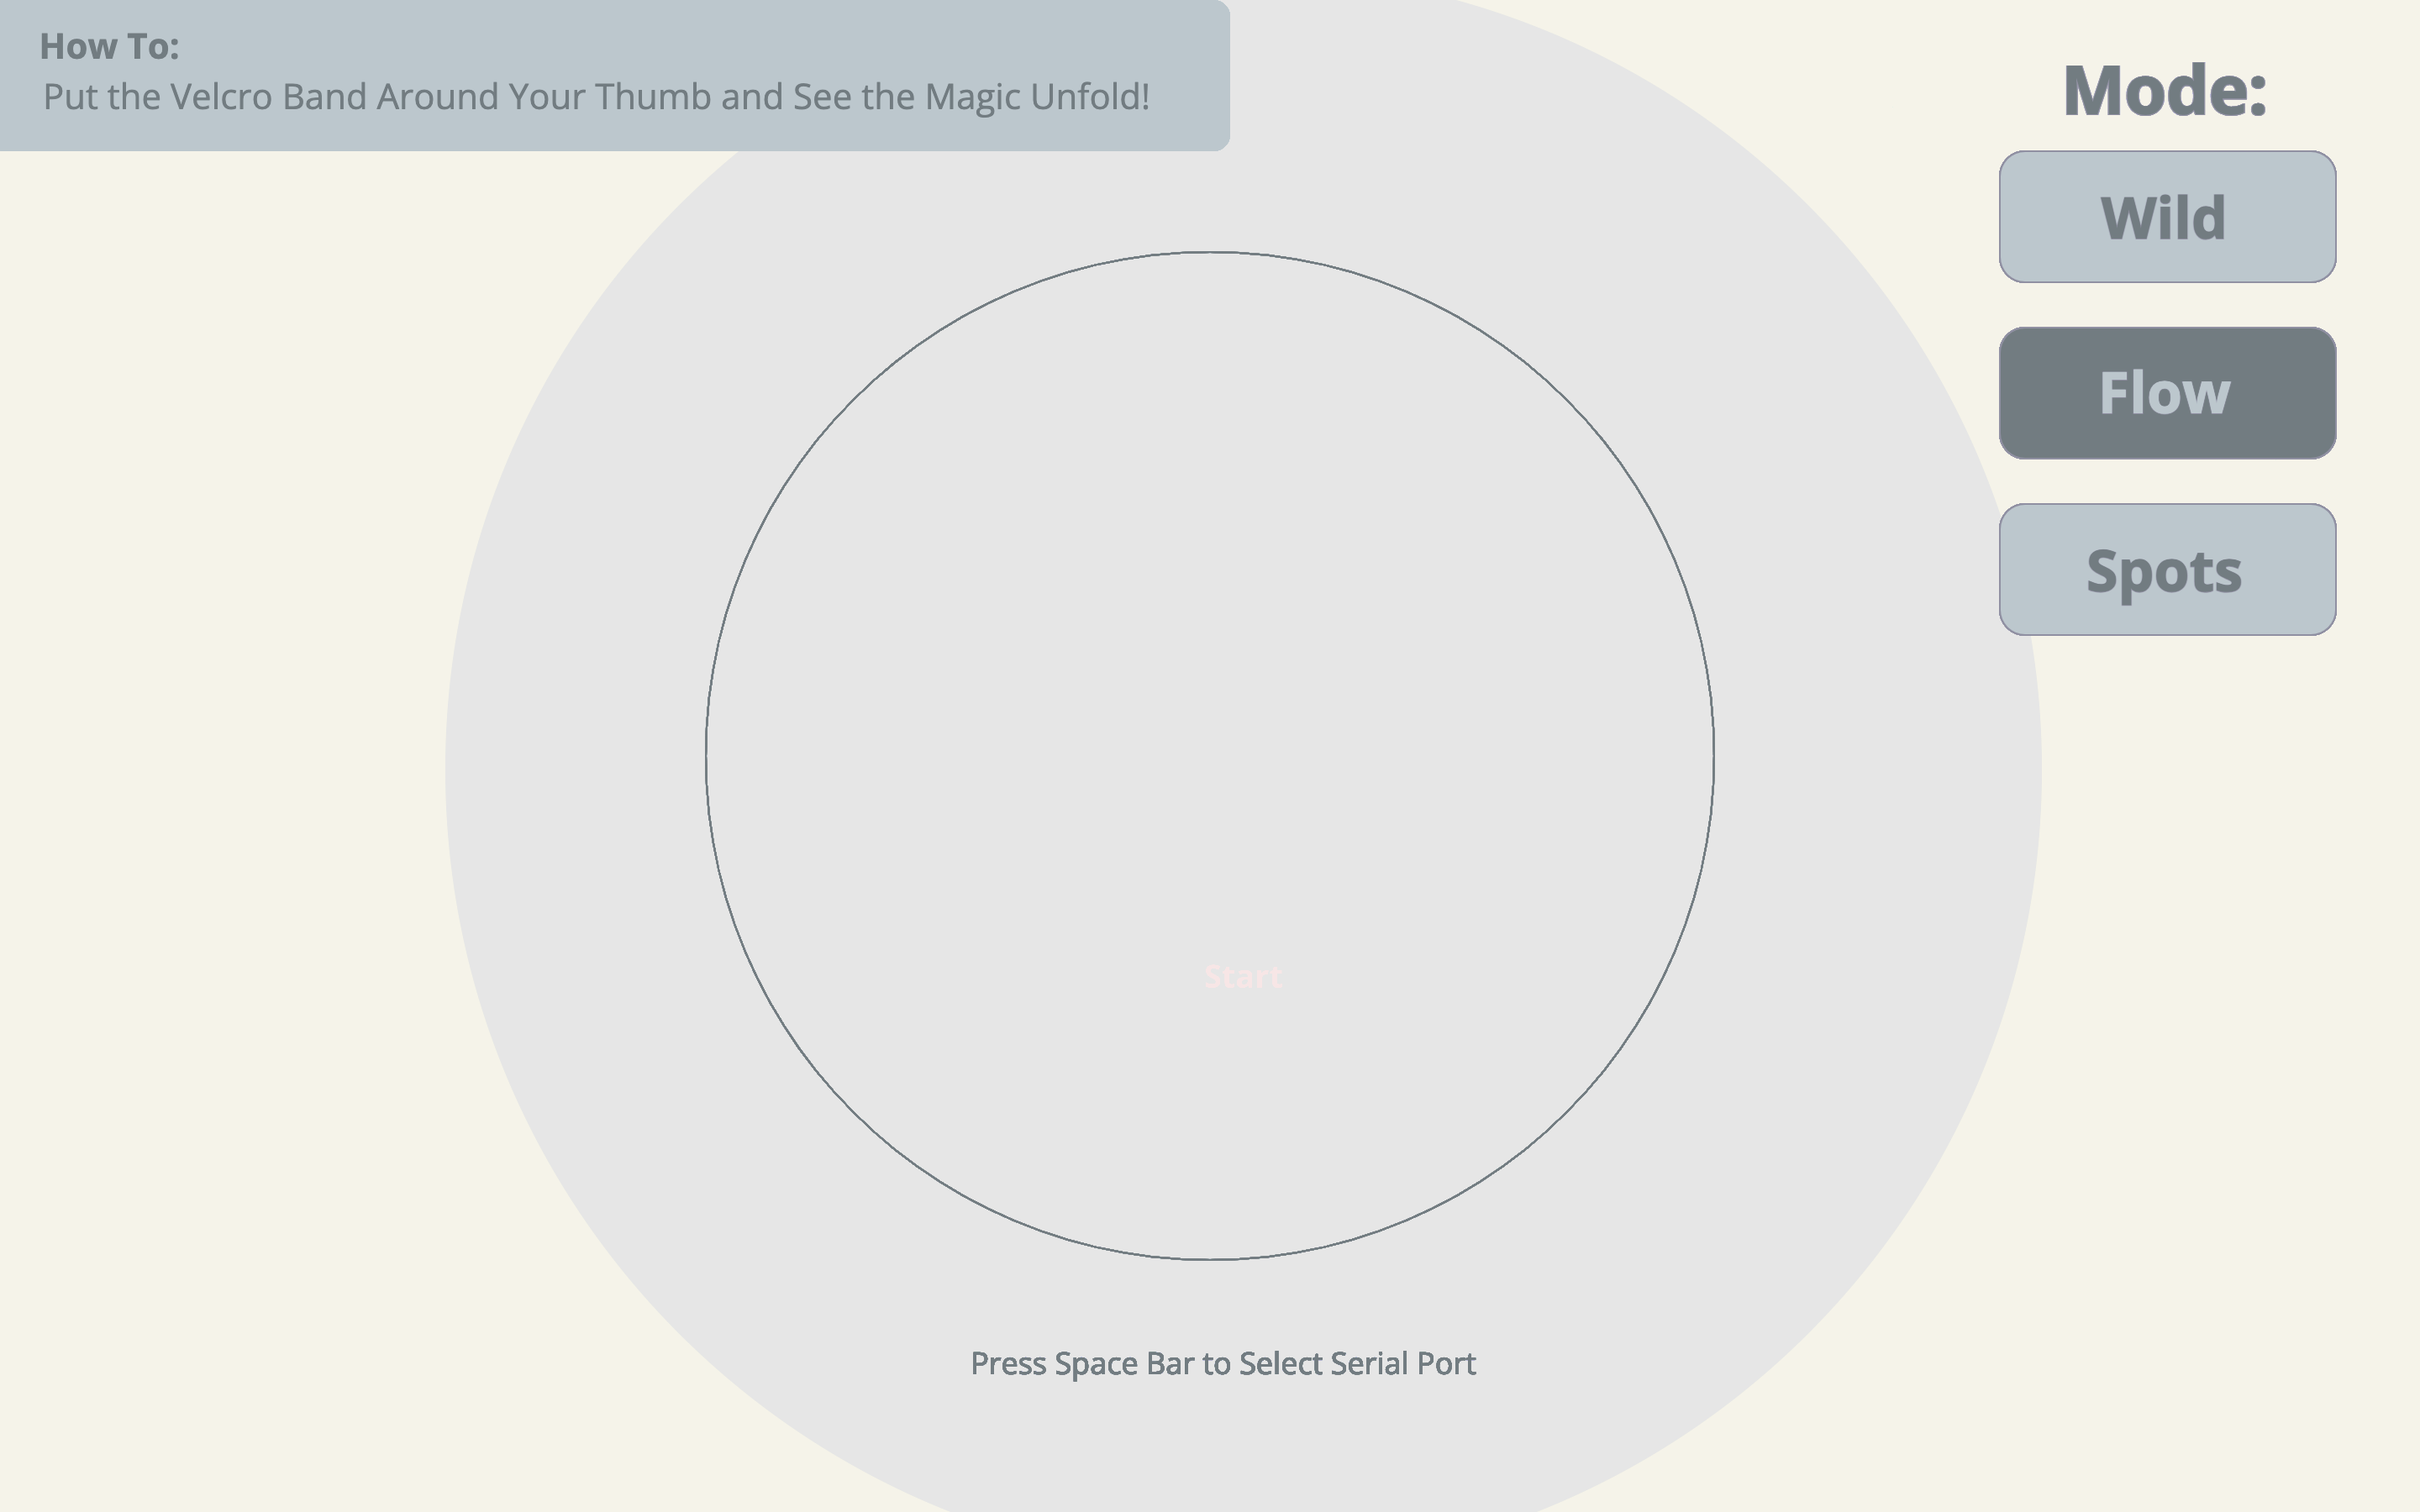
Pulse-Scape’s concept is one that revolves around integrating humanness, the arts, and technology. Detecting heart beat from the pulse-sensor, I wanted to use my project, Pulse-Scape, to serve as a bridge between the physical and the digital world, helping curate an intimate, colorful, and abstract art piece as a result. This interactive and dynamic experience created using P5JS as a canvas for the art to come to life showcases the ways in which our humanness, shown through our heart beat, can make art come to life through technology. The integration of 3 different potentiometers that correspond to different RGB values helps make this experience even more personal by allowing for users to choose specific colors for their art. The experience has different modes: Flow, Wild, and Spots, further personalizing the experience to users’ art style. Therefore, it is through all of this did Pulse-Scape get crafted into an immersive experience where users engage with the essence of human emotion through visual art, color, and technology, just how I envisioned it to be.

Screenshots of Interface on P5: 

Pulse-Scape in Action

Initial User-Testing:
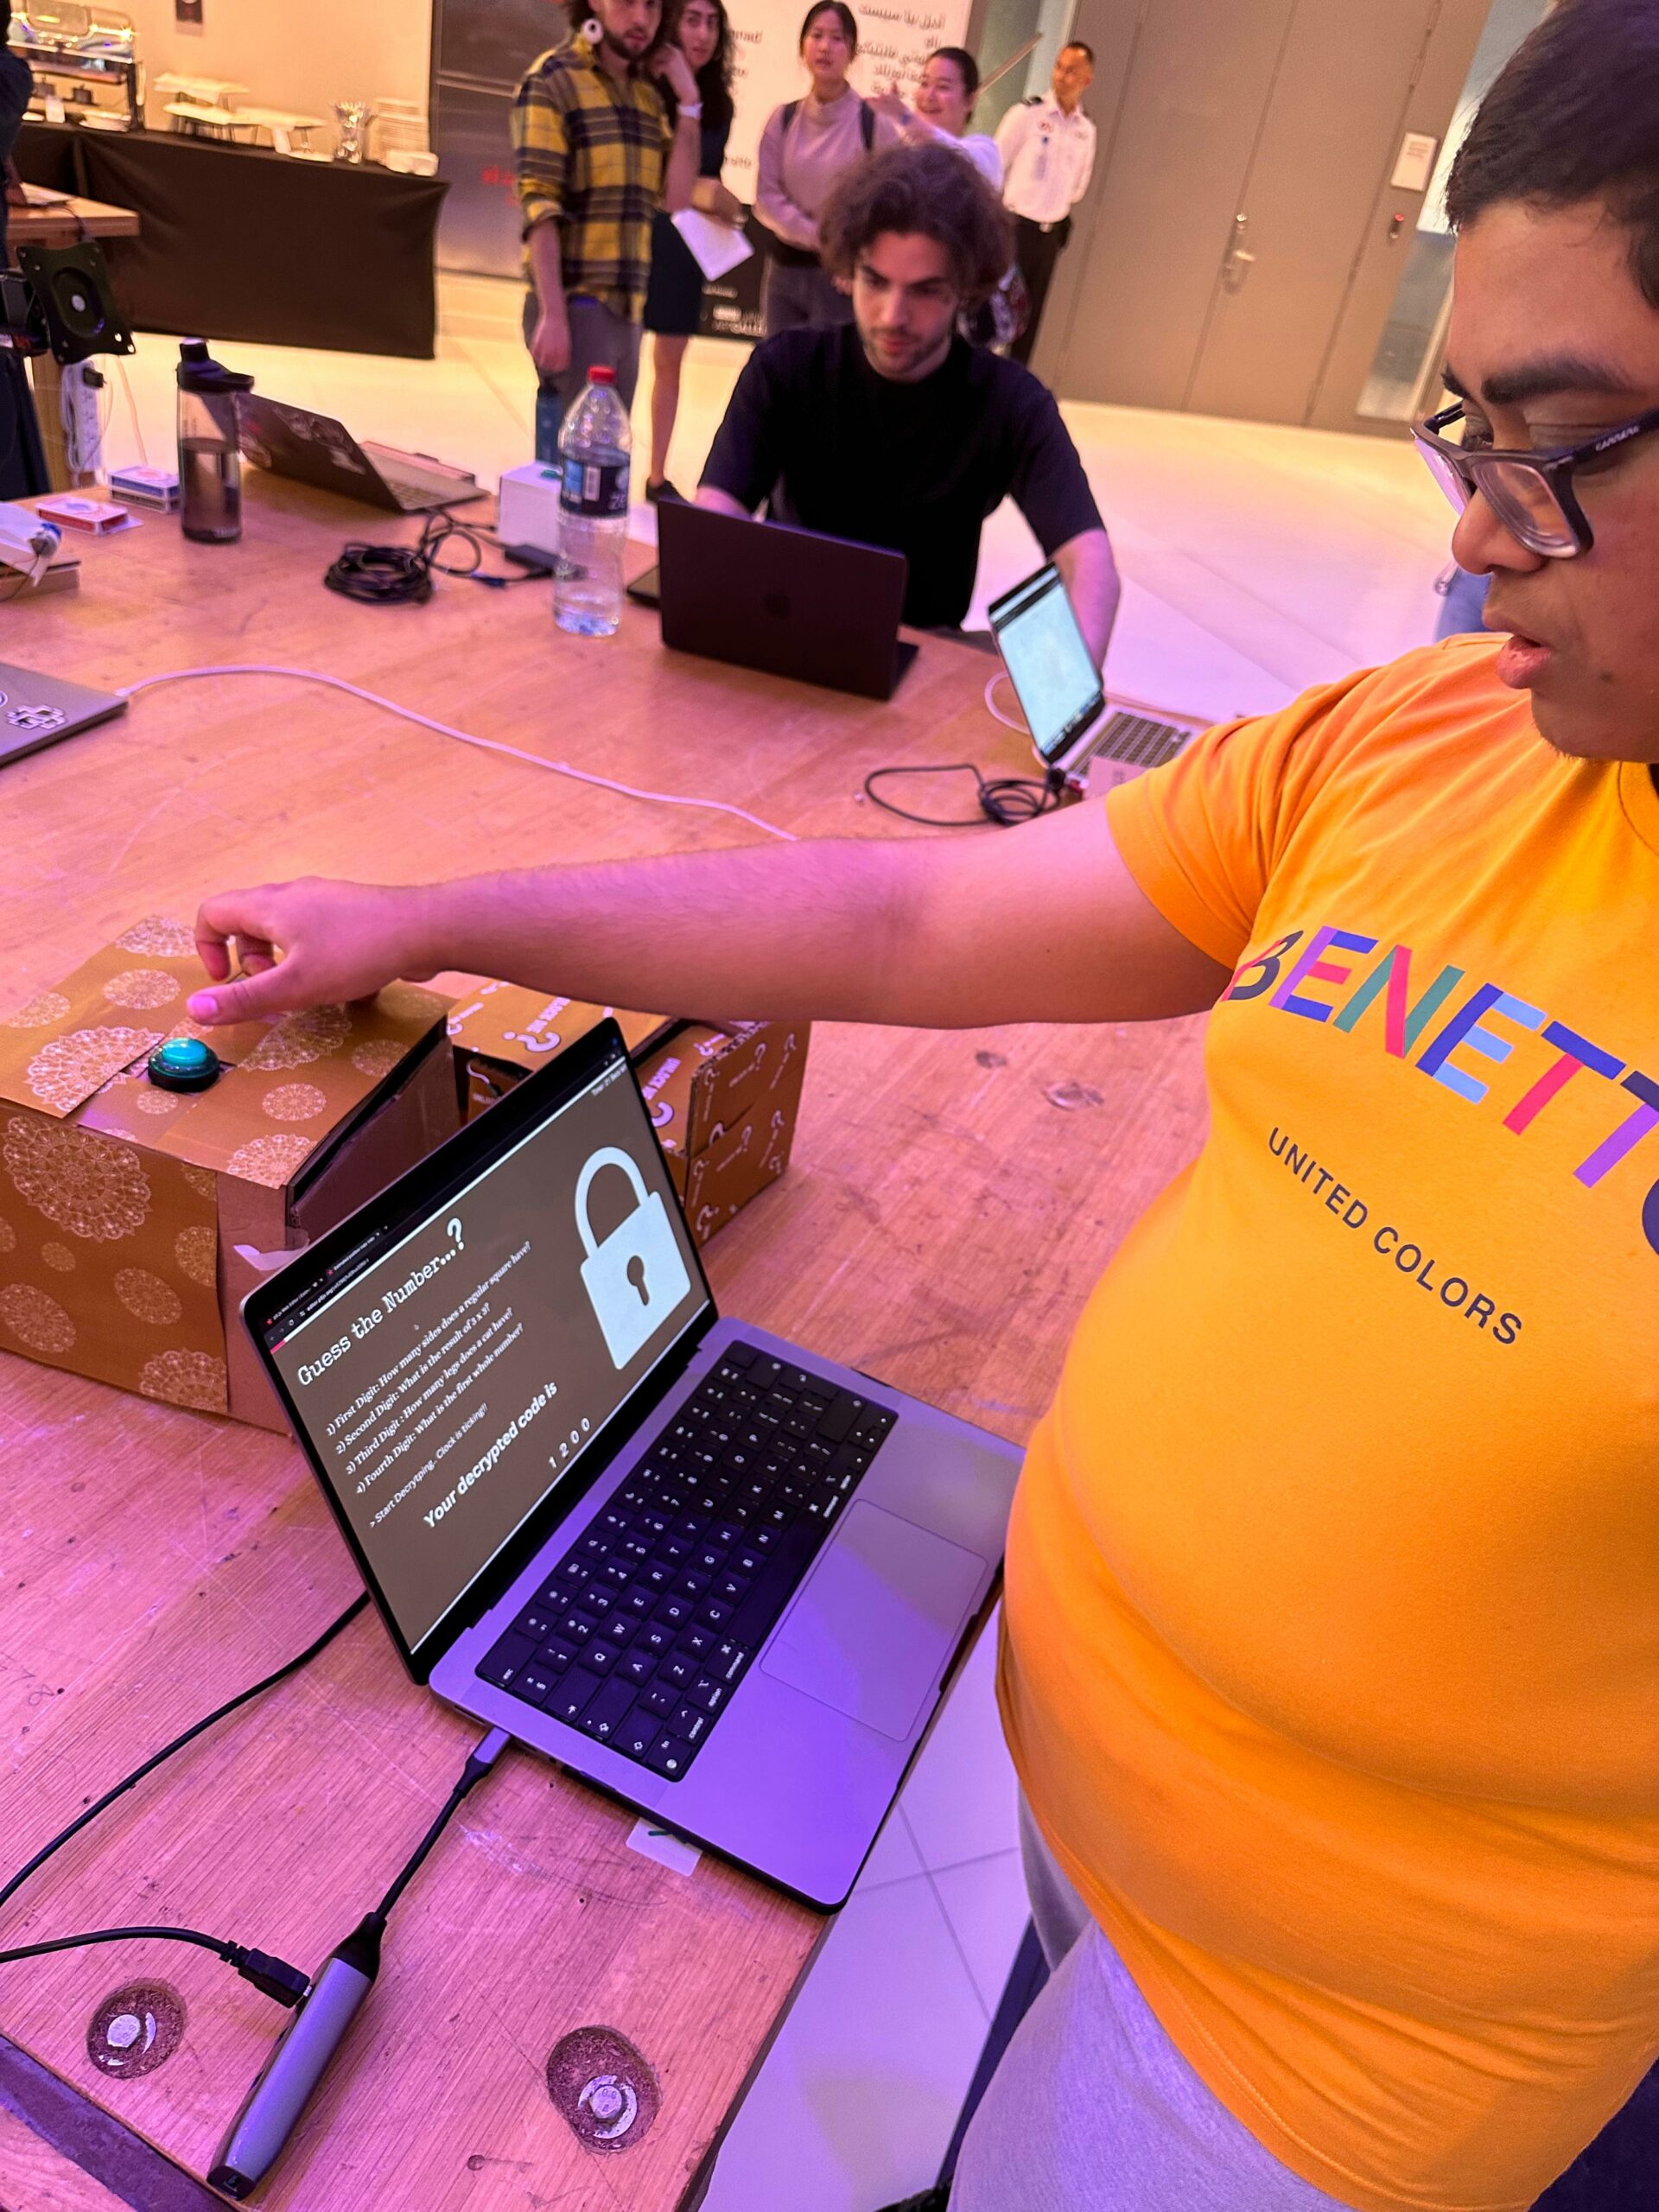
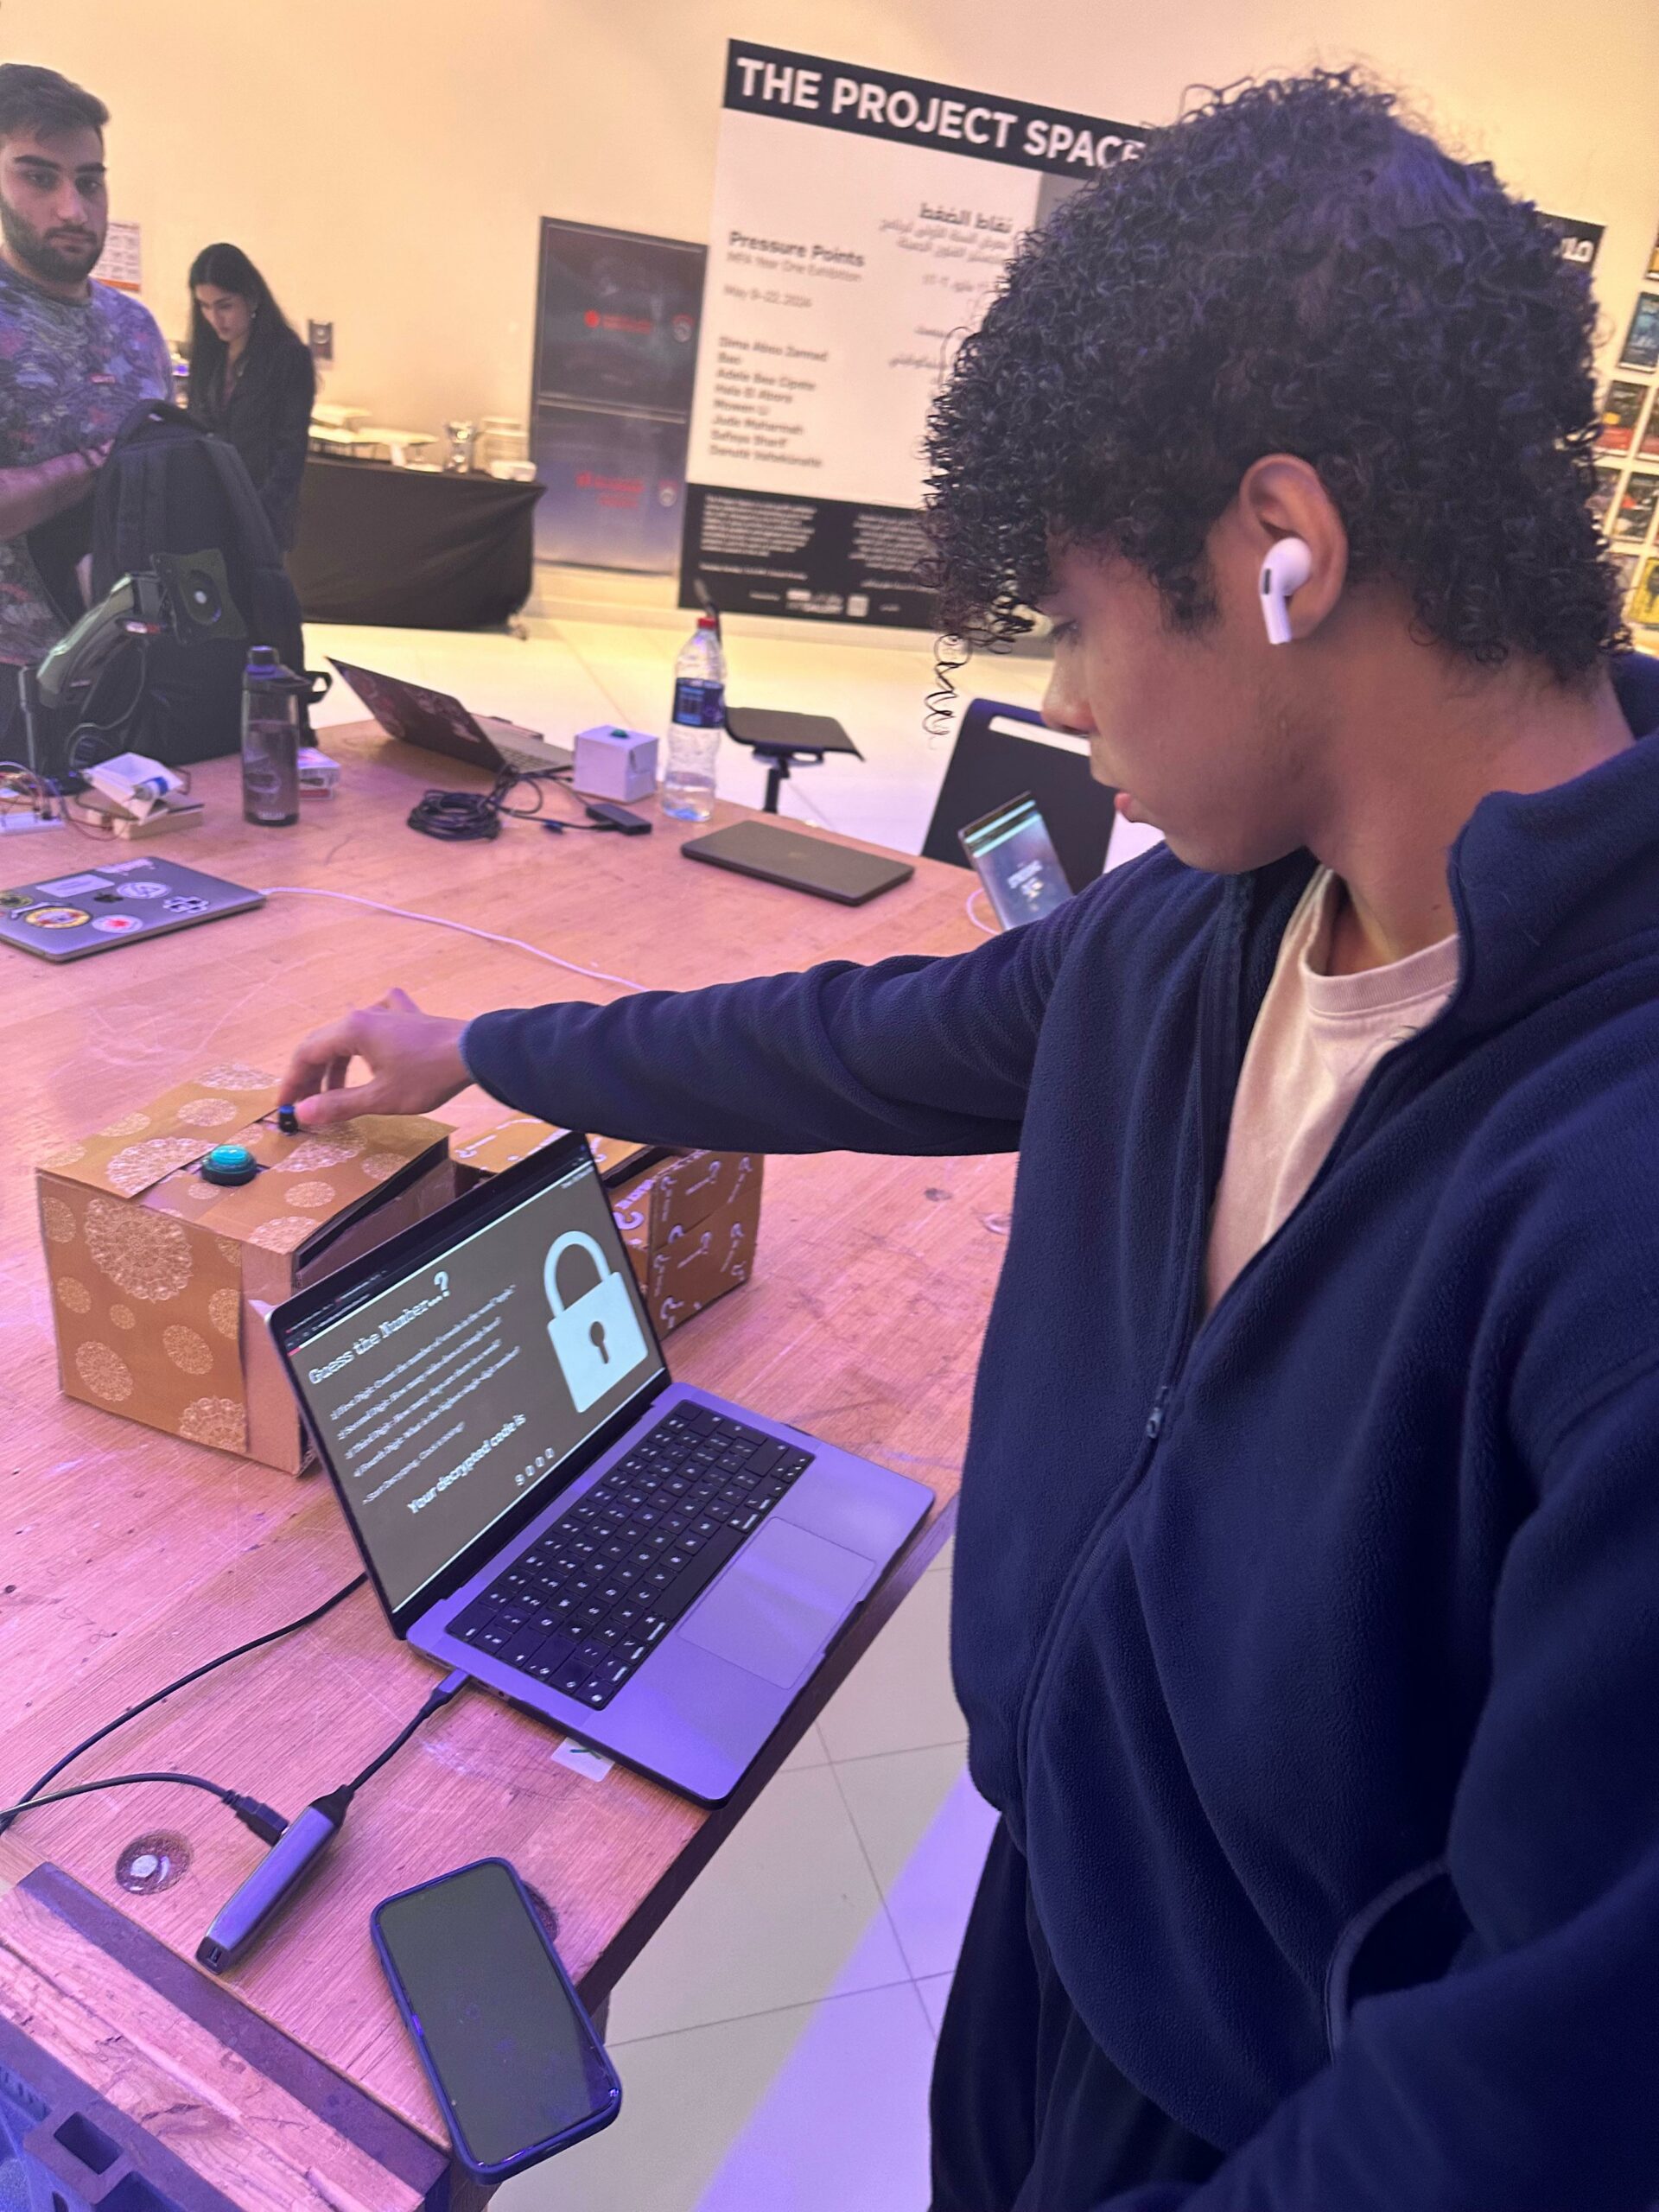
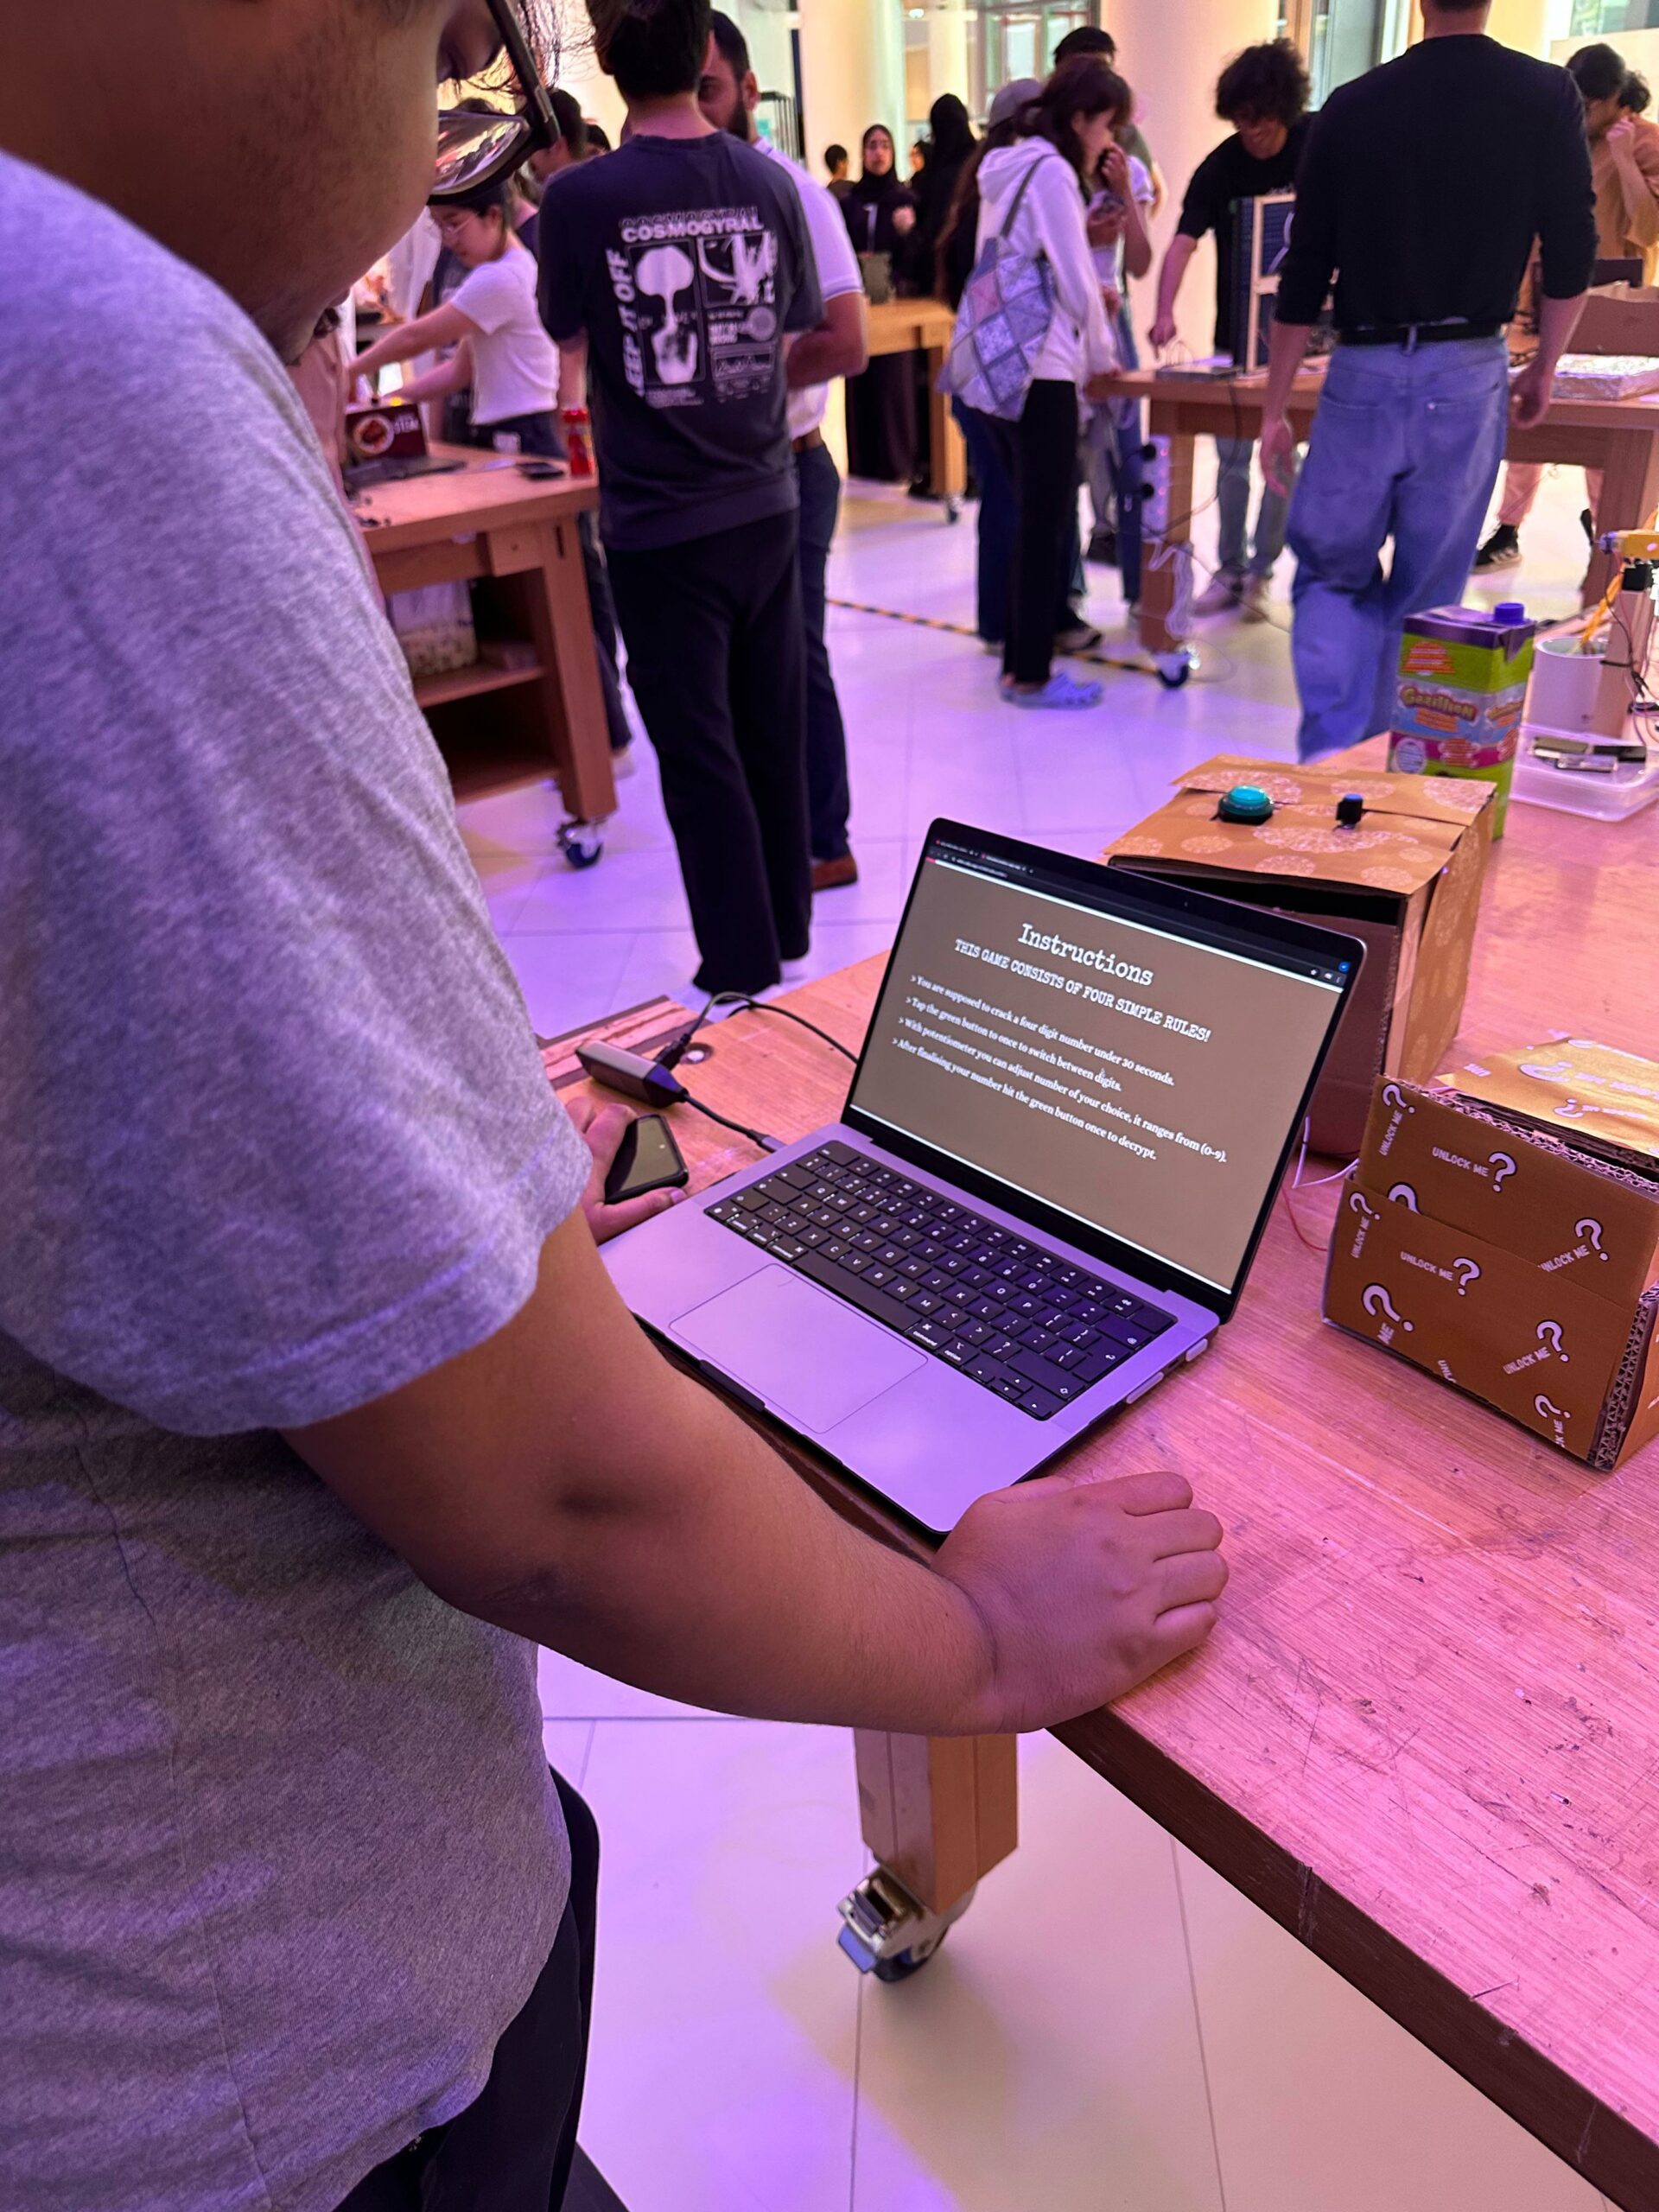
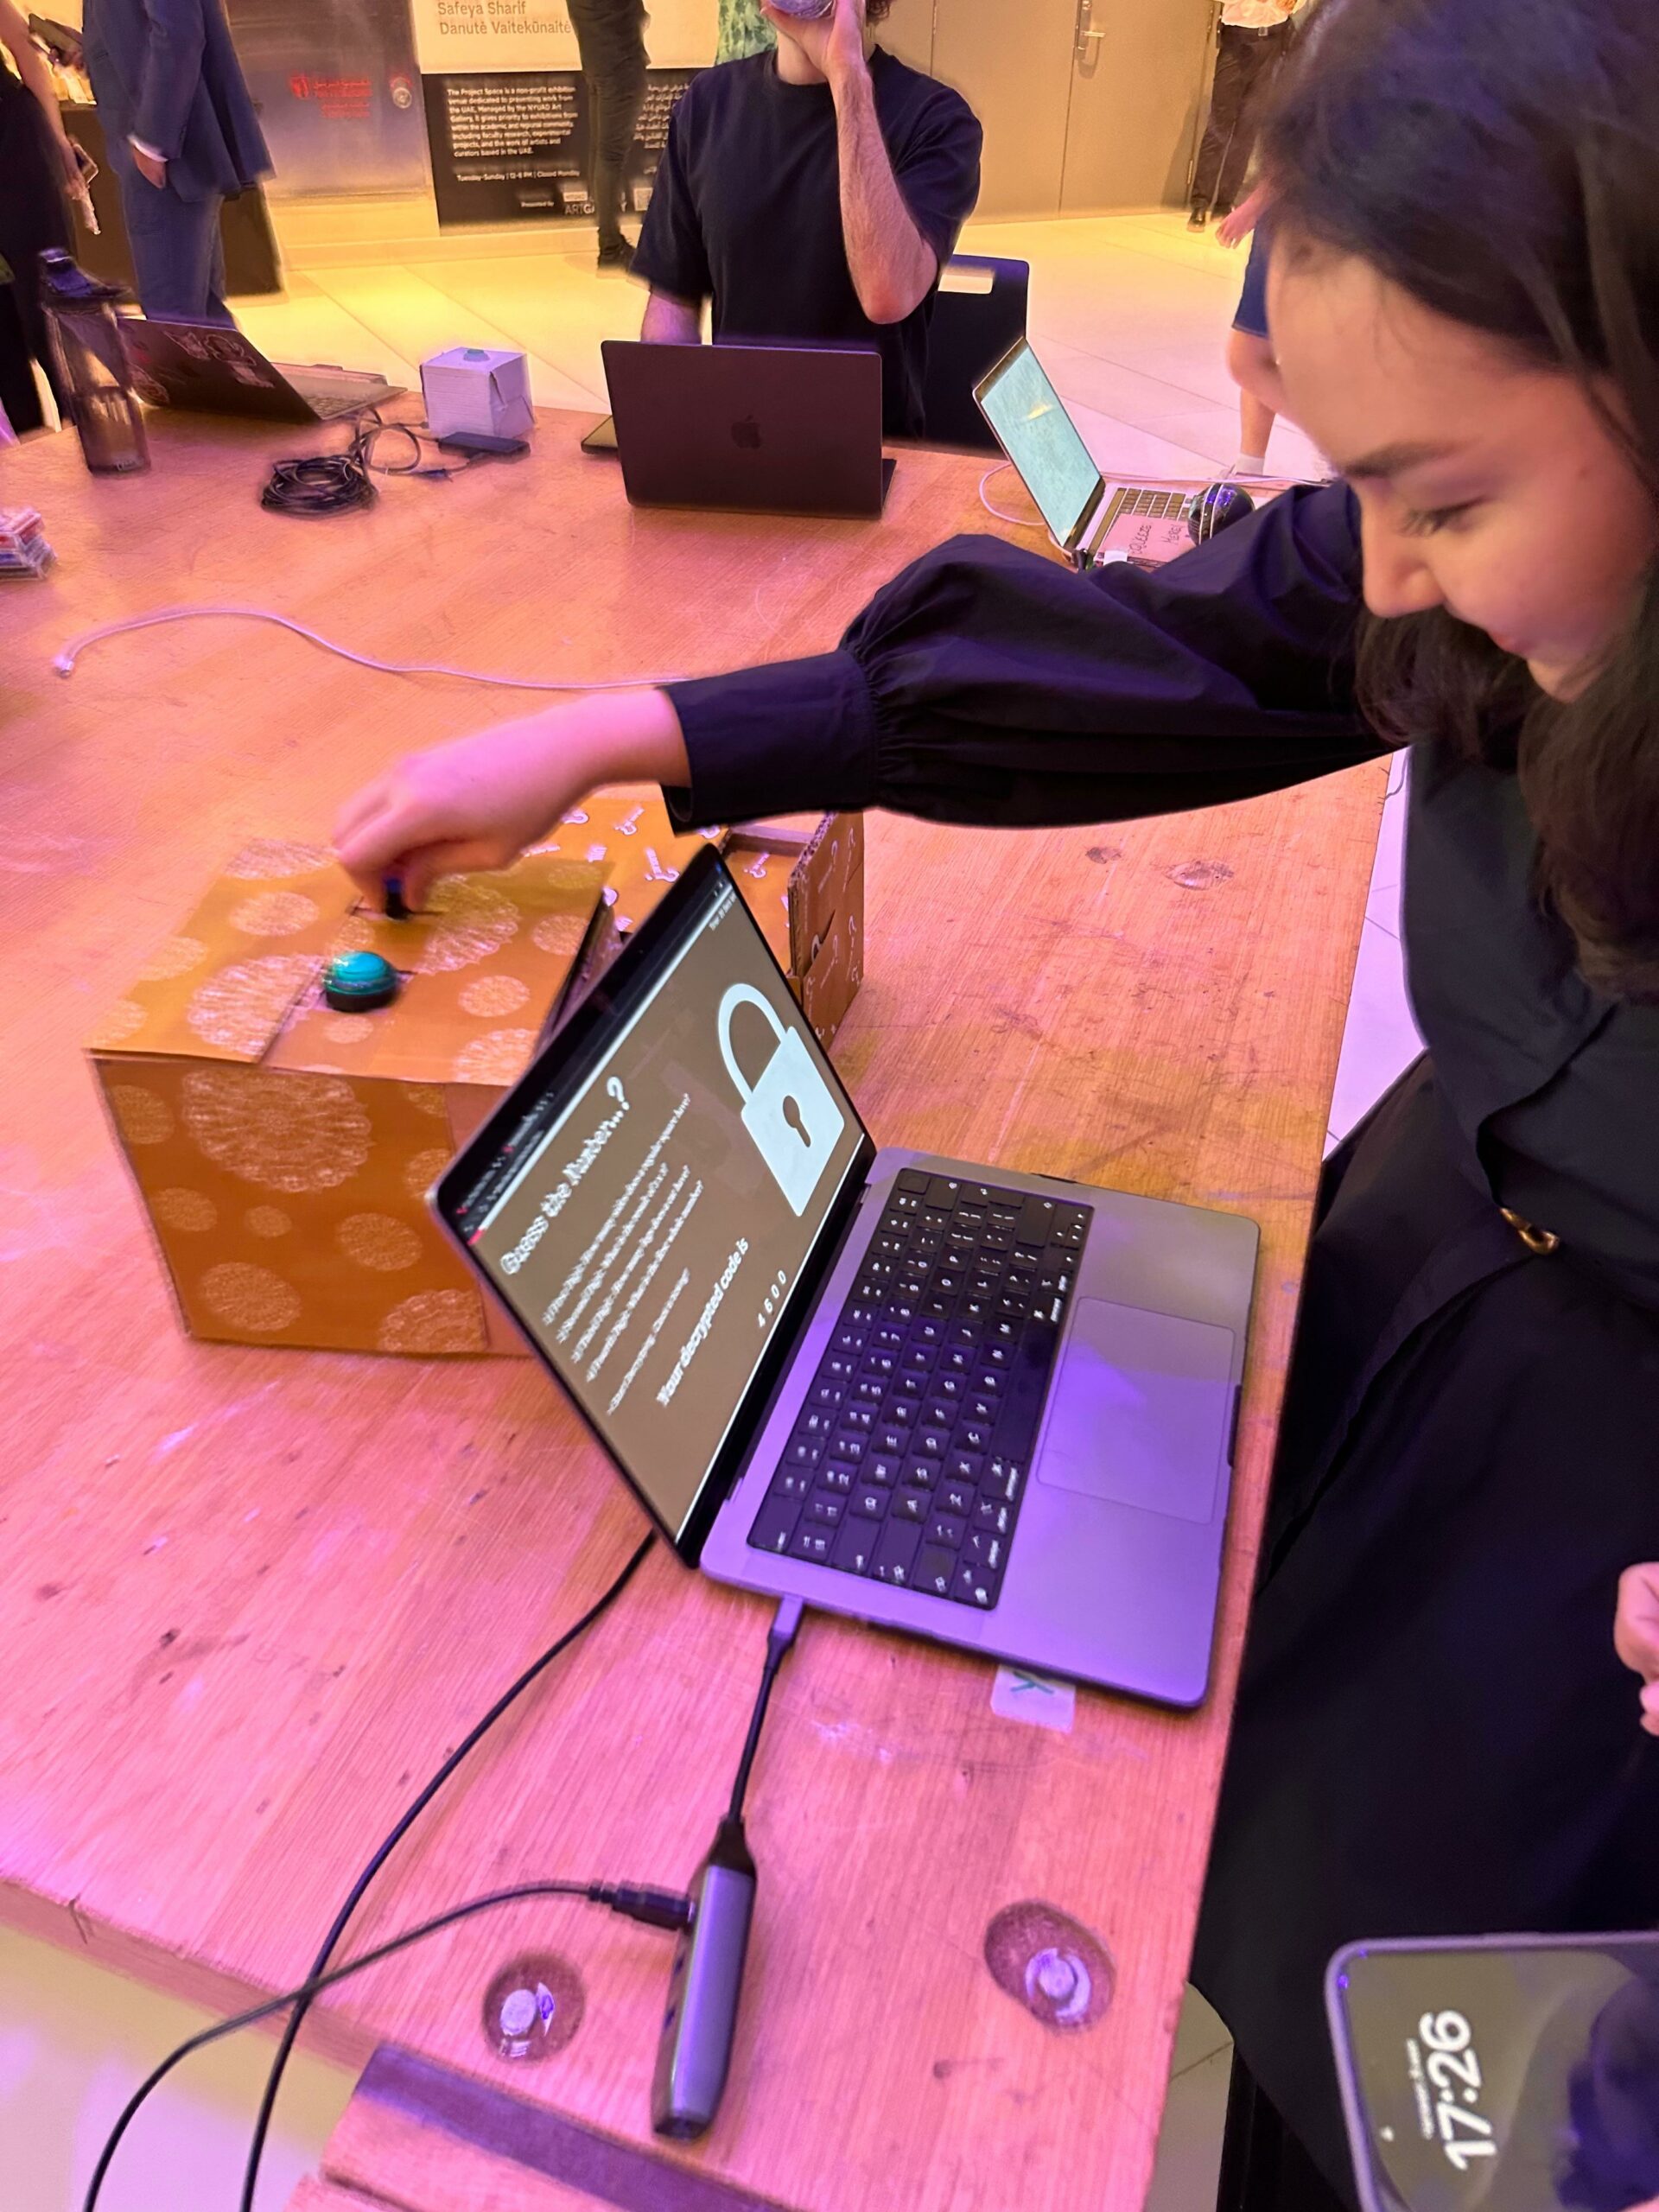
Show-Case:


Example of art that Pulse-Scape can generate:
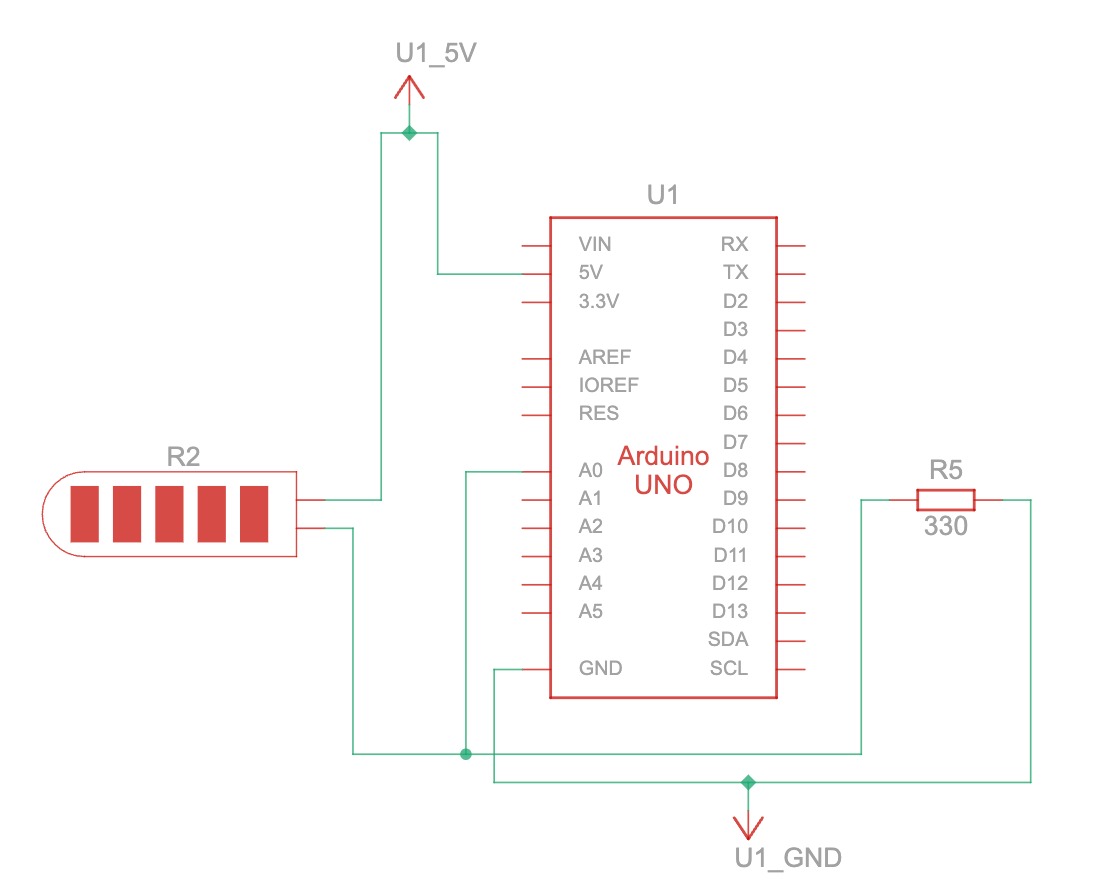
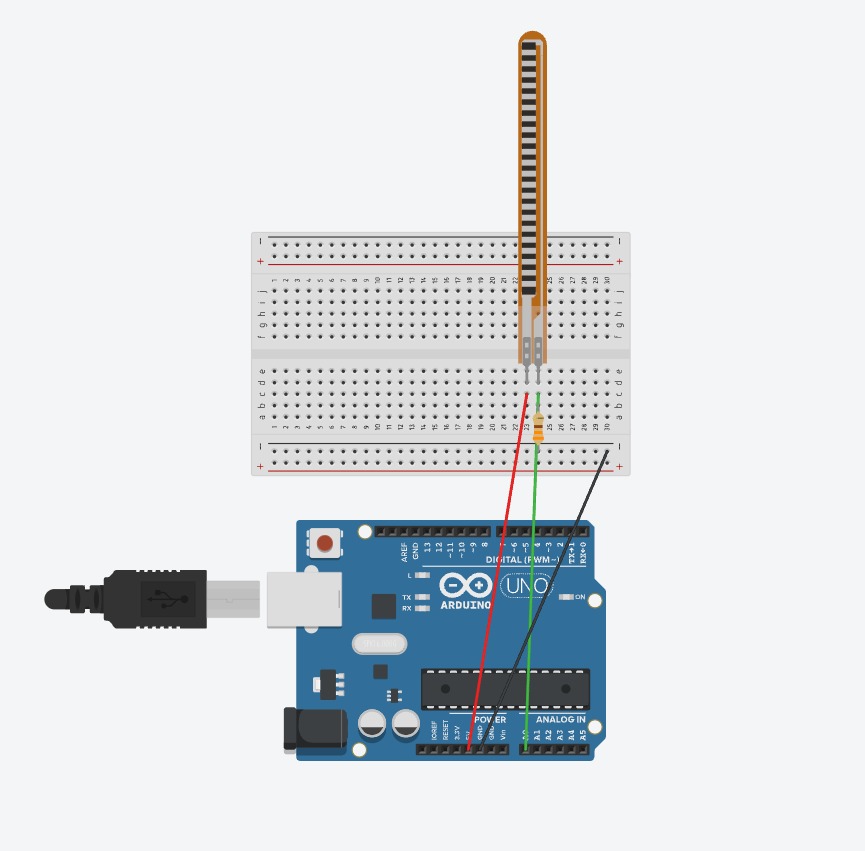
Implementation:

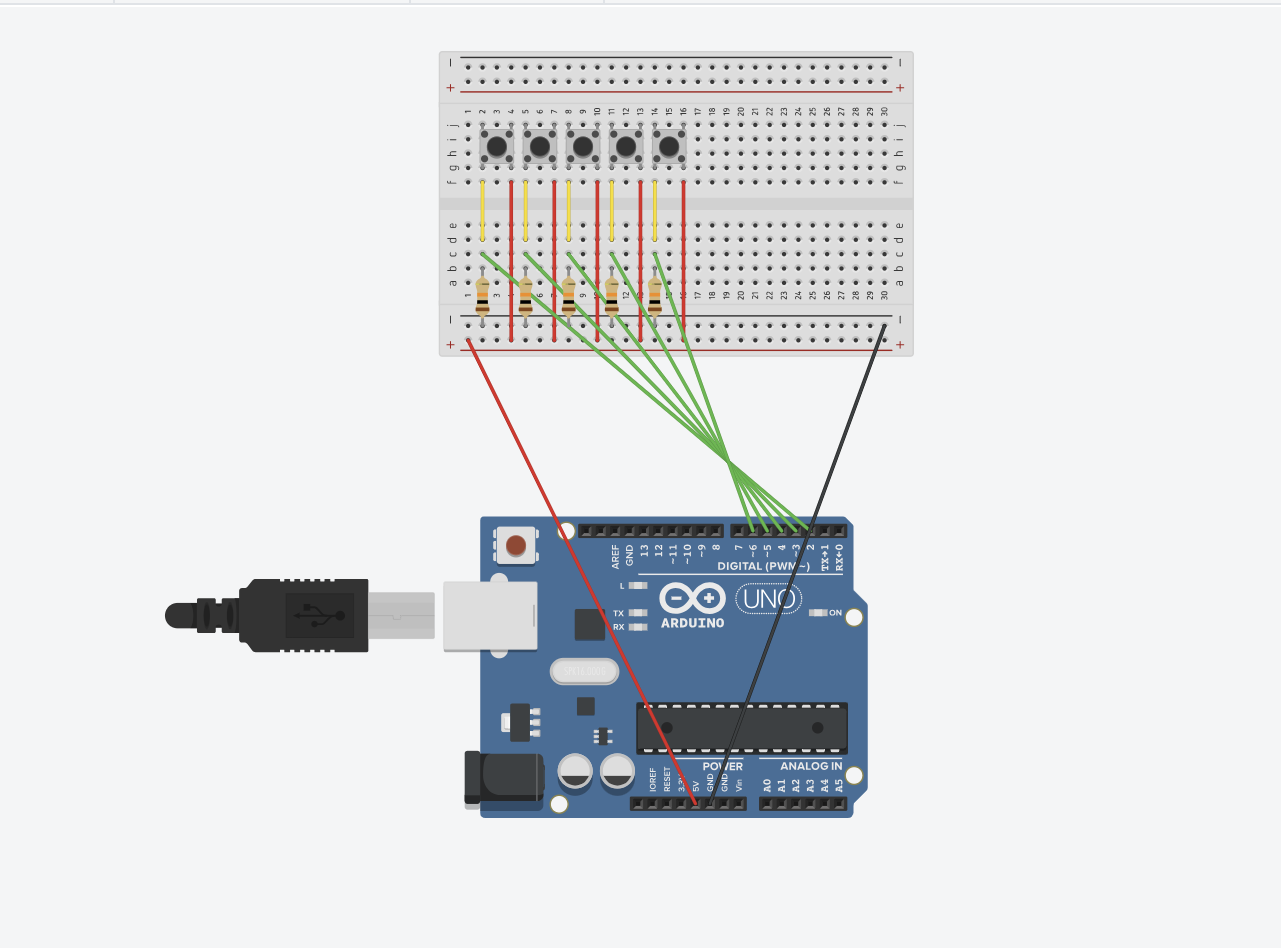
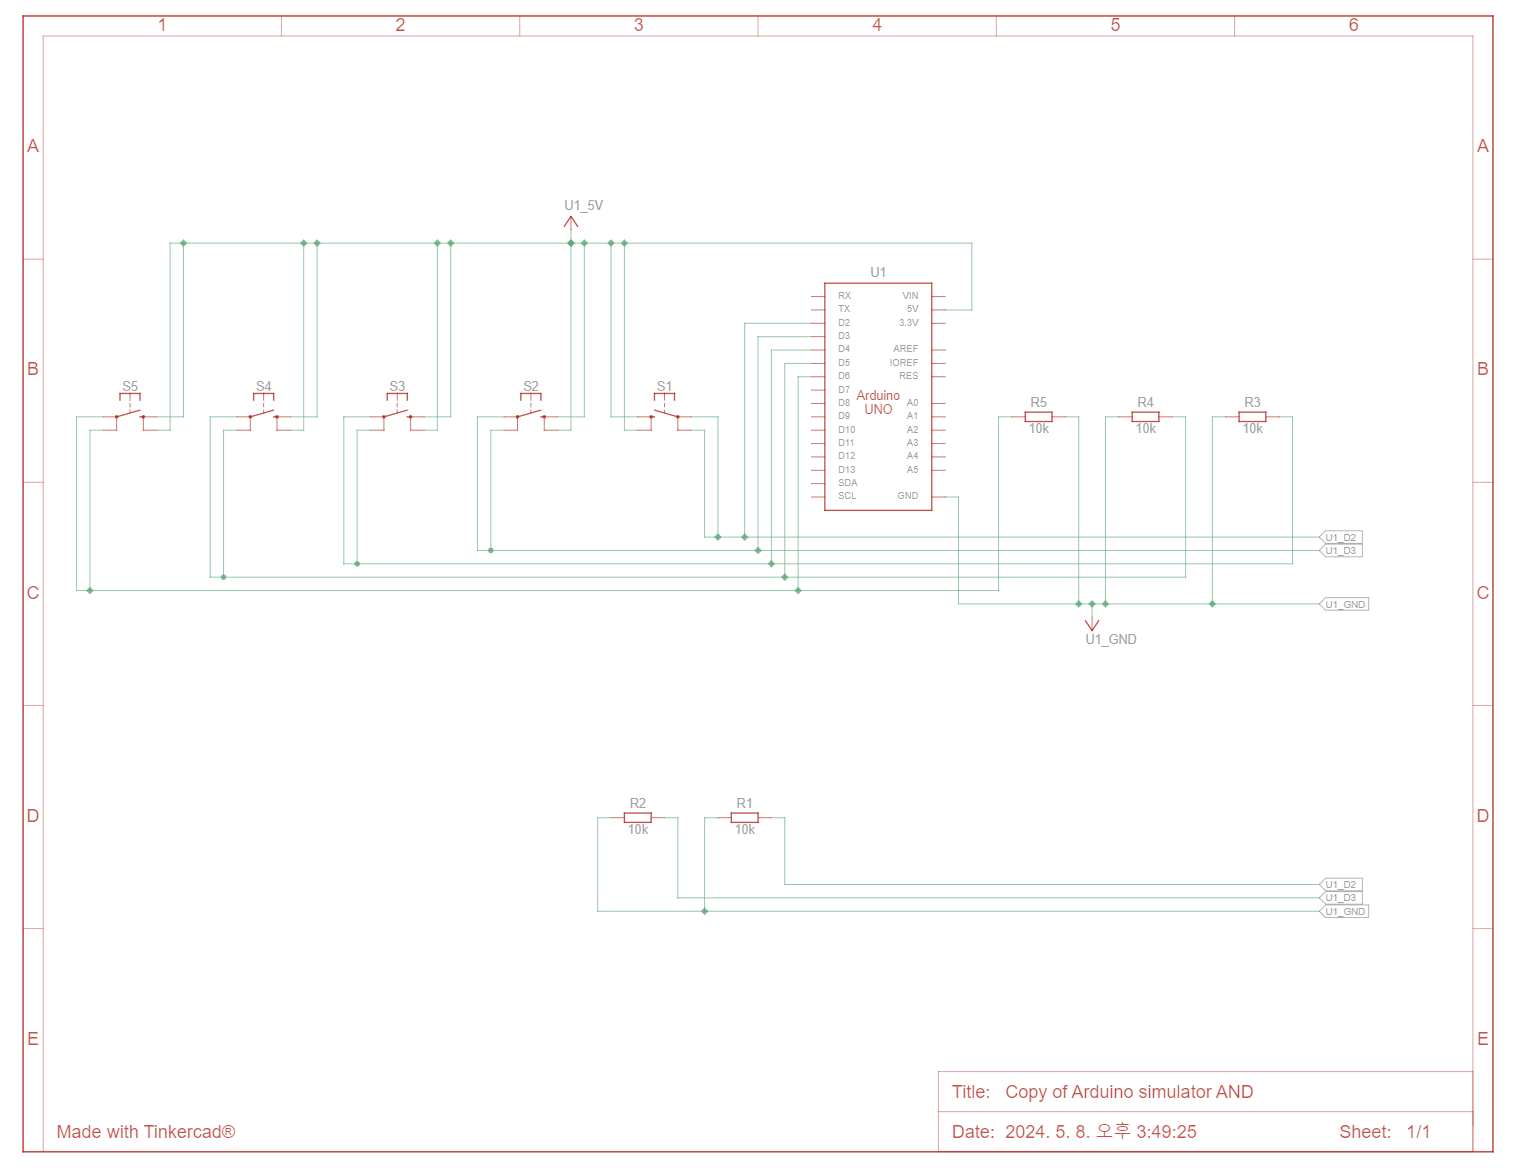
For the project, the main form of interaction design being implemented is pulse detection data from the pulse sensor and the 3 potentiometers that correspond to the R, G, and B values respectively. The potentiometers are responsible for changing the colors of the particles and perlin noise within the circular boundary, helping create a more personalized experience for users. Using data from the pulse sensor, dynamic flow fields appear within a circular boundary, which moves and oscillates based on the value being taken from the pulse sensor. Users can change the style of flow fields, depending on their moods or feelings in the current moment. 

The Arduino component of my final project is mainly responsible for collecting data from the pulse sensor in order to move  it to P5. The first component is for the particles and perlin noise to appear and move based on the data collected from the pulse sensor. The second component is using potentiometers to create a personalized color using specific  amounts of R, G, and B values that users see fit to create a customized and colorful visualization based on pulse sensor data for the users to curate. The Arduino code can be seen below: 

const int pulseSensorPin = A0; //Pulse sensor value connected to A0
const int potPin1 = A1;  // Potentiometer connected to A1
const int potPin2 = A2;  // Potentiometer connected to A2
const int potPin3 = A3;  // Potentiometer connected to A3

// Setup runs once
void setup() {
  Serial.begin(9600);
}

void loop() {
  int pulseSensorValue = analogRead(pulseSensorPin);
  
// Read values from potentiometers and maps it out to the color scale
  int redValue = map(analogRead(potPin1), 0, 1023, 0, 255);
  int greenValue = map(analogRead(potPin2), 0, 1023, 0, 255);
  int blueValue = map(analogRead(potPin3), 0, 1023, 0, 255);


// Send color component values and pulse sensor value to P5
  Serial.print(pulseSensorValue/8);
   Serial.print(',');
  Serial.print(redValue);
  Serial.print(',');
  Serial.print(greenValue);
  Serial.print(',');
  Serial.println(blueValue);

  delay (800);
}


P5, on the other hand, is the main display for my final project. It is where perlin noise and particles are displayed to showcase data from the pulse sensor. It is also in P5 where different modes are available to cater to different style preferences of users in order to personalize their experience. I did this by playing around with the code and multiplying different variables with the pulse sensor value to get different displays. The different styles of art being formulated by the pulse sensor is complimented with the different displays of color within the circle drawn in the center of the canvas. Given the fact that it is the main part of the project and was the part that took me the most time, the aspect of P5 that I am particularly proud of is the display of the particles, which can be found below.

//One of the Three Modes, this is the Flow mode
function mode1(){
 background(245,243,233,5);
  
// Displays pulse sensor value or prompt to select serial port
  if (!serialActive) {
    textStyle(NORMAL);
    strokeWeight(1);
    noStroke();
    textSize(18);
    textFont('Open Sans');
   fill('#727C81');
    text("Press Space Bar to Select Serial Port", windowWidth / 2 + 8 , windowHeight/ 2 + 368); 
  } 
//Display Sensor Value
  else {
    textStyle(NORMAL);
    strokeWeight(1);
    noStroke();
    textSize(18);
    textFont('Open Sans');
    fill('#727C81');
    text('Pulse Sensor Value = ' + str(pulseSensorValue),  windowWidth / 2 + 8 , windowHeight/ 2 + 368); 
  }

//Instruction Header on the Top Left Corner of Canvas
  fill(188, 199, 205);
  rect(-8, 0, 740, 90, 10);
  fill('#727C81');
  textSize(21);
  textStyle(BOLD);
  text('How To:', 65, 35);
  textStyle(NORMAL);
  text('Put the Velcro Band Around Your Thumb and See the Magic Unfold!', 355, 65)
  
// Draws circular boundary for particles to stay within
  stroke('#727C81');
  noFill(); 
  strokeWeight(1);
  ellipse(windowWidth / 2, windowHeight / 2, boundaryRadius * 4); 
  
// Continuously add new particles with random positions within the cirlce
  for (let i = 0; i < 5; i++) {
    particles.push(createVector(random(width), random(height))); 
}
  
// Assigns the current particles to currentParticle variable, this repeats for each particle
  for (let i = particles.length - 1; i >= 0; i--) {
    let currentParticle = particles[i]; 
    
//If pulse sensor value is NOT zero, create flow fields 
  if (pulseSensorValue !== 0) {
    //Calculates perlin noise for the current particles on dispaly
      let perlinNoise = noise(currentParticle.x * noiseScale, currentParticle.y * noiseScale, frameCount * noiseScale); 
    //Maps perlin noise value to angle in order to create some kind of osscilations
      let noiseAngle = TAU * perlinNoise; 
    // Create a movement vector based on Perlin noise angle, scaled by particleSpeed
      let noiseVector = createVector(cos(noiseAngle), sin(noiseAngle)).mult(particleSpeed); 
  // Calculates the center of the canvas for the vectors
      let canvasCenter = createVector(width / 2, height / 2);
  // Calculates the distance between the current particle's postion on the canvas and the center of the canvas
      let distanceToCenter = p5.Vector.dist(currentParticle, canvasCenter); 
  // Creates a vector that points from current particle position to center of the canvas and sets magnitude (length) of vector to 150, which is the boundary radius to effectively scale the vector to be within the circular boundary
      let boundaryVector = p5.Vector.sub(canvasCenter, currentParticle).setMag(boundaryRadius*2); 
 // Move the particle towards the boundary if it's outside, modulate movement with pulse value  
      if (distanceToCenter > boundaryRadius*2) {
        currentParticle.add(boundaryVector.mult(1 + pulseSensorValue)); 
      }
  // Update the position of the current particle by adding the noise-based movement vector
    currentParticle.add(noiseVector); 
  // Remove particles that go off the canvas  
    if (!onCanvas(currentParticle)) {
        particles.splice(i, 1); 
      } 
  //If particles are in the boundary,
    else {
        strokeWeight(2);
        stroke(redValue, greenValue, blueValue); 
      // Draw particle as a point
        point(currentParticle.x, currentParticle.y); 
      }
    }
  }

The main form of communication between Arduino and P5 is unidirectional, meaning that communication comes from only one direction. In my case, data is taken from Arduino and reflected on P5. As mentioned above, the Arduino collects data from both the pulse sensor and 3 potentiometers, which are processed as needed, and then transmitted serially to the computer running P5. This data, once transported  to the computer, P5 receives it, interprets it, and then displays it through particles, oscillations, and perlin noise in the sketch itself. Using this one-way flow of information, the system remains simple but efficient, embodying the concept I initially intended for my final project. 

The aspect of the project that I am particularly proud of is the flow field I created using noise and particles. This is because I had to restudy the presentations and look through youtube videos to understand how to implement the flow fields in the way I envisioned them to be. It was initially quite difficult to implement as I was still a beginner when it came to the technicalities of flow fields, noise, and particles but through practice and trial and error, I was able to overcome this challenge and was able to manipulate the particles and flow fields to be constrained within a circular boundary to create a simple, dynamic, and aesthetically pleasing interface for users to experience. In terms of areas of improvement, I believe that I could have added more interactivity in P5JS to create a more comprehensive interactive experience for users. For example, by adding a feature where particles within the circle will disperse  when users click within the it would add more depth to the interactivity of the experience and make it more engaging for users who are experiencing it. I could have also added some form of wearable device, such as a glove or a bracelet, that the pulse sensor is attached to in order to improve user-experience and better the interactive experience as a whole. This is because it clearly shows users how to navigate the experience with no direct instructions, which is why it creates a more engaging, personal, and interactive experience for users. Reflecting on the process of creating my final project, I am really proud of the outcome and how far I have come with both P5 and Arduino. I am genuinely happy that I was able to create something that combined my interest of bringing out the humanness of human nature, through detecting the heart beat from users’ fingers, and integrating it into a form of technology to create an overall interactive experience for users to engage with. 

I also want to say that I am incredibly proud of everyone and that I am really happy with how far we have all come. Congrats and have a great summer!

With love, Aysha ⋆。°✩


User Testing

Initial Interaction Without Instructions:
– Confusion: Users were initially confused about the purpose of the buttons and how to interact with the games. The lack of clear instructions or visual cues made it difficult for them to understand the mapping between the controls and the on-screen actions.
– Exploration: Despite the confusion, users were curious and began experimenting with the buttons to see what would happen. Through trial and error, some users could figure out the basic controls for movement within the games.

Video:

Challenges:
– Button Mapping: The mapping between the button colors and the directions (especially in the Snake game) seemed arbitrary and non-intuitive to users.Game Selection: The process of navigating the menu and selecting games was not immediately apparent.
– Game Mechanics: Users familiar with Tetris and Snake could grasp the gameplay quickly, but those unfamiliar struggled to understand the objectives and rules.

Positive Aspects:
-Visual Appeal: The flip-dot display was visually engaging and drew users’ attention.
– Physical Controls: Users enjoyed the tactile experience of using physical buttons rather than a touchscreen or keyboard.
– Nostalgia Factor: For users familiar with the classic Atari games, the project evoked a sense of nostalgia and brought back positive memories.

Areas for Improvement:
– Clear Instructions: Provide concise and easy-to-understand instructions on the display or through a separate guide.
– Intuitive Controls: Consider using more intuitive button mapping or providing visual cues on the buttons to indicate their functions. For example, arrows could represent direction in the Snake game.

Areas Requiring Explanation:
– Button Functions: The purpose and mapping of each button needed an explanation, especially for the Snake game, where the color-direction association was not intuitive.
– Menu Navigation: Entering the game menu and selecting games required clarification.
– Game Rules (for unfamiliar users): A brief overview of the basic rules and objectives of Tetris and Snake would be beneficial for users who haven’t played these games before.

Final Project- Emotionally Reactive Room

IM Showcase Gallery:

Concept

For the purposes of the Final Project of Introduction to Interactive Media, I was  presented the challenging task of connecting Software(P5.js) and Hardware(Arduino). To achieve this, I decided to make a room that  promotes sustainability and also reacts to human emotions.

Motivation

The Project was inspired by the words of my roommate who is active member of our campus’s sustainability student interest group.  She constantly urges me to be more mindful of energy usage, especially my tendency to leave lights on unnecessarily. Moreover, she pointed out that I could be more emotionally present. That got me thinking: why not design a room that not only conserves energy but also tunes into human emotions? To achieve this, I incorporated a feature where both the music and lighting adapt to the mood of the person inside, creating an environment that is truly sentient and responsive.

P5.js Part

In the p5.js segment of my project, I began by integrating the camera setup. I utilized ml5.js along with face-api.js for emotion detection. Face-api.js is particularly well-suited for this task due to its ability to analyze specific facial points to ascertain emotions. The library offers a range of emotions including neutral, happy, angry, sad, disgusted, surprised, and fearful. However, for my project’s scope, I’m focusing on neutral, happy, sad, disgusted, and surprised.

I designed the system to handle the analysis for just one individual at a time. Although the camera captures all faces within its view, it processes emotions only for the first face detected. To guide the user, I placed text on the top left of the canvas that displays the detected emotion and its corresponding probability percentage. This not only informs the user about the types of expressions to test but also enhances the interactive aspect of the project.

To make the experience more engaging, I created specific graphics for each emotion using Canva. These graphics dynamically appear and float around the canvas as the detected emotion changes. Additionally, I’ve incorporated adaptive music into the p5.js environment; the music alters based on the detected emotion, thus varying the room’s ambiance to match the user’s current emotional expression. I also added a fullscreen feature that activates when the user presses ‘f’, allowing both the canvas and video to fill the entire screen.

Graphics Used

Happy: Sad: Surprised: Disgusted: Neutral:

Arduino Part

For the Arduino component of my project, I’ve integrated three RGB LEDs and three pressure sensors. Each pressure sensor is linked to a corresponding LED, such that pressing a sensor activates its associated LED.

In p5.js, I am analyzing five expressions and converting the detection results into binary values, represented as either 1 or 0. These values are then transmitted to the Arduino. Based on the received data, if an expression is represented by a ‘1’, the corresponding RGB LED changes its color to match the detected expression.

User Testing:

Hardware and its Pictures:

This prototype of my room features a study table, a bed, and a sofa, each equipped with pressure sensors. Above, there are three LED chandeliers hanging from the ceiling.

How it Works:

Here’s how it works:  Firstly, we initiate serial communication between the Arduino and the p5.js script. The music and camera activate simultaneously with the start of the p5.js sketch. Based on the expressions detected by the camera, the graphics on the display and the music will dynamically change to match your current mood.

When a user presses a pressure sensor on either the bed, chair, or sofa, the RGB LED positioned above that particular sensor will light up. Following this, as your facial expressions change, the color of the LED will also change accordingly: happiness triggers a green light, neutrality a blue light, sadness a red light, disgust a yellow light, and surprise a pink light. This creates a responsive environment that visually and audibly reflects your emotions.

Code:

Here’s the logic for activating the LED based on the sensor value and changing the colour based on the expression detected from the p5.js script.

// Light up the corresponding LED only
if (sensor1Value < 30 ) {
  digitalWrite(redLED1, Sad || disgusted || surprised);
  digitalWrite(greenLED1, Happy || disgusted);
  digitalWrite(blueLED1, Neutral || surprised);
} else if (sensor2Value < 40) {
  digitalWrite(redLED2, Sad || disgusted || surprised);
  digitalWrite(greenLED2, Happy || disgusted);
  digitalWrite(blueLED2, Neutral || surprised);
} else if (sensor3Value < 40) {
  digitalWrite(redLED3, Sad || disgusted || surprised);
  digitalWrite(greenLED3, Happy || disgusted);
  digitalWrite(blueLED3, Neutral || surprised);
}
P5.js Display

Surprised: Disgusted: Happy: Sad: Neutral:

Demonstration:

Part of the Project that I take the most pride in:

The part I’m most proud of is how I mapped the expression values to 0 and 1, based on the percentage of the emotion detected, and then stored them in an array. This simplification made it easier to send binary values to the Arduino. However, figuring out this code took some time, as I initially tried storing emotions and their associated values in a dictionary, which didn’t work.

// maps detected expressions to a set of predefined categories and assigns a binary value based on a threshold

function mapExpressions(expressions) {
    const expressionOrder = ['neutral', 'happy', 'sad', 'disgusted', 'surprised'];
    let expressionValues = [];

    expressionOrder.forEach(expression => {
//       if value deteced is more than 50% make it 1 otherwise 0
        let value = expressions[expression] > 0.5 ? 1 : 0; 
        expressionValues.push(value);
    });

    return expressionValues;
}

Difficulties and Future Improvements:

The most challenging aspect of this project was establishing the serial communication between p5.js and Arduino, which took a solid two days of trial and error. Despite trying numerous approaches, nothing seemed to work until I created a duplicate file, which then functioned flawlessly without errors. Another significant challenge was the coding aspect. Although the code itself was not particularly complex, integrating music and graphics with the face-api was time-consuming, necessitating updates to the HTML file.

Additionally, I encountered difficulties with the pressure sensors. Initially, I used piezo sensors, but they produced inconsistent readings. I switched to force sensors which provided more reliable results, although they required recalibration every five minutes, adding another layer of complexity to the project. I wrote two additional Arduino scripts to calibrate the sensors, which allowed me to run the serial monitor and check the pressure sensor values.

For future improvements, I would consider investing in better pressure sensors. Additionally, instead of relying on my computer’s speakers, I’d like to integrate an external speaker directly connected to the Arduino. This setup would enhance the overall functionality and user experience.

Code:

P5.js:
// Initializing varialbes and arrays

let faceapi;
let detections = [];
let expressionValues=[];
let video;
let canvas;
let happyEmojis=[];
let vx;
let vy;
let songs = [];
let currentSongIndex = -1; 

// loading grpahics and music

function preload() {
  
    happyEmojis[0]= loadImage('1.png'); 
    happyEmojis[1] = loadImage('2.png'); 
    happyEmojis[2] = loadImage('3.png'); 
    happyEmojis[3] = loadImage('4.png'); 
    happyEmojis[4]= loadImage('5.png'); 
    happyEmojis[5] = loadImage('6.png'); 
    happyEmojis[6] = loadImage('7.png'); 
    happyEmojis[7] = loadImage('8.png'); 
    happyEmojis[8]= loadImage('9.png'); 
    happyEmojis[9] = loadImage('10.png'); 
    happyEmojis[10] = loadImage('11.png'); 
    happyEmojis[11] = loadImage('12.png'); 
    happyEmojis[12]= loadImage('13.png'); 
    happyEmojis[13] = loadImage('14.png'); 
    happyEmojis[14] = loadImage('15.png'); 
    happyEmojis[15] = loadImage('16.png'); 
    happyEmojis[16]= loadImage('17.png'); 
    happyEmojis[17] = loadImage('18.png'); 
    happyEmojis[18] = loadImage('19.png'); 
    happyEmojis[19] = loadImage('20.png'); 
    happyEmojis[20] = loadImage('21.png'); 
    happyEmojis[21] = loadImage('22.png'); 
    happyEmojis[22] = loadImage('23.png'); 
  
    songs[0] = loadSound('song1.mp3');
    songs[1] = loadSound('song2.mp3');
    songs[2] = loadSound('song3.mp3');
    songs[3] = loadSound('song4.mp3');
    songs[4] = loadSound('song5.mp3');
}

// Setting up the canvas and video settings
function setup() {
    canvas = createCanvas(windowWidth, windowHeight);
    canvas.id('canvas');
    video = createCapture(VIDEO);
    video.size(windowWidth, windowHeight);
    video.id('video');
  
//   initializes the face detection
  const faceOptions = {
    withLandmarks: true,
    withExpressions: true,
    withDescriptors: true,
    minConfidence: 0.5
  };

  //initialize the model: 
  faceapi = ml5.faceApi(video, faceOptions, faceReady);
  
  image1 = new Emoji(happyEmojis[0],random(0,width-250),0,1,1);
  image2 = new Emoji(happyEmojis[1],random(0,width-250),0,0.5,1);
  image3 = new Emoji(happyEmojis[2],random(0,width-250),0,0.5,1);
  image4 = new Emoji(happyEmojis[3],random(0,width-250),0,1,1.5);
  image5 = new Emoji(happyEmojis[4],random(0,width-250),0,1,0.5);
  image6 = new Emoji(happyEmojis[5],random(0,width-250),0,1,1);
  image7 = new Emoji(happyEmojis[6],random(0,width-250),0,1,1.5);
  image8 = new Emoji(happyEmojis[7],random(0,width-250),0,1,0.5);
  image9 = new Emoji(happyEmojis[8],random(0,width-250),0,2,1);
  image10 = new Emoji(happyEmojis[9],random(0,width-250),0,1,1.5);
  image11 = new Emoji(happyEmojis[10],random(0,width-250),0,1,0.5);
  image12 = new Emoji(happyEmojis[11],random(0,width-250),0,1,1.5);
  image13 = new Emoji(happyEmojis[12],random(0,width-250),0,2,1);
  image14= new Emoji(happyEmojis[13],random(0,width-250),0,1,2);
  image15= new Emoji(happyEmojis[14],random(0,width-250),0,1,1.5);
  image16= new Emoji(happyEmojis[15],random(0,width-250),0,1,1.5);
  image17 = new Emoji(happyEmojis[16],random(0,width-250),0,1,1);
  image18 = new Emoji(happyEmojis[17],random(0,width-250),0,1,1);
  image19 = new Emoji(happyEmojis[18],random(0,width-250),0,1,1.5);
  image20 = new Emoji(happyEmojis[19],random(0,width-250),0,1,0.5);
  image21 = new Emoji(happyEmojis[20],random(0,width-250),0,1,1.5);
  image22 = new Emoji(happyEmojis[21],random(0,width-250),0,1,0.5);
  image23 = new Emoji(happyEmojis[22],random(0,width-250),0,1,0.5);
}

// adjust canvas and video size when window is resized
function windowResized() {
    
    resizeCanvas(windowWidth, windowHeight);
    video.size(windowWidth, windowHeight);
}


function draw(){

  clear();
//   drawaing expressios and drawing graphics on the screen based on the detected emotion
  drawExpressions(detections, 20, 20, 14);
  if (expressionValues.length > 1 && expressionValues[1] === 1) { // 
    image1.display();
    image1.update();
    image2.display();
    image2.update();
    image3.display();
    image3.update();
    image4.display();
    image4.update();
    image5.display();
    image5.update();
    
  
  }
  if (expressionValues.length > 1 && expressionValues[4] === 1) { // 
    image11.display();
    image11.update();
    image12.display();
    image12.update();
    image13.display();
    image13.update();
    image14.display();
    image14.update();
    
  
  }
  if (expressionValues.length > 1 && expressionValues[3] === 1) { // 
    image15.display();
    image15.update();
    image16.display();
    image16.update();
    image17.display();
    image17.update();
    image18.display();
    image18.update();
    image23.display();
    image23.update();
    // playSong(2);
  }
  if (expressionValues.length > 1 && expressionValues[2] === 1) { // 
    image7.display();
    image7.update();
    image8.display();
    image8.update();
    image9.display();
    image9.update();
    image10.display();
    image10.update();
    
  }
  if (expressionValues.length > 1 && expressionValues[0] === 1) { // 
    image6.display();
    image6.update();
    image19.display();
    image19.update();
    image20.display();
    image20.update();
    image21.display();
    image21.update();
    image22.display();
    image22.update();
    
  }

//   playingn songs based on the emotion detected
  if (expressionValues.length > 1 && expressionValues[1] === 1) {
    
    playSong(3);
  } else if (expressionValues.length > 1 && expressionValues[4] === 1) {
    // play song 1
    playSong(0);
  } else if (expressionValues.length > 1 && expressionValues[3] === 1) {
    // play song 2
    playSong(1);
  } else if (expressionValues.length > 1 && expressionValues[2] === 1) {
    // play song 3
    playSong(2);
  } else if (expressionValues.length > 1 && expressionValues[0] === 1) {
    // play song 4
    playSong(4);
  }
  
}

function playSong(index) {
  //stop any currently playing song
  for (let i = 0; i < songs.length; i++) {
    if (i !== index && songs[i].isPlaying()) {
      songs[i].stop();
    }
  }

  // play the selected song
  if (!songs[index].isPlaying()) {
    songs[index].play();
  }
}

// class to handle the grpahics
class Emoji {
    constructor(img,x,y,vx, vy) {
        this.img = img;
        this.x = x;
      this.y = y;
        this.vx = vx;
        this.vy = vy;
    }
    
    update() {
        this.x += this.vx;
        this.y += this.vy;
        // check for canvas boundaries
        if (this.x < -130 || this.x > width -200) this.vx *= -1;
        if (this.y < -110 || this.y > height -150) this.vy *= -1;
    }
// display the graphics
    display() {
        image(this.img, this.x, this.y, 500, 500);
    }
}

function keyTyped() {
  // $$$ For some reason on Chrome/Mac you may have to press f twice to toggle. Works correctly on Firefox/Mac
  if (key === 'f') {
    toggleFullscreen();
  }
}

// Toggle fullscreen state. Must be called in response
// to a user event (i.e. keyboard, mouse click)
function toggleFullscreen() {
  let fs = fullscreen(); // Get the current state
  fullscreen(!fs); // Flip it!
}

// Start detecting faces
function faceReady() {
  faceapi.detect(gotFaces);
}

// Got faces
function gotFaces(error, result) {
  if (error) {
    console.log(error);
    return;
  }
//now all the data in this detections
  detections = result; 
  
//make back ground transparent
  clear();
  

  storeExpressions(detections); 
  faceapi.detect(gotFaces);
}

// maps detected expressions to a set of predefined categories and assigns a binary value based on a threshold

function mapExpressions(expressions) {
    const expressionOrder = ['neutral', 'happy', 'sad', 'disgusted', 'surprised'];
    let expressionValues = [];

    expressionOrder.forEach(expression => {
//       if value deteced is more than 50% make it 1 otherwise 0
        let value = expressions[expression] > 0.5 ? 1 : 0; 
        expressionValues.push(value);
    });

    return expressionValues;
}

// store expressions 
function storeExpressions(detections) {
    if (detections.length > 0) {
//   for the first person in the list, map expressions
        let expressions = detections[0].expressions;
        expressionValues = mapExpressions(expressions);
        // console.log(expressionValues);

        
    }
}

// it draws the percentage of detected emotion on the left top corner of the canvas
function drawExpressions(detections, x, y, textYSpace){
  if(detections.length > 0){
    
    let {neutral, happy, angry, sad, disgusted, surprised, fearful} = detections[0].expressions;
    textFont('Helvetica Neue');
    textSize(14);
    noStroke();
    fill(44, 169, 225);
// uses nf(value, left, right) to format numbers
    text("Neutral:       " + nf(neutral*100, 2, 2)+"%", x, y);
    text("Happiness: " + nf(happy*100, 2, 2)+"%", x, y+textYSpace);
    text("Sad:            "+ nf(sad*100, 2, 2)+"%", x, y+textYSpace*2);
    text("Disgusted: " + nf(disgusted*100, 2, 2)+"%", x, y+textYSpace*3);
    text("Surprised:  " + nf(surprised*100, 2, 2)+"%", x, y+textYSpace*4);
  
  }else{
    text("Neutral: ", x, y);
    text("Happiness: ", x, y + textYSpace);
    text("Sad: ", x, y + textYSpace*2);
    text("Disgusted: ", x, y + textYSpace*3);
    text("Surprised: ", x, y + textYSpace*4);
  }
}

function keyPressed() {
  if (key == " ") {
    // important to have in order to start the serial connection!!
    setUpSerial();
  }
}

// This function will be called by the web-serial library
// with each new *line* of data. The serial library reads
// the data until the newline and then gives it to us through
// this callback function
function readSerial(data) {
  ////////////////////////////////////
  //READ FROM ARDUINO HERE
  ////////////////////////////////////
  console.log(expressionValues);
  if (data != null) {
    

    //////////////////////////////////
    //SEND TO ARDUINO HERE (handshake)
    //////////////////////////////////
    let sendToArduino = expressionValues[0] + "," + expressionValues[1] + "," + expressionValues[2] + ","  + expressionValues[3] + ","  + expressionValues[4] + "\n";
    writeSerial(sendToArduino);
  }
}
Arduino:
// Define LED pin constants
int redLED1 = 12;   // First RGB LED, red pin
int greenLED1 = 11; // First RGB LED, green pin
int blueLED1 = 10;  // First RGB LED, blue pin

int redLED2 = 9;    // Second RGB LED, red pin
int greenLED2 = 8;  // Second RGB LED, green pin
int blueLED2 = 7;   // Second RGB LED, blue pin

int redLED3 = 6;    // Third RGB LED, red pin
int greenLED3 = 5;  // Third RGB LED, green pin
int blueLED3 = 4;   // Third RGB LED, blue pin

// Define sensor pin constants
int sensor1 = A2;  // First sensor
int sensor2 = A3;  // Second sensor
int sensor3 = A4;  // Third sensor

void setup() {
  Serial.begin(9600);
  pinMode(LED_BUILTIN, OUTPUT);

  // Set LED pins to output mode
  pinMode(redLED1, OUTPUT);
  pinMode(greenLED1, OUTPUT);
  pinMode(blueLED1, OUTPUT);

  pinMode(redLED2, OUTPUT);
  pinMode(greenLED2, OUTPUT);
  pinMode(blueLED2, OUTPUT);

  pinMode(redLED3, OUTPUT);
  pinMode(greenLED3, OUTPUT);
  pinMode(blueLED3, OUTPUT);

  // Start the handshake
  while (Serial.available() <= 0) {
    digitalWrite(LED_BUILTIN, HIGH); // on/blink while waiting for serial data
    Serial.println("0,0"); // send a starting message
    delay(300);            // wait 1/3 second
    digitalWrite(LED_BUILTIN, LOW);
    delay(50);
  }
}

void loop() {
  while (Serial.available()) {
    digitalWrite(LED_BUILTIN, HIGH); // LED on while receiving data
    int sensor1Value = analogRead(sensor1);  // Read first sensor
    int sensor2Value = analogRead(sensor2);  // Read second sensor
    int sensor3Value = analogRead(sensor3);  // Read third sensor

    int Neutral = Serial.parseInt();
    int Happy = Serial.parseInt();
    int Sad = Serial.parseInt();
    int disgusted = Serial.parseInt();
    int surprised = Serial.parseInt();

    if (Serial.read() == '\n') {
      // Reset all LEDs
      digitalWrite(redLED1, LOW);
      digitalWrite(greenLED1, LOW);
      digitalWrite(blueLED1, LOW);
      digitalWrite(redLED2, LOW);
      digitalWrite(greenLED2, LOW);
      digitalWrite(blueLED2, LOW);
      digitalWrite(redLED3, LOW);
      digitalWrite(greenLED3, LOW);
      digitalWrite(blueLED3, LOW);

      // Light up the corresponding LED only
      if (sensor1Value < 30 ) {
        digitalWrite(redLED1, Sad || disgusted || surprised);
        digitalWrite(greenLED1, Happy || disgusted);
        digitalWrite(blueLED1, Neutral || surprised);
      } else if (sensor2Value < 40) {
        digitalWrite(redLED2, Sad || disgusted || surprised);
        digitalWrite(greenLED2, Happy || disgusted);
        digitalWrite(blueLED2, Neutral || surprised);
      } else if (sensor3Value < 40) {
        digitalWrite(redLED3, Sad || disgusted || surprised);
        digitalWrite(greenLED3, Happy || disgusted);
        digitalWrite(blueLED3, Neutral || surprised);
      }

      Serial.print(sensor1Value < 30);
      Serial.print(',');
      Serial.print(sensor2Value < 40);
      Serial.print(',');
      Serial.println(sensor3Value < 40);
    }
  }
  // Optional: Use built-in LED to indicate the system is running
  digitalWrite(LED_BUILTIN, HIGH);
  delay(50);
  digitalWrite(LED_BUILTIN, LOW);
  delay(300);
}


Final Project – “Interactive NYUAD Campus Explorer”

Concept

Since my midterm project was related to our campus, I wanted to work on something similar for the final project. I came up with the idea to create an interactive NYUAD campus explorer. I thought it would be a great project to showcase the beauty and resourcefulness of our campus.

My project consists of a physical 3D model of our campus and a p5.js sketch that provides information about individual buildings.

https://editor.p5js.org/hk3863/full/5MT2OTbHL

Code

The first thing the user sees is the “MAINPAGE” function, where serial communication begins.


 background(mainpage)
  fill('white')
  textSize(width / 20);
  textAlign(CENTER, CENTER);
  textFont(boldFont);
  text("INTERACTIVE \nNYUAD \nCAMPUS EXPLORER", width / 4, height / 2);
  
  textSize(width / 30)
  textFont(regularFont);
  mainpage_message = "PRESS SPACEBAR TO START \nSERIAL COMMUNICATION"
  text(mainpage_message, width / 4, height / 1.2);
  
  if (serialcommunication == "TRUE") {
    mainpage_message = "CLICK TO START";
  }
}

Afterward, the user sees the ID explanation page, where the narrator welcomes them to NYUAD and explains how the virtual tour works. I used the subscription logic from this source (https://editor.p5js.org/hk3863/sketches/OSSNouhkg ), but I’ve adjusted the texts and timings to fit my project.

An essential and creative aspect of this project is the NYU ID card, which is required to access buildings on the NYUAD campus. I’ve used an RFID sensor to replicate the ID card.

When the user clicks on the page, they’re taken to the instruction page, where they can press buttons for specific buildings to obtain information. Here’s the interesting part: after pressing a button, they must scan their ID card to access the information, just as they would when using their ID card to enter buildings.


My model includes five buttons, each linked to a page with information about a building: Campus Center, Dining Halls, Research Buildings, Residences, and the Arts Center. Each page includes photographs and buttons to navigate to the next or previous photo.

function information() {
 
  background(87, 6, 140);
  imageMode(CENTER);
  textAlign(CENTER, CENTER);
  
  textSize(width / 15)
  textFont(boldFont);
  text(title, width / 2, height / 12);
  image(photo[i], imageCenterX, imageCenterY, picturesWidth, picturesHeight);

  fill('white');
  noStroke();

  // Right Triangle Button
  triangle(rightXBase + width / 50, imageCenterY, rightXBase, imageCenterY - height / 40, rightXBase, imageCenterY + height / 40);

  // Left Triangle Button
  triangle(leftXBase - width / 50, imageCenterY, leftXBase, imageCenterY - height / 40, leftXBase, imageCenterY + height / 40);
  

  imageMode(CENTER);
  image(photo[i], width * 0.3, height * 0.5, picturesWidth, picturesHeight);
  
  textAlign(LEFT, CENTER);
  textSize(width / 50)
  textFont(regularFont);
  text(information_text, width * 0.6, height * 0.5)
  
  textAlign(CENTER, CENTER);
  textSize(width / 30);
  textFont(boldFont);
  text('PRESS THE BUTTONS OF OTHER BUILDINGS', width / 2, height * 0.9)  

}

Arduino

My Arduino code is sending two types of data. The first is the digital input from the buttons. I’ve created arrays so that when a specific button is pressed, the button number is sent to p5.js, which then triggers the relevant function about that particular building. The second data type comes from the RFID sensor. I watched several tutorials on YouTube to understand how RFID works. In my code, you’ll see that when the tag name of my card is detected by the RFID sensor, the sensor sends a “1” to p5.js, granting access to the information.

#include <SPI.h>
#include <MFRC522.h>

// RFID Setup
#define SS_PIN 10
#define RST_PIN 9
MFRC522 mfrc522(SS_PIN, RST_PIN);  // Create MFRC522 instance

// Button Setup
const int buttonPins[] = {2, 3, 4, 5, 6};  // Digital pins for buttons
const int numButtons = sizeof(buttonPins) / sizeof(buttonPins[0]);
bool lastButtonState[numButtons] = {0};

// RFID Access Card UID
const String AUTHORIZED_CARD_UID = "70 91 42 55";
bool isAuthorized = false;
int cardAccessStatus = 0;
int buttonPressed = -1;

void setup() {
  // Initialize Serial Communication
  Serial.begin(9600);

  // Initialize RFID Reader
  SPI.begin();
  mfrc522.PCD_Init();


  // Initialize Button Pins (Input Mode, assuming external pull-down resistors)
  for (int i = 0; i < numButtons; i++) {
    pinMode(buttonPins[i], INPUT);
  }
}

void loop() {
  // Check RFID Access
  checkRFID();

  // Process Button Presses
  checkButtons();

  // Send Combined Data
  Serial.print(buttonPressed);
  Serial.print(",");
  Serial.println(cardAccessStatus);

  // Reset button state only if no button is currently pressed
  if (buttonPressed != -1) {
    buttonPressed = -1;
  }

  delay(100);  // Debounce delay
}

void checkRFID() {
  // Look for new cards
  if (!mfrc522.PICC_IsNewCardPresent()) {
    return;
  }
  // Select one of the cards
  if (!mfrc522.PICC_ReadCardSerial()) {
    return;
  }
  // Show UID on Serial Monitor
  String content = "";
  for (byte i = 0; i < mfrc522.uid.size; i++) {
    content.concat(String(mfrc522.uid.uidByte[i] < 0x10 ? " 0" : " "));
    content.concat(String(mfrc522.uid.uidByte[i], HEX));
  }

  content.toUpperCase();
  Serial.println("UID tag: " + content);

  // Check if the card is authorized
  if (content.substring(1) == AUTHORIZED_CARD_UID) {
    isAuthorized = true;
    cardAccessStatus = 1;  // Set to 1 for authorized access
    isAuthorized = false;
  } else {
    isAuthorized = false;
    cardAccessStatus = 0;  // Set to 0 for denied access
  }
}

void checkButtons() {
  for (int i = 0; i < numButtons; i++) {
    // Button logic without pull-ups: HIGH = Button pressed
    bool currentButtonState = digitalRead(buttonPins[i]) == HIGH;
    if (currentButtonState != lastButtonState[i]) {
      lastButtonState[i] = currentButtonState;
      if (currentButtonState) {
        buttonPressed = i;  // Store the pressed button index
      }
    }
  }
}

Circuit

What I Am Proud Of

I am particularly proud of creating the physical 3D model. It was my first time using Illustrator and laser cutting, and it was exciting to see the results. Through this project, I learned how to use Illustrator to turn my ideas into reality. Additionally, I’m happy I tried using a new sensor (RFID), which wasn’t covered in class. I believe it aligns well with the project’s concept.

Further Improvements

Because I didn’t have enough time, I couldn’t paint the campus model. However, with more time, I believe I could have made this model much more beautiful. Additionally, I couldn’t include information about some buildings, such as D1, so I decided to combine D2 and D1.

Overall, I am satisfied with the project’s outcome and pleased that I tried several new things and learned so much from this experience.

IM Show

A lot of people came to see my project! I really enjoyed the experience of presenting my work to others. Through this, I was able to identify some bugs I hadn’t noticed before. People loved the 3D model of the campus I created. They suggested it could be used for Marhaba or campus tours.

Crypto Locker – Yaakulya’s Final Project

Concept Introduction : The Crypto Locker Puzzle is an interactive project designed to challenge users with a series of numbers-cracking tasks under time constraints. The objective is to solve hints and enter correct codes using a custom-built interface to unlock a cardboard box and win the prize inside. This game combines physical computing with digital elements to create an engaging and educational experience.

Link to P5.js Sketch: Click Here

Images of the project:

Initial Design , Credits to Dall-E.

Image of the unlocked candy box

Image of the wirings and breadboard (backside)

Image of the main user controller box.

User testing video:

1) Initial Testing: https://youtu.be/sKT85G0hJLI

2) Final Testing: https://youtu.be/hXSzTsB5x3o

Key Features:

1) Dynamic Countdown Timer: A prominently displayed timer adds a sense of urgency and excitement to the gameplay. It counts down from a set time, pushing players to think and act quickly, which enhances the challenge and engagement of the puzzle.

2) Cryptic Hints Display: As players progress, cryptic hints are displayed on the screen to aid in decoding the puzzle. This feature helps to balance the difficulty level and ensures that the puzzle remains solvable while still challenging.

3) Feedback on Input Accuracy: When players enter a code, the interface immediately provides feedback. If the code is incorrect, players are prompted to try again, and if correct, a success message is displayed, and the box unlocks. This immediate feedback loop keeps players engaged and informed.

Components I used:

1) Arduino Uno: Serves as the main controller for input and output operations.
2) Servo Motor: Operates the locking mechanism of the box.
3) Potentiometer: Allows users to select digits for the code
4) Button: Used for entering selected digits and navigating through the game.
5) P5.js: It acts like a digital interface that provides instructions, feedback, and manages the timer and attempt counter.

IM Show Pictures: People interacting with my project

Auto Locking Video: https://youtube.com/shorts/AAga9JHQt6c?feature=share


What’s the role of P5.js and Aurdino in this project?

P5.js Sketch: The P5.js sketch handles the game logic and user interface. It displays hints and the countdown timer.

Images:


Arduino Sketch: The Arduino controls the hardware aspects of the project. It uses a servo motor to lock and unlock the box. A potentiometer is used for dialing in digits (0-9), and a button confirms the entry of each digit. The Arduino sends these inputs to the P5.js program, which processes them to determine if the entered code matches the required one.

#include <Servo.h> // Include the Servo library

const int buttonPin = 2; // Push button connected to digital pin 2
int buttonState = 0;     // Variable to store the button state
const int potPin = A0;   // Potentiometer connected to analog pin A0
Servo servoMotor;        // Create a servo motor object

void setup() {
  pinMode(buttonPin, INPUT); // Set button pin as input
  Serial.begin(9600);        // Initialize serial communication
  servoMotor.attach(9);      // Attach the servo motor to digital pin 9
  servoMotor.write(0);       // Set initial position of the servo motor to 0 degrees
}

void loop() {
  buttonState = digitalRead(buttonPin); // Read the state of the button
  
  // If the button is pressed (buttonState is LOW)
  if (buttonState == LOW) {
    Serial.println("Button pressed!"); // Send message to serial monitor
    delay(1000); // Delay to debounce the button
  }
  
  // Read the value from the potentiometer and send it to the serial port
  int potValue = analogRead(potPin); // Read the value from the potentiometer
  int mappedValue = map(potValue, 0, 1023, 0, 10); // Map the value to the range 0-9
  Serial.println(mappedValue); // Send the mapped value to the serial port
  
  // Check if a signal is received from p5.js to control the servo motor
  while (Serial.available() > 0) {
    int signal = Serial.read(); // Read the signal from serial port
    if (signal == '0') { // Signal to reset servo motor to 0 degrees
      servoMotor.write(5); // Turn the servo motor to 0 degrees
    } else if (signal == '1') { // Signal to turn servo motor to 90 degrees
      servoMotor.write(90); // Turn the servo motor to 90 degrees
    }
  }
  
  delay(100); // Delay for stability
}

How the communication between P5.js and Aurdino Worked??

Initially I prepared the Arduino sketch to transmit data over the serial port. I wrote code to read sensor inputs, such as button presses or potentiometer values, and sent this data as messages over the serial port using functions like Serial.println() or Serial.write(). In my P5.js sketch, I initialized a serial port object within the setup() function using the new p5.SerialPort() constructor. This object represented the communication channel between my P5.js sketch and the Arduino connected to my computer.

Later I configured the serial port to listen for incoming data by using the serial.on('data', serialEvent) function. This setup ensured that whenever data was received on the serial port, the serialEvent function was automatically called, allowing my P5.js sketch to react to data sent from the Arduino.  Within the serialEvent function of my P5.js sketch, I read incoming data from the serial port using the serial.readLine() function. This function retrieved a line of text sent from the Arduino over the serial port. I then processed this data based on its content, performing actions such as updating the display or triggering events in my P5.js sketch.

Additionally, I enabled bidirectional communication by allowing my P5.js sketch to send data back to the Arduino. This allowed me to control actuators connected to the Arduino, such as servo motors or LEDs, from my P5.js sketch. I used the serial.write() function to send data from my P5.js sketch to the Arduino and vice-versa, facilitating interactive control over hardware components.

Schematics of the complete circuit:

How the initial game works:

Challenges and Code I’m Particularly Proud of:

Among various aspects of my project, there’s one particular area that stands out – the locking mechanism.

Initially, the locking mechanism was designed to activate when the user entered all the codes correctly within a specific time frame. Subsequently, P5.js was supposed to send a signal to Arduino instructing it to rotate the servo motor to 90 degrees. However, I encountered challenges in implementing this functionality. Despite extensive debugging efforts, I struggled to achieve the desired outcome. It took numerous tutorial videos and multiple attempts, but eventually, I successfully resolved the issue.

// Check if the final number matches the correct code
  if (finalNumber === currentNumCode) {
    currentImage = congratsImg; // Display 'congrats.png'
    // Stop all other sounds and play win
    stopAllSounds();
    winSound.play();
    // Send signal to turn servo motor to 90 degrees
    serial.write('1');
  } else {
    currentImage = wrongImg; // Display 'wrong.png'
    // Stop all other sounds and play error
    stopAllSounds();
    errorSound.play();
  }

  // Reset values for the next round
  dashValues = [0, 0, 0, 0];
  currentDashIndex = 0;
  allowNumberSelection = false;
  clearInterval(timerInterval); // Stop the timer
}

Following the adjustment, I found that relying solely on correct numerical input wasn’t effective. Instead, I implemented a solution where upon displaying the “congrats.png” image in P5.js, the servo motor rotates 90 degrees, indicated by the code serial.write('1');. Conversely, if the “congrats.png” image is not displayed, the servo motor remains at 0 degrees, signified by serial.write('0');.

function serialEvent() {
  let message = serial.readLine(); // Read the incoming serial data

  if (message.includes("Button pressed!")) {
    // Toggle between images based on currentImage
    if (currentImage === welcomeImg) {
      serial.write('0');
      currentImage = instImg;
      // Stop all other sounds and play bgm
      stopAllSounds();
      bgmSound.play();
      // Reset the dashes to 0 when returning to welcomeImg
      dashValues = [0, 0, 0, 0];
      currentDashIndex = 0;
      allowNumberSelection = false;
      // Send signal to reset servo motor to 0 degrees
      
    } else if (currentImage === instImg) {
      allowNumberSelection = true; // Allow number selection

After successfully implementing this functionality, I extended its use beyond just locking mechanisms. I ensured that the system would automatically lock after the user restarted the game, enhancing the overall user experience.

Future Improvements and Comments  from Users:

1. As initially planned in the game development, I would like to introduce a concept of levels. This will give players a strong sense of achievement as they complete each level. This is what one of my friend suggested after playing the game after multiple times.

2. To enhance this project even more, I aim to create a compelling story that will engage players deeply in the crypto game and enhance their overall gaming experience. In addition I would also like to add the SFX, for the number selection and opening the box.

3. Finally, I plan to add more locks (servo motors) to the candy box to make it more challenging to open. This will further motivate players to experience the thrill of unlocking the box.

Overall, I would say this has been an incredible opportunity to test my hardware skills. Admittedly, I struggled at the beginning. However, as I delved deeper into the project, things gradually became more interesting. At one point, I even assembled the circuit without consulting any references, which I’m really proud of!

I would like to wholeheartedly thank my friends, professor, and everyone who played the Crypto Locker Game. The excitement people showed when unlocking the box under time constraints made me forget all the challenges I faced during the build. This experience has significantly heightened my interest in physical computing! Looking forward…


Stressed Out? – Final Project

Link to sketch: https://editor.p5js.org/Hazpaz/full/1zy63dQBC

Concept

The finals week is here and stress is something that comes along with it. To soothe everyone’s nerves, I have come up with this project through which anyone can unleash their stress. Simple yet powerful. Inspired by one of the previous works related to stress done by previous students, I’ve decided to take advantage of the stress and anger of the students to create beautiful patterns. The idea is to use a stress ball to measure stress levels. When you squeeze the ball, it tells you how much stress you’re letting out. The project then shows a spiral pattern in action according to the pressure applied.

Images

User testing Video

How does the implementation work

Materials Used

  1. Arduino Uno
  2. Breadboard
  3. flex sensor
  4. jumper wires
  5. 330 ohms resistors
  6. Cardboards
Description of interaction design

When you squeeze the the stress ball, the spiral pattern in p5 starts animating and when the pressure applied on the stress ball increases, the Arduino reads it using the flex sensor and the speed of the spiral animation increases and the color changes to a dark red from a soft color, thus making it feel intense.

Arduino code
const int flexPin = A0;  // Analog pin for the flex sensor

int flexValue = 0; // Variable to store flex sensor value
int pressure = 0;  // Variable to store pressure level (mapped from flex sensor value)
int pressureMin = 10; // Minimum pressure value
int pressureMax = 1023; // Maximum pressure value

void setup() {
  Serial.begin(9600);
}

void loop() {
  // Read flex sensor value
  flexValue = analogRead(flexPin);
  
  // Map flex sensor value to pressure scale (0-100)
  pressure = map(flexValue, pressureMin, pressureMax, 0, 100);
  
  // Send pressure value to p5.js
  Serial.println(pressure);

  
  delay(100); // Adjust delay as needed
}

The A0 pin is used as the analog pin for the flex sensor.

// Map flex sensor value to pressure scale (0-100) 
pressure = map(flexValue, pressureMin, pressureMax, 0, 100);

This code maps the flex sensor reading to a range between 0-100.

// Send pressure value to p5.js 
Serial.println(pressure);

the above code is the communication from Arduino to p5.

p5.js code
function draw() {
  
  if (!patternsPage) {
    
    // Display starting page
    image(startingPage, 0, 0, windowWidth, windowHeight);
    
  } else {
    
    // Display patterns page
    image(bg, 0, 0, windowWidth, windowHeight); // Background image

    // Update and draw circles
    for (let i = 0; i < cols; i++) {
      
      for (let j = 0; j < rows; j++) {
        
        circles[i][j].display();
        circles[i][j].move(circleSpeed * pressure); // Update speed based on pressure
        
      }
    }

    
    // Draw pressure scales
    pressureMeterLeft.draw(pressure);
    pressureMeterRight.draw(pressure);

    
    // Draw texts
    fill('#704402'); // Set text color
    textAlign(CENTER, CENTER); // Align text to center
    text("Pressure: " + pressure, width / 2, 30); // Display pressure value
    

    // Display connection status
    if (!serialActive) { // If serial connection is not active
      fill('red'); // Set text color to red
      text("Press Space Bar to select Serial Port", windowWidth / 2, windowHeight - 20); // Display message to select serial port
    } 
    else {
      
      // If serial connection is active
      fill(0, 255, 0); // Set text color to green
      text("Connected", windowWidth / 2, windowHeight - 20); // Display connected message
      
    }
  }
}

This function controls the visualization and text elements. If on the starting page, it displays the `startingPage` image, and if on the patterns page, it shows the `bg` image. It updates and draws stress-relief circles, adjusting their movement speed according to the pressure level. Pressure scales are drawn on the left and right sides using `pressureMeterLeft` and `pressureMeterRight`, representing the pressure level visually. The pressure value is displayed at the top center, and a message about the status of the serial port connection is shown at the bottom center. If the serial connection is inactive, it prompts the user to press the space bar to select the serial port; otherwise, it indicates that the connection is established.

// Circle class for moving circles
class Circle {
  
  constructor(cx, cy, angle) {
    
    this.angle = angle;
    this.cx = cx;
    this.cy = cy;
    this.baseColor = color('#F0D6B0'); // Green color for low pressure
    this.highPressureColor = color('rgb(179,1,1)'); // Red color for high pressure/
    
  }

  display() {
    
    push();
    translate(this.cx, this.cy);
    noFill();
    let c = map(abs(this.angle % TWO_PI), 0, TWO_PI, 0, 255);
    c -= map(pressure, 0, maxPressure, 0, 100); // Darken color based on pressure
    c = constrain(c, 0, 255);
    let currentColor = lerpColor(this.baseColor, this.highPressureColor, pressure / maxPressure); // Interpolate between green and red based on pressure
    
    noStroke();
    fill(currentColor);
    let x = r * cos(this.angle);
    let y = r * sin(this.angle);
    arc(x, y, size, size, this.angle, this.angle + PI / 2);
    pop();
    
  }

  move(speed) {
    
    this.angle -= speed;
    
  }
}

The `Circle` class defines the behavior and appearance of the patterns. Each circle is constructed with parameters for its center position (`cx` and `cy`) and its starting angle (`angle`). It has properties for colors representing low and high pressure, where green indicates low pressure and red indicates high pressure. The `display()` method draws the circle, adjusting its color based on the current pressure level. The circle’s position is translated to its center, and its color is determined by interpolating between the base color and high pressure color. The `move()` method updates the angle of the circle, causing it to rotate at a speed determined by the pressure level.

// PressureMeter class for the pressure scale
class PressureMeter {
  
  constructor(x, y, width, height) {
    
    this.x = x; // X position
    this.y = y; // Y position
    this.width = width; // Width
    this.height = height; // Height
    
  }

  draw(pressure) {
    
    // Draw pressure scale box
    noFill();
    stroke(10);
    rect(this.x, this.y, this.width, this.height); // Draw the rectangle outline\
    

    // Fill the pressure scale rectangle based on pressure
    let fillAmount = map(pressure, 0, maxPressure, 0, this.height); // Map pressure to the height of the rectangle
    
    fill('#985B00'); // Set fill color to brown
    noStroke();
    rect(this.x, this.y + this.height - fillAmount, this.width, fillAmount); // Draw the filled rectangle
    
  }
}

The `PressureMeter` class contains the visual representation of the pressure scale. It is initialized with parameters for its position (`x` and `y`), as well as its width and height. The `draw()` method is responsible for rendering the pressure scale on the canvas. It first draws the outline of the pressure scale box using the provided position, width, and height. Then, it calculates the fill amount based on the current pressure level, mapping it to the height of the rectangle. The fill color is set to brown, and a filled rectangle is drawn inside the outline, representing the current pressure level.

Embedded sketch

Description of communication between Arduino and p5.js

A stress ball is connected to a flex sensor, which is connected to A0 pin in Arduino Uno. The Arduino is connected to p5 using serial connection. When the stress ball is squeezed, the Arduino reads it with the help of the flex sensor and then maps the sensor reading between 0-100. The Arduino sends this mapped sensor readings to p5 through serial connection and the p5 uses this sensor readings to adjust the speed and color of the animation of the spiral pattern.

// Send pressure value to p5.js 
Serial.println(pressure);

the above code is the communication from Arduino to p5.

Aspects of the project I’m proud of

I’m especially proud of the pressure meter scale and the responsive pattern animation in the project.

// Initializing the two pressure scales
let scaleRectXLeft = 100; // X position of the pressure scale rectangle for the left side
let scaleRectXRight = windowWidth - 100 - rectWidth; // X position of the pressure scale rectangle for the right side

pressureMeterLeft = new PressureMeter(scaleRectXLeft, scaleRectY, rectWidth, rectHeight);
pressureMeterRight = new PressureMeter(scaleRectXRight, scaleRectY, rectWidth, rectHeight);

This block of code shows the initialization two pressure scales, one for the left side and one for the right side of the canvas. I like this because it allows for a visually balanced presentation of the pressure levels on both sides of the screen, creating a sense of symmetry and organization. By positioning the scales at specific x-coordinates, we ensure they are consistently placed regardless of the canvas size. This contributes to the overall aesthetic appeal and user experience of the project.

// Set initial positions
 scaleRectY = height / 2 - rectHeight / 2; // Y position of the pressure scale rectangle
 cols = floor(width / (size * 1.5)); // Number of columns
 rows = floor(height / (size * 1.5)); // Number of rows

 
 // Initialize circles array
 circles = [];
 
 // Loop for the columns
 for (let i = 0; i < cols; i++) {
   
   // Initialize an array for each column
   circles[i] = [];
   
   // Loop for the rows
   for (let j = 0; j < rows; j++) {
     
     // Calculate the x and y positions for the circle
     let x = size / 2 + i * (size * 1.5);
     let y = size / 2 + j * (size * 1.5);
    
     // calculate the distance from the center of the canvas
     let d = dist(x, y, width / 2, height / 2);
     
     // Calculate the angle based on the distance and constant k
     let angle = d / k;
     
     //storing in the array
     circles[i][j] = new Circle(x, y, angle);

This block of code sets the initial positions for the pressure scale and initializes the circles for the pattern animation. I like it because it ensures that the pattern is evenly distributed across the canvas, regardless of its size. By calculating the number of columns and rows based on the canvas dimensions and the size of the circles, it dynamically adjusts to fit the available space. This allows for a consistent and visually pleasing pattern layout, enhancing the overall aesthetic appeal of the project.

Schematics

resources used

Challenges faced and overcoming them

I’ve faced a number of challenges with this project.

  • Initially, there were challenges with implementing a circle pattern. The code for the circle pattern didn’t function correctly and didn’t respond to the sensor readings as intended.
  • To address this issue, I decided to draw inspiration from a spiral pattern which I found online, which proved to be more responsive to the sensor readings.
  • Another challenge was adding the option for users to choose from a variety of patterns. Despite attempts, I encountered difficulties in running multiple patterns simultaneously.

future improvements

  • Offer a variety of stress-relief patterns for users to choose from, catering to different preferences and moods.
  • Enhance the experience by adding soothing music or relaxing sounds to accompany the patterns. For example, if users select a pattern resembling waves or clouds, they can listen to calming nature sounds that match the theme.

IM show documentation

Reviving Retro Gaming: Atari Classics with a Modern Twist

Reviving Retro Gaming: Atari Classics with a Modern Twist

Concept:
This project aims to breathe new life into classic Atari games by reimagining them with interactive physical controls and a unique display using flip-dot technology. The initial implementation features two iconic games, Tetris and Snake, with the potential for future expansion.

The IM Showcase Documentation & Video: 

Implementation:
– Arduino Uno
– Buttons
– Wires
– Resistors
– Flip-dots

Interaction Design:
– Buttons are connected to the Arduino and act as input devices for controlling the games.
– The Arduino communicates with the Processing program via serial communication, sending button press information.
– Processing handles game logic and generates the visuals displayed on the flip-dots.
– Another serial communication channel is established between Processing and the flip-dots to send display data.

Arduino Code:
– The Arduino code reads the button states and sends them to Processing via serial communication.

// Arduino Sketch
void setup() {
  Serial.begin(9600);         // Start serial communication at 9600 baud rate
  pinMode(3, INPUT_PULLUP);   // Set pin 3 as an input with an internal pull-up resistor
  pinMode(4, INPUT_PULLUP);   // Set pin 4 as an input with an internal pull-up resistor
  pinMode(5, INPUT_PULLUP);   // Set pin 5 as an input with an internal pull-up resistor
  pinMode(6, INPUT_PULLUP);   // Set pin 6 as an input with an internal pull-up resistor
}

void loop() {
  // Read the state of the buttons
  int buttonState3 = digitalRead(3);
  int buttonState4 = digitalRead(4);
  int buttonState5 = digitalRead(5);
  int buttonState6 = digitalRead(6);

  // Send the button states over serial, separated by commas
  Serial.print(buttonState3);
  Serial.print(",");
  Serial.print(buttonState4);
  Serial.print(",");
  Serial.print(buttonState5);
  Serial.print(",");
  Serial.println(buttonState6);  // 'println' for a new line at the end

  delay(100);  // Delay for a short period to avoid sending too much data
}

Processing Code:
The Processing code performs several key tasks:
– Game Logic: Manages game mechanics, including player movement, collision detection, and game state.
– Visuals: Generates the graphics for each game to be displayed on the flip-dots.
– Serial Communication: Receives button input data from the Arduino and sends display data to the flip-dots.

Casting to Flipdots:

The Processing code utilizes a custom library to communicate with the flipdots and send the display data.

import processing.net.*;
import processing.serial.*;

void cast_setup() {
  if (!config_cast) return;
  if (castOver == 1) {
    for (int i = 0; i < netAdapters.length; i++) {
      String[] adapterAddress = split(netAdapters[i], ':');
      adaptersNet[i] = new Client(this, adapterAddress[0], int(adapterAddress[1]));
    }
  }

  else if (castOver == 2) {
    // printArray(Serial.list());
    for (int i = 0; i < serialAdapters.length; i++) {
      String[] adapterAddress = split(serialAdapters[i], ':');
      adaptersSerial[i] = new Serial(this, adapterAddress[0], int(adapterAddress[1]));
    }
  }
}

void cast_broadcast() {
  if (!config_cast) return;
  int adapterCount = netAdapters.length;
  if (castOver == 2) {
    adapterCount = serialAdapters.length;
  }

  for (int adapter = 0; adapter < adapterCount; adapter++) {
    for (int i = 0; i < panels.length; i++) {
      if (panels[i].adapter != adapter) continue;
      cast_write(adapter, 0x80);
      cast_write(adapter, (config_video_sync) ? 0x84 : 0x83);
      cast_write(adapter, panels[i].id);
      cast_write(adapter, panels[i].buffer);
      cast_write(adapter, 0x8F);
    }
  }

  if (config_video_sync) {
    for (int adapter = 0; adapter < adapterCount; adapter++) {
      cast_write(adapter, 0x80);
      cast_write(adapter, 0x82);
      cast_write(adapter, 0x8F);
    }
  }
}


void cast_write(int adapter, int data) {
  if (castOver == 1) {
    adaptersNet[adapter].write(data);
  }
  else if(castOver == 2) {
    adaptersSerial[adapter].write(data);
  }
}
void cast_write(int adapter, byte data) {
  cast_write(adapter, data);
}
void cast_write(int adapter, byte[] data) {
  if (castOver == 1) {
    adaptersNet[adapter].write(data);
  }
  else if(castOver == 2) {
    adaptersSerial[adapter].write(data);
  }
}

Challenges and Solutions:
Initially, the project aimed to use p5.js to handle the game logic and visuals. However, challenges arose in establishing reliable communication and sending data to the flip-dots. To overcome this, the decision was made to switch to Processing, which provided a more stable environment for serial communication and flip-dot control.

Proud Achievements:
Successful Integration of Hardware and Software: The project combines Arduino, buttons, and flip-dots with Processing to create a unique gaming experience.

Retro Games with a Modern Twist: Classic Atari games are revitalized with physical controls and a visually appealing flip-dot display.

Future Improvements:
Expand Game Library: Add more classic Atari games or even explore the possibility of creating new games specifically designed for this platform.

Enhance Visuals: Experiment with different animation techniques and graphical styles to further enhance the visual appeal of the games on the flip-dot display.

Refine User Interface: Explore additional input methods or create a more intuitive menu system for navigating between games.

Explore p5.js Integration: Revisit the possibility of using p5.js in the future if more robust libraries or solutions for flip-dot communication become available.

Instructions

 Check the full code on GitHub: https://github.com/pavlyhalim/Atari


Luke Nguyen – Final Project – Can You See the Music?

Link to p5js code: https://editor.p5js.org/luke.s.ng/sketches/U8Xmnxnwu

Concept:

My final project is a Audio Workstation that can allow users to input music from Arduino using a special glove into p5 and visualize it. I was inspired by this Mimu glove created by MI.MU GLOVES LIMITED, which allows users to make music through movement using only a pair of glove with a lot of physical computing programmed into the device. My project is a simplified version of this, which only utilizes Arduino. I used p5.js to enhance the user’s experience visually, allowing them to see how their music is seen to the eyes.

User testing:

Some pictures / video of project interactions & comments + feedback:

What parts of your project did you feel the need to explain? How could you make these areas more clear to someone that is experiencing your project for the first time?

I got more than 10 people who came and interacted with my device, and a few of them were my classmates and friends from other classes.

Ume passed by, and I also invited her to test it. Afterward, she suggested that for future improvement, I could consider implementing this device in a way that it can trigger many musical instruments at the same time. She commented that this project of mine is already advanced enough, and her suggestion can be considered for a later, more advanced stage of learning interactive media.

Other than Ume, your friend also suggested that I can keep this device as a simple music maker but develop it into one that can incorporate more musical instruments.

Implementation/Description of interaction design:

Users can create music notes using Arduino and trigger them to appear inside p5. The Arduino board makes use of two major components: four buttons representing four fingers and one distance sensor. Each finger is assigned a different music instrument: index finger – piano, middle finger – drum, ring finger – guitar, pinky – synthesizer pulses.

The program currently supports the C major scale, consisting of 7 basic notes: C, D, E, F, G, A, B. Piano notes range from C4 to B5. Drum rhythm ranges from heavy kick to high crash. Guitar notes range from C3 to A3. And synthesizer pulses range from C6 to A6.

The user can control one instrument using two simultaneous actions: pressing the buttons attached to the tip of the glove they wear, users can trigger music notes inside p5.js. Simultaneously, by VERTICALLY controlling a distance sensor placed on the table, they can select/control the notes by changing the frequency of the buttons/their fingertips. Users can press other buttons at the same time to play with other musical instruments.

Additionally, they can press “R” and then play one instrument to record, then press “S” to stop, then press “L” to loop and save the first instrument. They can then input another instrument. The process can be repeated for other instruments. Users can keep doing that until they have generated something either funky, following a stream of consciousness, or a nice melody.

p5js will take the notes users input, put them through an amplitude analyzer and create a visualization on screen.

Arduino code: 

const int trigPin = 7;
const int echoPin = 8;

void setup() {
  // Start serial communication so we can send data
  // over the USB connection to our p5js sketch
  Serial.begin(9600);

  pinMode(trigPin,OUTPUT);
  pinMode(echoPin,INPUT);

  // start the handshake
  while (Serial.available() <= 0) {
    Serial.println("0,0"); // send a starting message
    delay(300);            // wait 1/3 second
    digitalWrite(LED_BUILTIN, LOW);
    delay(50);
  }
}

void loop() {
  // wait for data from p5 before doing something
  while (Serial.available()) {
    // digitalWrite(LED_BUILTIN, HIGH); // led on while receiving data
    if (Serial.read() == '\n') {
      // detecting the pressure sensor
      int PressureSensor = analogRead(A0);
       delay(5);

      int PressureSensor2 = analogRead(A2);
      delay(5);

      int PressureSensor3 = analogRead(A4);
      delay(5);

      int PressureSensor4 = analogRead(A6);
      delay(5);


      long duration, inches, cm;

  // The PING))) is triggered by a HIGH pulse of 2 or more microseconds.
  // Give a short LOW pulse beforehand to ensure a clean HIGH pulse:
  digitalWrite(trigPin, LOW);
  delayMicroseconds(2);
  digitalWrite(trigPin, HIGH);
  delayMicroseconds(10);
  digitalWrite(trigPin, LOW);
  // The same pin is used to read the signal from the PING))): a HIGH pulse
  // whose duration is the time (in microseconds) from the sending of the ping
  // to the reception of its echo off of an object.
  duration = pulseIn(echoPin, HIGH);

  // convert the time into a distance
  inches = microsecondsToInches(duration);

  Serial.print(PressureSensor);
  Serial.print(',');
  Serial.print(inches);
  Serial.print(',');
  Serial.print(PressureSensor2);
  Serial.print(',');
  Serial.print(PressureSensor3);
  Serial.print(',');
  Serial.println(PressureSensor4);

  delay(100);
    }
    // digitalWrite(LED_BUILTIN, LOW);
  }

}

long microsecondsToInches(long microseconds) {
  // According to Parallax's datasheet for the PING))), there are 73.746
  // microseconds per inch (i.e. sound travels at 1130 feet per second).
  // This gives the distance travelled by the ping, outbound and return,
  // so we divide by 2 to get the distance of the obstacle.
  // See: https://www.parallax.com/package/ping-ultrasonic-distance-sensor-downloads/
  return microseconds / 74 / 2;
}

long microsecondsToCentimeters(long microseconds) {
  // The speed of sound is 340 m/s or 29 microseconds per centimeter.
  // The ping travels out and back, so to find the distance of the object we
  // take half of the distance travelled.
  return microseconds / 29 / 2;
}

p5.js code:

The p5js code is too long to post here, so I’ll include aspects of code that I’m really proud of.

function startPlayingGame() {

// remember to calibrate the note accordingly
background(0);

console.log(note_piano);
if (note_piano > 200){
        if (freq_piano >= 1 && freq_piano <= 2){
          c4_piano.play(); c4_piano.setVolume(0.1);    
    }
        else if (freq_piano >= 3 && freq_piano <= 4){
            d4_piano.play(); d4_piano.setVolume(0.1);
    }
        else if (freq_piano >= 5 && freq_piano <= 6){
            e4_piano.play(); e4_piano.setVolume(0.1);
    }
        else if (freq_piano >= 7 && freq_piano <= 8){
            f4_piano.play(); f4_piano.setVolume(0.1);
    }
        else if (freq_piano >= 9 && freq_piano <= 10){
            g4_piano.play(); g4_piano.setVolume(0.1);
    }
        else if (freq_piano >= 11 && freq_piano <= 12){
            a4_piano.play(); a4_piano.setVolume(0.1);
    }
        else if (freq_piano >= 13 && freq_piano <= 14){
            b4_piano.play(); b4_piano.setVolume(0.1);
    }
        else if (freq_piano >= 15 && freq_piano <= 16){
            c5_piano.play(); c5_piano.setVolume(0.1);
    }
        else if (freq_piano >= 17 && freq_piano <= 18){
            d5_piano.play(); d5_piano.setVolume(0.1);
    }
        else if (freq_piano >= 19 && freq_piano <= 20){
            e5_piano.play(); e5_piano.setVolume(0.1);
    }
        else if (freq_piano >= 21 && freq_piano <= 22){
            f5_piano.play(); f5_piano.setVolume(0.1);
    }
        else if (freq_piano >= 23 && freq_piano <= 24){
            g5_piano.play(); g5_piano.setVolume(0.1);
    }
        else if (freq_piano >= 25 && freq_piano <= 26){
            a5_piano.play(); a5_piano.setVolume(0.1);
    }
    else if (freq_piano >= 27 && freq_piano <= 28){
            b5_piano.play(); b5_piano.setVolume(0.1);
    }
  }


  if (drum > 200){
    if (freq_piano >= 1 && freq_piano <= 3){
      heavykick.play(); heavykick.setVolume(0.1);
    }
        else if (freq_piano >= 4 && freq_piano <= 6){
            lightkick.play(); 
            lightkick.setVolume(0.1);}

            else if (freq_piano >= 7 && freq_piano <= 9){
              snaresidekick.play(); 
              snaresidekick.setVolume(0.1);}

              else if (freq_piano >= 10 && freq_piano <= 12){
                lowtom.play(); 
                lowtom.setVolume(0.1);}

                else if (freq_piano >= 13 && freq_piano <= 15){
                  snarecenter.play(); 
                  snarecenter.setVolume(0.1);}

                  else if (freq_piano >= 16 && freq_piano <= 18){
                    hihatopen.play(); 
                    hihatopen.setVolume(0.1);}

                    else if (freq_piano >= 19 && freq_piano <= 21){
                      hitom.play(); 
                      hitom.setVolume(0.1);}

                      else if (freq_piano >= 22 && freq_piano <= 24){
                        crash.play(); 
                        crash.setVolume(0.1);}
    
  }

  if (guitar > 200){
    if (freq_piano >= 1 && freq_piano <= 3){
      c3_guitar.play();
      c3_guitar.setVolume(0.1);
    }

    else if (freq_piano >= 4 && freq_piano <= 6){
      d3_guitar.play();
      d3_guitar.setVolume(0.1);
    }

    else if (freq_piano >= 7 && freq_piano <= 9){
      e3_guitar.play();
      e3_guitar.setVolume(0.1);
    }

    else if (freq_piano >= 10 && freq_piano <= 12){
      f3_guitar.play();
      f3_guitar.setVolume(0.1);
    }

    else if (freq_piano >= 13 && freq_piano <= 15){
      g3_guitar.play();
      g3_guitar.setVolume(0.1);
    }

    else if (freq_piano >= 16 && freq_piano <= 18){
      a3_guitar.play();
      a3_guitar.setVolume(0.1);
    }

    else if (freq_piano >= 19 && freq_piano <= 21){
      b3_guitar.play();
      b3_guitar.setVolume(0.1);
    }
  }


  if (synth > 200){
    if (freq_piano >= 1 && freq_piano <= 3){
      c6_synth.play();
      c6_synth.setVolume(0.1);
    }

    else if (freq_piano >= 4 && freq_piano <= 6){
      d6_synth.play();
      d6_synth.setVolume(0.1);
    }
    else if (freq_piano >= 7 && freq_piano <= 9){
      e6_synth.play();
      e6_synth.setVolume(0.1);
    }

    else if (freq_piano >= 10 && freq_piano <= 12){
      f6_synth.play();
      f6_synth.setVolume(0.1);
    }

    else if (freq_piano >= 13 && freq_piano <= 15){
      g6_synth.play();
      g6_synth.setVolume(0.1);
    }

    else if (freq_piano >= 16 && freq_piano <= 18){
      a6_synth.play();
      a6_synth.setVolume(0.1);
    }

    else if (freq_piano >= 19 && freq_piano <= 21){
      b6_synth.play();
      b6_synth.setVolume(0.1);
    }
  }
// Visualization for the drum 
  push()
    angleMode(DEGREES);
    colorMode(HSB);
    spectrum2 = fft2.analyze();

    // background(0);

    noStroke();
    translate(windowWidth / 2, windowHeight / 2);
    //beginShape();
    for (let i = 0; i < spectrum2.length; i++) {
      let angle = map(i, 0, spectrum2.length, 0, 360);
      let amp = spectrum2[i];
      
    //change the shape of the visualizer
      let r2 = map(amp, 0, 512, 50, 500);
      
    //create the circle
      let x2 = (r2 + 50) * cos(angle);
      let y2 = (r2 + 50) * sin(angle);
      
    //color the bar
      stroke(i, 100, 100);
      line(0, 0, x2, y2);
      }
  pop()

    angleMode(RADIANS)


// Visualization for the piano
  push()
  fill(0, 0, 0, 5);
  stroke(0, 255, 255);
  angleMode(RADIANS)

    for (let i = 0; i < n; i++) {
      theta.push(random(0, 2 * PI));
      dir.push(1);
      r.push(random(30, 380));
      rdir.push(1);
      c.push(createVector(windowWidth/2, windowHeight/2));
    }

    rect(0, 0, windowWidth, windowHeight);
    let spectrum = fft.analyze();

    // Calculate average amplitude to detect beats
    let level = amplitude.getLevel();

    // Adjust animation based on music intensity or beats
    for (let i = 0; i < n; i++) {
      theta[i] = theta[i] + (PI / 100) * dir[i];
      rdir[i] = checkr(rdir[i], r[i]);
      r[i] = r[i] + rdir[i];
      x = c[i].x + r[i] * cos(theta[i]);
      y = c[i].y + r[i] * sin(theta[i]);
      point(x, y);

      // modify animation based on beat detection
      let bass = fft.getEnergy("bass");
      let treble = fft.getEnergy("treble");

      // adjust wave parameters based on music energy
      r[i] = map(bass, 0, 255, 30, 380);
      dir[i] = map(treble, 0, 255, -1, 1);
  }
  pop()

// waveform visualization
  push()
    angleMode(DEGREES);
    stroke('rgb(255,182,222)');
    noFill();
    translate(windowWidth / 2, windowHeight / 2);

    let wave = fft_waveform.waveform();

    for (let k = -1; k <= 1; k += 2) {
      beginShape();
      for (let i = 0; i <= 180; i+= 0.7) {
        let j = floor(map(i, 0, windowWidth, 0, wave.length - 1));

        let r3 = map(wave[j], -1, 1, 100, 250);

        let x3 = r3 * sin(i) * k;
        let y3 = r3 * cos(i);
        vertex(x3, y3);
      }
      endShape();
    }
  pop()

// waveform of the particles
  push()
    translate(windowWidth/2, windowHeight/2);
    
    let spectrum4 = fft_particles.analyze(); // Analyze frequency spectrum
    
    // console.log(spectrum);

    let currentHasFrequency = spectrum4.some(freq => freq > 0);
    
    // If frequency detected and no particle created for this frequency yet
    if (currentHasFrequency && !particleCreated && spectrum4[0]) {
      let p = new Particle();
      particles.push(p);
      particleCreated = true; // Set flag to true to prevent continuous particle creation for this frequency
    }

    // Update and display particles
    for (let i = particles.length - 1; i >= 0; i--) {
      particles[i].show();
      particles[i].update();
    }
    
    // Reset flag after particle creation
    if (particleCreated && particles.length > 0) {
      particleCreated = false;
    }
  pop()
// function to initiate commands.
function keyPressed() {
  if (key == " ") {
    setUpSerial();
  }

  if (key == 'r') {
    startRecording();
  } else if (key == 's') {
    stopRecording();
  } else if (key == 'p') {
    playRecording();
  } else if (key == 'l') {
    loopRecording();
  }
}


// functions to initiate music-making options
function startRecording() {
  recorder.record(soundFile);
  console.log('Recording started...');
  recordingStarted = true;
}

function stopRecording() {
  recorder.stop();
  console.log('Recording stopped.');
}

function playRecording() {
  soundFile.play();
  console.log('Playback started...');
}

function loopRecording(){
  soundFile.loop();
    isLooping = true;
}


Communication between Arduino and p5.js:

From p5js side:

function readSerial(data) {
  ////////////////////////////////////
  //READ FROM ARDUINO HERE
  ////////////////////////////////////

  if (data != null) {
    // make sure there is actually a message
    // split the message
    let fromArduino = split(trim(data), ",");
    print(fromArduino);
    // if the right length, then proceed
    if (fromArduino.length == 5) {
      // only store values here
      // do everything with those values in the main draw loop

      // We take the string we get from Arduino and explicitly
      // convert it to a number by using int()
      // e.g. "103" becomes 103
      
      if (isLooping == false){
        note_piano = int(fromArduino[0]);
        drum = int(fromArduino[2]);
        guitar = int(fromArduino[3]);
        synth = int(fromArduino[4]);
      }

      // get frequency for all types of sound
      freq_piano = int(fromArduino[1]);

      if (!recordingStarted && freq_piano != 0) {
        startRecording(); // Start recording
      }
    }
    //////////////////////////////////
    //SEND TO ARDUINO HERE (handshake) - MUST have these lines for Arduino to send to p5
    //////////////////////////////////
    let sendToArduino = fromArduino + "\n";
    writeSerial(sendToArduino);
  }

From Arduino side:

Serial.print(PressureSensor);
  Serial.print(',');
  Serial.print(inches);
  Serial.print(',');
  Serial.print(PressureSensor2);
  Serial.print(',');
  Serial.print(PressureSensor3);
  Serial.print(',');
  Serial.println(PressureSensor4);

Schematics:

Some issues and aspects of the project I’m particularly proud of:

I was particularly proud of creating the visualizer. I took some time to learn how to use the p5.FFT function inside p5js. Initially, I watched this Sound Visualization: Frequency Analysis with FFT – p5 tutorial from Daniel Shiffman: https://www.youtube.com/watch?v=2O3nm0Nvbi4. But the tutorial is about syncing the visualizer with a played sound. I had a lot of trouble making the visualizer sync to every time the music note is triggered. I also had some issues combining the visualizers onto one plane and arranging their positions. I had to be really careful with controlling the variables.

I also wanted the users to have the option to record what they play, and figuring out how to record took me a lot of time. I kept failing at this part as I initially approached the code from the perspective of adding each note and each sound byte to an array and playing it back later.

BUT the aspect that I was struggling with the most was about using a pressure sensor. Its variable range varied way too much. The threshold for triggering the music notes when I pressed kept changing from time to time. The music generated inside p5 was not good at all. I was so fixated on this idea as I thought it was the only possible option. Until I discovered the button. It provided a much more stable parameter range of extremely high values and extremely low values for controlling the threshold as a digital device. The buttons I found are really soft to the touch, and they can be attached to the tip of the glove.

Another issue I ran into was about establishing a connection between Arduino and p5js:

I kept running into this error:

and

Pressure sensor doesn’t run when adding while (Serial.available() <= 0) {} and while (Serial.available()) {}

Future improvement:

I approached the project hoping to have only one visualizer for each instrument, but it seems that the object p5.FFT is a universal object that can’t take the frequency of any individual musical instrument. Therefore, I have to think of ways to make that happen for the future.

Also, I hope to be able to incorporate the accelerometer or gyrometer to monitor the motion of wrists and use that to trigger drum pattern/rhythm.

Observations from IM Showcase interactions for future improvements:

Everyone intuitively followed the screen instructions, but almost everyone seems to not know how to proceed at the connecting p5js with Arduino part.

There are two aspects where users are mostly confused about: how to use the distance sensor and how to connect p5js to Arduino. In terms of the distance sensor, it doesn’t come to them intuitively that they can hover their left hand up and down above the distance sensor to trigger different frequencies, hence different musical notes. For a few users, I had to explain to them how they should operate the project, and for them, I had to provide very detailed instructions. I’ve implemented the text “Press Space Bar to connect to the glove,” but it seems that only those who know how to set up serial communication understand it; those who don’t seem not. So for an area of improvement, I’m thinking of having it run as soon as the user presses the “ROCK ON” button to start the visualizer.

Final Project Presentation

Concept

Inspired by “GarageBand”, an application on Apple devices, I wanted to create an interface that allows the users to play musical instruments wherever they are at. As the title of the program suggests (“Corner of the Room Band”), the goal of this interaction was to provide access to instruments whether the users are in their room or anywhere else. When I was younger, I used to play with GarageBand. While it provided access to instruments such as piano and drum, I always hoped a different instrument to be added. However, my hope was not met through GarageBand and hence my project was made to satisfy my desire.

User Test

After I have built and created the project, I asked my friend to use the program. The video and image below illustrates my friend using the program:

User Testing

After the user testing, I made no big changes to p5 or Arduino because everything was pretty much set. My friend successfully navigated and used the program without difficulties.

Implementation

The overall interaction looks like this: p5 changes pages or the “gameState”, buttons on Arduino sends signal to p5 when pressed, sound files that correspond to each button is played through the laptop.

More precisely, the user navigates through different pages by clicking on the screen made through p5. When the user enters either the piano or flute page, sound files that are tied to each button on Arduino will be played when pressed. The potentiometer on Arduino is used to control the volume of the sound that is projected through the laptop.

  1. p5.js

For this project, p5 was heavily used. It was used to create the game interface and to call up the sounds files of each instrument. Although p5 was mainly used to code for the project, nothing too complex or complicated was performed.

function homePage () {
  imageMode(CORNER);
  image(homeImg, 0, 0, windowWidth, windowHeight);
  
  //start button
  fill('white');
  rectMode(CENTER);
  rect(windowWidth / 2, windowHeight * 0.8, windowWidth * 0.11, windowWidth * 0.05,30);
  
  //start button text
  fill('black');
  strokeWeight(3);
  textSize(windowWidth / 30);
  text("Start", windowWidth / 2.14, windowHeight * 0.812);
}

Like the code shown above, I created functions for the different pages of the project. Under each function, I made buttons that would help the users navigate through the interface.

function mousePressed () {
  //transitioning from home page to inst. page
  if (gameState == "home" && 
    mouseX > windowWidth / 2 - windowWidth * 0.2 &&
    mouseX < windowWidth / 2 + windowWidth * 0.2 &&
    mouseY > windowHeight * 0.8 - windowWidth * 0.05 &&
    mouseY < windowHeight * 0.8 + windowWidth * 0.05
    ) {
      gameState = "inst";
  }

Function mousePressed was written to actually allow the user to transition from one page to another by clicking on the buttons that were created previously.

function serialEvent() {
  //chords
  playC=int(fromArduino[0])
  playD=int(fromArduino[1])
  playE=int(fromArduino[2])
  playF=int(fromArduino[3])
  playG=int(fromArduino[4])
  volume=int(fromArduino[5])
  
  // Check if the message is "ButtonC"
  if (playC==0 && gameState == "piano") { 
    
    //controlling the volume 
    pianoC.setVolume (realVolume);
    
    // Play the pianoC sound file
    if (pianoC.isPlaying()) {
      // Stop the sound if it's already playing
      pianoC.stop();
    }
    pianoC.play();
  }
  

  // Check if the message is "ButtonD"
  if (playD==0 && gameState == "piano") { 
    
    //controlling the volume 
    pianoD.setVolume (realVolume);
    
    // Play the pianoD sound file
    if (pianoD.isPlaying()) {
      // Stop the sound if it's already playing
      pianoD.stop(); 
    }
    pianoD.play();
  }
  
  
  // Check if the message is "ButtonE"
  if (playE==0 && gameState == "piano") { 
    
    //controlling the volume 
    pianoE.setVolume (realVolume);
    
    // Play the pianoE sound file
    if (pianoE.isPlaying()) {
      // Stop the sound if it's already playing
      pianoE.stop(); 
    }
    pianoE.play();
  }
  
  
  // Check if the message is "ButtonF"
  if (playF==0 && gameState == "piano") { 
    
    //controlling the volume 
    pianoF.setVolume (realVolume);
    
    // Play the pianoF sound file
    if (pianoF.isPlaying()) {
      // Stop the sound if it's already playing
      pianoF.stop(); 
    }
    pianoF.play();
  }
  
  
  // Check if the message is "ButtonG"
  if (playG==0&& gameState == "piano") { 
    
    //controlling the volume 
    pianoG.setVolume (realVolume);
    
    // Play the pianoC sound file
    if (pianoG.isPlaying()) {
      // Stop the sound if it's already playing
      pianoG.stop(); 
    }
    pianoG.play();
  }

The code above is what is essential to the project and what I am proud of. Using the data received from Arduino (which tells p5 when a certain button is pressed and what the value of the potentiometer is), p5 plays the sound file and controls the volume of the sound being projected. For instance, when p5 understands that ButtonC on Arduino is pressed at the same time the gameState is “piano“, a sound file “pianoC” will be played.  The same thing was done for other notes and the flute.

//this is under function draw ()

//mapping the range of the volume
 realVolume = map(volume, 0, 1023, 0.0, 1.0);
 print(realVolume);

Furthermore, using the value collected by potentiometer in Arduino, the value was mapped to fit in the range of the volume on p5.

function readSerial(data) {
  ////////////////////////////////////
  //READ FROM ARDUINO HERE
  ////////////////////////////////////
  if (data != null) {
     fromArduino = split(trim(data), ",");
     message = fromArduino;
     //print(message);
     serialEvent ();      
    }

Lastly, using function readSerial, p5 read the data sent from Arduino and used the data to perform the tasks mentioned above.

Home page:

Inst page:

Piano page:

Flute page:

2. Arduino

With Arduino, buttons and potentiometer were used. Each button pin was given a const int name that corresponded to its pin number and each button an int name that digital reads the information from its pin. For example, the button for the note C was plugged into pin no. 2 (const int buttonCPin) and the data collected from pin no. 2 (int ButtonC) was used to send a string of information to p5.

Furthermore, const int potPin was used to collect data from A0, which is where potentiometer was connected. Then int volume was used to analog read the potentiometer value which was sent to p5 as a string.

//Define the button pins
const int buttonCPin = 2;
const int buttonDPin = 3;
const int buttonEPin = 4;
const int buttonFPin = 5;
const int buttonGPin = 6;
const int potPin = A0;
char button = 0;


void setup() {
  // Set the button pins as input with internal pull-up resistor
  pinMode(buttonCPin, INPUT_PULLUP); 
  pinMode(buttonDPin, INPUT_PULLUP);
  pinMode(buttonEPin, INPUT_PULLUP);
  pinMode(buttonFPin, INPUT_PULLUP);
  pinMode(buttonGPin, INPUT_PULLUP);
  // Initialize serial communication
  Serial.begin(9600); 


  // start the handshake
  while (Serial.available() <= 0) {
    digitalWrite(LED_BUILTIN, HIGH); // on/blink while waiting for serial data
    Serial.println("0,0"); // send a starting message
    delay(300);            // wait 1/3 second
    digitalWrite(LED_BUILTIN, LOW);
    delay(50);
  }
}


void loop() {
  while (Serial.available()) {
    digitalWrite(LED_BUILTIN, HIGH); // led on while receiving data
  int volume = analogRead(potPin); // Read the potentiometer value

//creating int and string to send to p5.js
int ButtonC = digitalRead(buttonCPin);
int ButtonD = digitalRead(buttonDPin);
int ButtonE = digitalRead(buttonEPin);
int ButtonF = digitalRead(buttonFPin);
int ButtonG = digitalRead(buttonGPin);

  Serial.println(String(ButtonC) + "," + String(ButtonD) + "," + String(ButtonE)+ "," +String(ButtonF) + "," + String(ButtonG)+ "," + String(volume)); 
  }

  }

As the code above shows, code for Arduino is comparatively short. It simply reads signal from the pins of the button and the potentiometer and creates a string to send to p5.

Aspects of the Project that I am Proud of

First, I am glad I changed from using the speaker on Arduino to the PC speaker. The sound quality was poor when projected through the small speaker on Arduino and to enhance the sound quality and user experience, I removed the Arduino speaker and used the PC speaker instead.

Second, using string to communicate data between p5 and Arduino was very convenient and helpful. If I were to use other methods, the code for both p5 and Arduino would have been longer. However, because I used strings, the data that is being sent from Arduino to p5 was concise and very organized. In this way, when I printed the data on p5, I received one array with all the information I need to run the interaction.

Also, I am proud of the console/button box that I created. While it is a very simple box with the buttons attached, the box is well designed to fit the theme of the project.

Below are pictures that show the process of building the box:

Challenged Faced and How I Overcame Them

Initially, I was going to use the potentiometer to control the frequency of the musical notes. However, I changed my plan and used it to control the volume instead because I could not find Arduino sound files that plays the flute sound. Therefore, I had to upload piano and flute sound files on p5, which prohibits the control of the frequency. Although I had to give up controlling the frequency of the sound, controlling of the volume seems like a good replacement of what the potentiometer could do.

Also, I struggled to write the code for controlling the volume on p5. Now that I have written all the code, the code for controlling the volume is actually very simple. The mistake I made was not mapping the range of the volume. From Arduino, values ranging from 0-1023 was being sent to p5 and in order for me to use this value to control the volume, I had to map it so that it fits under the range of 0-1. After I had this code written, I was able to control the volume.

Lastly, I encountered difficulties finding sound flies. At first, my plan was to have piano and guitar on the program. However, I was not able to find a good sound file for the guitar on the internet. Therefore, I changed the guitar to flute instead and successfully found sound files for the flute.

Areas for Future Improvement

For improvements, I would like to add more buttons so that the user can play more various musical notes. As of now, I only used 5 buttons for the first 5 musical notes (C, D, E, F, G). If I could add more buttons, more various sounds would be playable, enhancing user experience.

Also, I would like to add more instruments on the program. For now, there are only piano and flute but if I had more time and if more sound files were available, then I would like to add more instruments such as the drum, guitar, and trumpet.

Additionally, if I could remake the box, I would like to use laser cutting to create a more solid and neat box. Although the current box performs all the necessary tasks, it can fall apart in any moment because cardboard instead of plywood or acrylic was used. Therefore, I would like to improve the box by using laser cutting to create a more strong and durable box.

One thing that bothers me a little with my project is the delay or lag in the play of the sound files. When the user presses a button on Arduino, the corresponding sound file does not play immediately and hence creates a gap. I removed all delay functions on Arduino and checked individual sound files on p5, but for some reason, the delay between the button press and play of the file did not resolve.

Schematics

IM Showcase

IM Showcase

During the showcase, I was able to explain and display my final project to many people. Due to the loud noise in the arts center, I had to borrow a set of headphones so that the users can clearly hear the sounds. Many people liked the flute sound and were entertained by the interaction. I also had so much fun experiencing the works of peers. Everyone had such an interesting project and overall, the IM Showcase was a great opportunity to share our skills, talents, and projects.

Week 12 Assignment

Assignment 1:

For this assignment, it displays an ellipse whose horizontal position is controlled by a potentiometer connected to an Arduino board. When the space bar is pressed, it establishes a serial connection. The Arduino continuously reads the potentiometer value and sends it to the P5.js sketch via serial communication, allowing real-time adjustment of the ellipse’s position.

P5 code:

let ellipseHorizental;
function setup() {
  createCanvas(640, 480);
  textSize(18);
  ellipseHorizental = width/2; 
}
function draw() {
  background(220);
  // Draw ellipse with width based on potentiometer value
  fill("green");
  ellipse(ellipseHorizental, height / 2, 100, 150);
  if (!serialActive) {
    text("Press Space Bar to select Serial Port", 20, 30);
  } else {
    text("Connected", 20, 30);
    // Print the current potentiometer value
    text('Potentiometer Value = ' + str(ellipseHorizental), 20, 50);
  }
}
function keyPressed() {
  if (key == " ") {
    setUpSerial();
  }
}
function readSerial(data) {
  if (data != null) {
    // convert the string to a number using int()
    let fromArduino = split(trim(data), ",");
    // Map the potentiometer value to the ellipse width
    ellipseHorizental = map(int(fromArduino[0]), 0, 1023, 0, 640); 
  }
}

Arduino code:

const int potPin = A0;  // Analog pin connected to the potentiometer
void setup() {
  Serial.begin(9600);
}
void loop() {
    int potValue = analogRead(potPin);  // Read the value from the potentiometer
      // Send the potentiometer value to p5.js
      Serial.println(potValue);
}

Assignment 2:

For assignment 2 it establishes communication between a P5.js sketch and an Arduino board for controlling LED brightness. The P5.js sketch allows users to adjust brightness by dragging the mouse horizontally, with instructions displayed when the serial connection is active. The Arduino board continuously waits for serial data from the P5.js sketch, adjusting the LED brightness accordingly. During setup, a handshake process is initiated, blinking the built-in LED while waiting for serial data.

P5 code:

let brightness = 0; //variable for brightness control

function setup()
{
createCanvas(400, 400); //create canvas
}

function textDisplay() //display text in the starting
{
text("PRESS SPACE TO START SERIAL PORT", width/2 - 109, height/2 - 5);
}

function draw()
{

background(220); //grey background

if (serialActive) //if serial is active
{
text("connected", width/2 - 27, height/2 - 5); //tell the user that it is connected
text("Drag the mouse horizontally to change brighthess", width/2 - 130, height/2 + 15); //give instructions on how to control brightness
}
else
{
textDisplay(); //display instructions on how to start serial is not active
}
  
if (mouseX >= 0 && mouseX<=10){
  brightness = 0;
}
else if (mouseX >= 3 && mouseX<=width/5){
  brightness = 51;
}
else if(mouseX >= width/5 && mouseX<=2*width/5){
  brightness = 102;
}
else if(mouseX >= 2*width/5 && mouseX<=3*width/5){
  brightness = 153;
}
else if(mouseX >= 3*width/5 && mouseX<=4*width/5){
  brightness = 204;
}
else if (mouseX>=4*width/5){
  brightness = 255;
}
else{
  brightness = 0;
}
  
}

function keyPressed() //built in function
{
if (key == " ") //if space is pressed then
{
setUpSerial(); //setup the serial
}


}

//callback function
function readSerial(data)
{
let sendToArduino = brightness + "\n"; //add the next line to dimness counter
writeSerial(sendToArduino); //write serial and send to arduino
}

Arduino code:

int LED = 5; // Digital pin connected to the LED
void setup() {
  Serial.begin(9600);
  pinMode(LED_BUILTIN, OUTPUT);
  pinMode(LED, OUTPUT);
  // start the handshake
  while (Serial.available() <= 0) {
    digitalWrite(LED_BUILTIN, HIGH); // on/blink while waiting for serial data
    Serial.println("0");             // send a starting message
    delay(300);                       // wait 1/3 second
    digitalWrite(LED_BUILTIN, LOW);
    delay(50);
  }
}
void loop() {
  // wait for data from p5 before doing something
  while (Serial.available()) {
    digitalWrite(LED_BUILTIN, HIGH); // led on while receiving data
    int brightnessValue = Serial.parseInt();
    if (Serial.read() == '\n') {
      delay(5);
      Serial.println(brightnessValue);
    }
    analogWrite(LED, brightnessValue);
    digitalWrite(LED_BUILTIN, LOW);
  }
}

Assignment 3:

For this assignment, we tried to establish communication between a P5.js sketch and an Arduino board (bi-directional). The P5.js sketch simulates a ball’s motion affected by wind and gravity, with its behavior controlled by sensor data received from the Arduino. The Arduino reads data from an ultrasonic sensor to determine distance, sending LED control signals back to the P5.js sketch based on the received distance data, influencing wind direction and LED turning on.

P5 code:

//declare variables
let velocity;
let gravity;
let position;
let acceleration;
let wind;
let drag = 0.99;
let mass = 50;
let LEDvalue = 1401;
let goRight = 0;
let goLeft = 0;
let first

function setup() {
createCanvas(1000, 360); //create canvas
noFill();
position = createVector(width/2, 0);
velocity = createVector(0,0);
acceleration = createVector(0,0);
gravity = createVector(0, 0.5*mass);
wind = createVector(0,0);
}

function textDisplay()
{
text("PRESS SPACE TO START SERIAL PORT", width/2 - 109, height/2 - 5); //display the appropriate text in the start
}

function draw() {
background(255);
if (serialActive) //if the serial is active
{
applyForce(wind);
applyForce(gravity);
velocity.add(acceleration);
velocity.mult(drag);
position.add(velocity);
acceleration.mult(0);
ellipse(position.x,position.y,mass,mass);
if (position.y > height-mass/2) //if the ball touches the bottom
{
velocity.y *= -0.9; // A little dampening when hitting the bottom
position.y = height-mass/2;
LEDvalue = 1401; //take LED value to be 1401 because we dont want the value (1) to be lurking in the serial and then affecting the wind values

}
else
{
LEDvalue = 1400; //when the LED is off
}

}
else
{
fill(0);
textDisplay();
}
}

function applyForce(force){
// Newton's 2nd law: F = M * A
// or A = F / M
let f = p5.Vector.div(force, mass);
acceleration.add(f);
}

function keyPressed(){
if (key==' '){ //if space is pressed, then serial is set up
setUpSerial();
}

if (keyCode == DOWN_ARROW) //if down arrow is pressed
{
//mass etc is changed
mass=random(15,80);
position.y=-mass;
velocity.mult(0);
}
}

function readSerial(data) //call back function
{
let sendToArduino = LEDvalue + "\n"; //sends value of LED to Arduino with \n added
writeSerial(sendToArduino); //write to Arduino

if (data != null) //if the data is not null and something is received
{
console.log(data);
if (data > 1450) //if the distance is greater than 1450, then
{
wind.x = 1; //the ball/wind goes right
}
else if (data < 1350) //if the distance is less than 1350
{
wind.x = -1; //the ball/wind goes left
}
}
}


Arduino code:

//declare variables
const int LED_PIN = 4;
int LEDvalue = 0; //will contain whether or not the LED should be on or off
int distance = 0; //will contain the distance by ultrasonic sensor
const int pingPin = 2; //Trigger Pin of Ultrasonic Sensor
const int echoPin = 3; //Echo Pin of Ultrasonic Sensor

void setup()
{
Serial.begin(9600); // Start serial communication at 9600 baud

pinMode(LED_PIN, OUTPUT); //pin mode is output

//Set the ultrasonic sensor pins as output and input respectively
pinMode(pingPin, OUTPUT);
pinMode(echoPin, INPUT);

while (Serial.available() <= 0)
{
Serial.println(1400); //connection establishment. 1400 so that the wind values do not change
}
}

void loop()
{
//wait for p5js
while (Serial.available())
{
sensorReading(); //reads data from the sensor

LEDvalue = Serial.parseInt(); //parsing from the serial written data from p5js

if (LEDvalue == 1400) //if the LED value is 1400
{
digitalWrite(LED_PIN, LOW); //then turn off the LED
}
else if (LEDvalue == 1401) //if the LED value is 1401
{
digitalWrite(LED_PIN, HIGH); //then turn on the LED
}
}
}

//Function to read the ultrasonic sensor and measure distance
void sensorReading()
{
//Send a short low pulse
digitalWrite(pingPin, LOW);
delay(2); //delay to avoid complications
digitalWrite(pingPin, HIGH); //sends a high pulse for 10 microseconds
delay(10);
digitalWrite(pingPin, LOW); //turn off the ping pin
distance = pulseIn(echoPin, HIGH); //Measure the duration of the ultrasonic pulse and calculate the distance
Serial.println(distance); //print the serial from distance
}