Drawing with Fourier Transform, Polygon Guesser, Mustafa Bakir, Week 3 assignment

Inspiration

This idea initially was sparked by my a Youtube channel called 3Blue1Brown, from this video specifically.

Design

Initially, before implementing any program, you have to design proper psuedocode and sometimes a flowchart to aid with you coding your project.

I first did my research on the topic, from a page in Wikipedia, this gave me some general ideas of the mathematical concepts used to utilize Discrete Fourier Transformation. I then watched this youtube video to give me a better idea to how to design and implement the DFT algorithm. Moreover, this article gave me more insight on the topic.

I didn’t need to do any sketches as the videos and blogs I watched and read gave me a rough idea, I only had to design the algorithms I am going to use.

I used latex to design my algorithms.

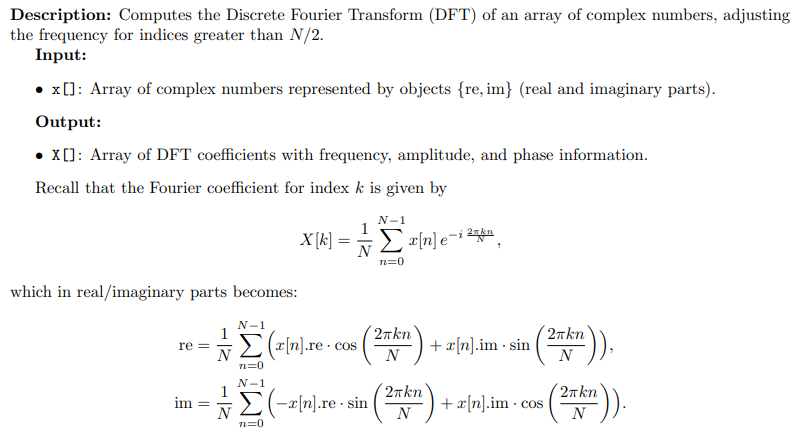
I made use of the built in p5 functions to implement those mathematical notations as such:


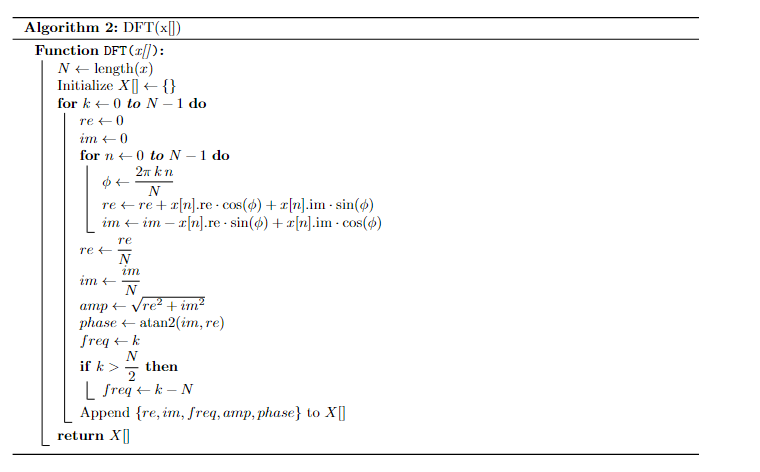
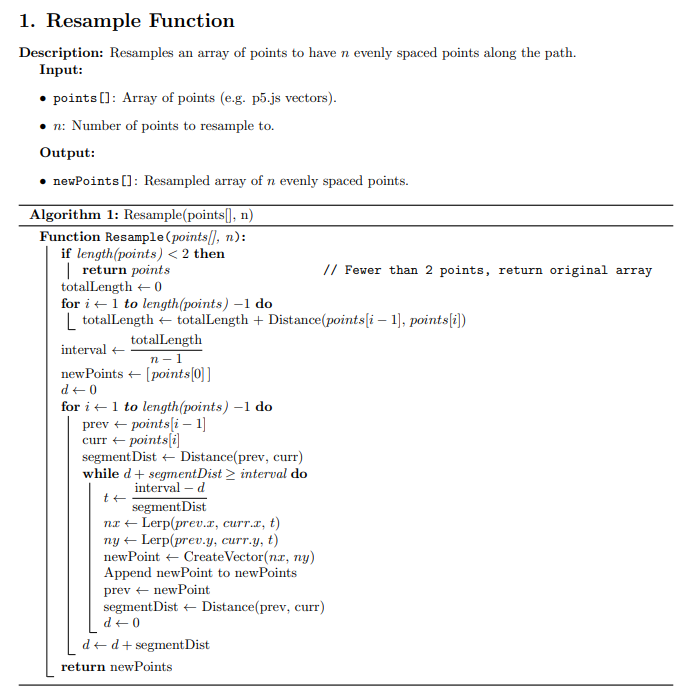
Then I implemented the resample function, which standardizes the distribution of points along a given path.


Lastly, I designed the draw function to keep the drawing animated.


Sketch

Creativity elements: what makes this different that other DFT projects?

The usage of DFT (Discrete Fourier Transformation) in video projects or art sketches is usually done by setting certain coordinates for pre-determined shapes and objects. For my project, the user gets to draw their own shape which will be traced by the epicycles, which revolutionizes DFT to be much more utilizable in different fields. The background, being plane black acts as a canvas for the user to not be influenced or distracted with background elements but rather truly unleash the original shape the user has in mind.

Moreover, the big center circle acts as a centralizer, if the user draws a triangle on the corner of the canvas for example, the exact same triangle will be traced but it will be in the middle of the canvas, this enhances user experience and avoids uninentional behavior. Lastly, It would be really hard for the user to precisely trace a fully enclosed shape if the user is using a mouse to draw, therefore, for aesthetic purposes and improved user experience, the shapes automatically close upon mouse release.

Code Highlights

// -------------- epicycle class --------------
// represents one epicycle for fourier reconstruction
class Epicycle {
  constructor(x, y, coeff) {
    this.x = x; // x coordinate of center
    this.y = y; // y coordinate of center
    this.freq = coeff.freq; // set freq from coefficient
    this.amp = coeff.amp * scaleFactor; // set amplitude with scaling
    this.phase = coeff.phase; // set phase from coefficient
  }
  // compute endpoint of epicycle at given time
  update(time) {
    let angle = this.phase + TWO_PI * this.freq * time; // calc angle using phase and freq
    let dx = this.amp * cos(angle); // calc x displacement
    let dy = this.amp * sin(angle); // calc y displacement
    return createVector(this.x + dx, this.y + dy); // return new endpoint as vector
  }
  // draw epicycle's circle on canvas
  display() {
    stroke(255, 100); // set stroke color with transparency
    noFill(); // no fill for circle
    ellipse(this.x, this.y, 2 * this.amp); // draw circle with diameter equal to 2 * amp
  }
}

This is the class I used that is used to create the epicycles to draw the the traced curves.

if (closedShape && path.length > 0) {
  // if closed shape flag set and path exists
  vertex(path[0].x, path[0].y); // close shape by connecting to first pt
}

This code ensures that the shape is closed by checking the distance between initial point and the last point of the array

Struggles I faced

I was struggling with the smoothness of the curves, so I tried to implement a moving average filter, which is a filter for the coordinates. That was really bad so I texted my friend who is pretty smart at coding.

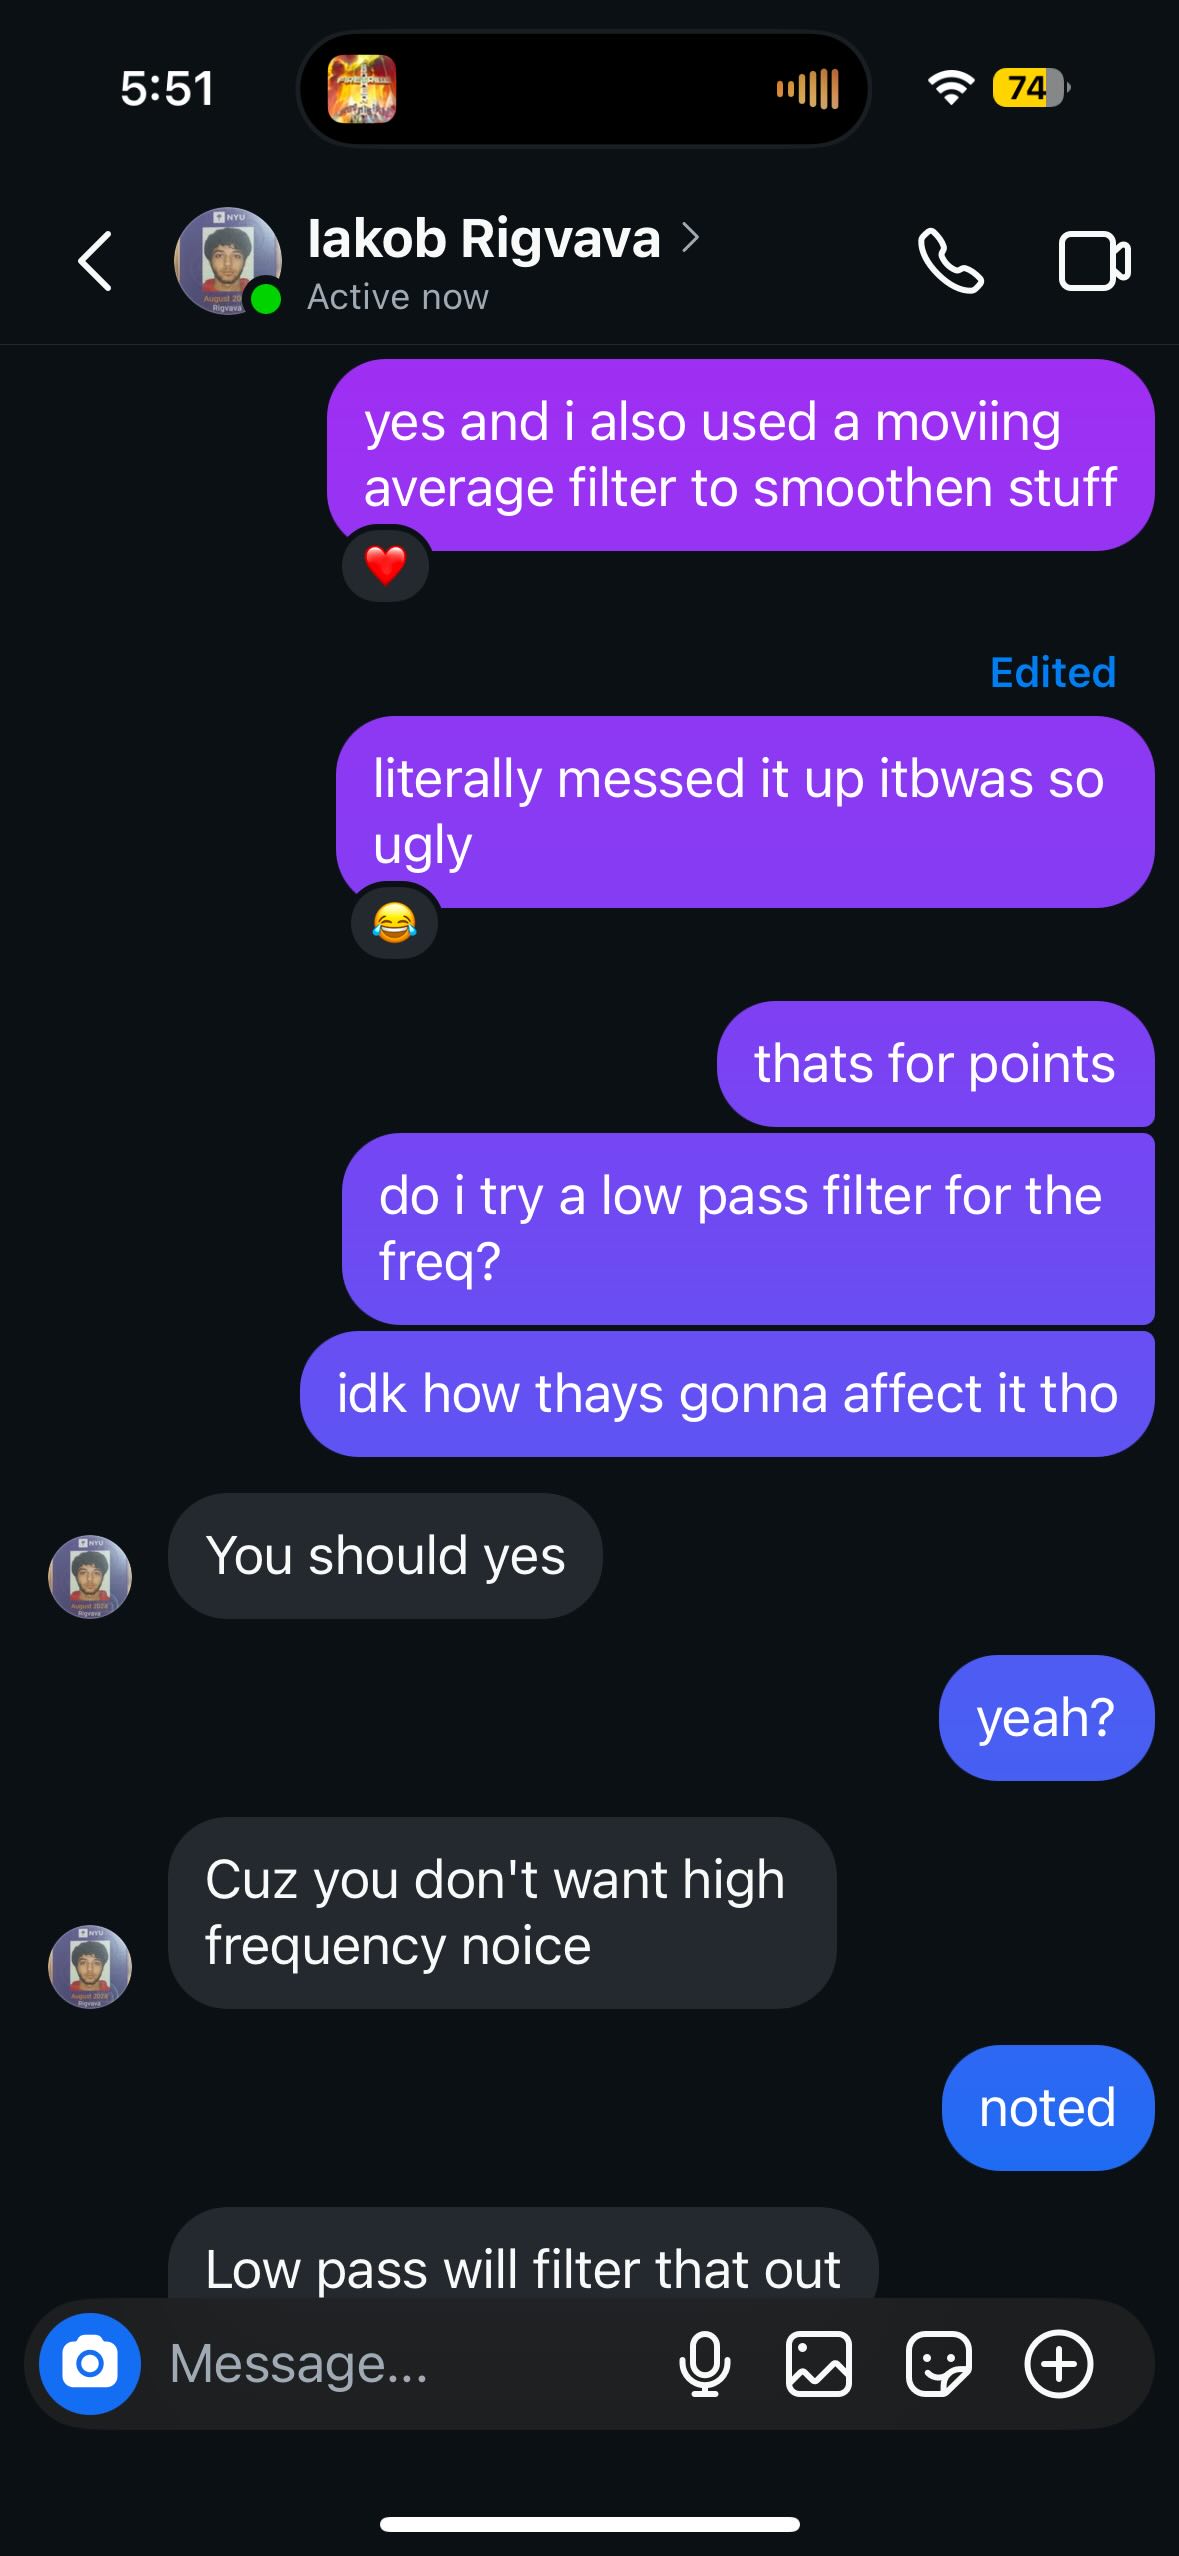
I remembered that a low pass filter is used to smoothen frequencies, and I did impelement that after my friend Iakob inspired me, it ended up so nice.

Future Improvements

The animation of how the shape closes is very fast in relation to the drawing animation, I need to enhance the algorithm to match the number of epicycles and control the speed of the closing animation accordingly

I really dislike how the speed has to change when the number of epicycles changes, and you basically have to trial-and-error your way through, I want to re-implement some stuff to combine those two things which would make anyone whos tweaking the code’s life much easier

AI usage declaration

I admit that I used artificial intelligence to help me with this assignment, especially with the resample function, but all the work, design, concept, and implementation was mine, I only used AI to help me debug and orient/guide me throughout the process of creating this art piece.

Week 3 – Object Oriented Programming

Click on the piece with your mouse:

Link to sketch: https://editor.p5js.org/bobbybobbb/full/GKQffo525

When brainstorming ideas for this generative piece, I thought about pixel art and how you can generate complex images with simple shapes. You just need a lot of these simple shapes, and since we’re working with arrays this week, it’d be easy to store this data. I had this idea of a 100 pixel grid and how combining lines and diagonals can make shapes like flowers. It can be simple and have one color, so you essentially only need to store one thing: whether or not a specific pixel is colored. I created an object for the flowers where a boolean is stored in a 10 x 10 2d array. To display the flower, I just have to go through the array and fill in pixels that are true with a color and not filled in otherwise. The most difficult part about this process was creating a dynamic algorithm for generating each flower shape. I didn’t want to create individual shapes from scratch that were hard-coded in, so I used numbers like each pixel’s coordinate on the grid (the x and y value), an argument for the object that’s a randomly generated number each time, and the distance of the pixel from the center of the grid, to create equations and true or false statements to determine whether a pixel is colored or not. This part came with a lot of experimentation; I would generate 20 flowers on the screen to test out whether or not I like the way the numbers are being manipulated and the specific shapes of the flowers. Brainstorming how to manipulate the numbers and making sure there was a diverse range of shapes took the most amount of time.

Here’s some ways I generated the flower shapes: (this.shape is a random number passed into the object as an argument, i and j are the x and y coordinates of the pixel)

// distance of pixel to center of flower
let distFromCenter = dist(j,i,5,5);

// random pattern, weird alg after testing 
if ((distFromCenter - this.shape)==0) {
  this.pixArr[i][j] = true;
}
        
// another random pattern
if ((i * j + i + j + distFromCenter)%this.shape==0) {
  this.pixArr[i][j] = true;
}

// diagonal pattern
if (diag) {
  // diagonal
  if ((i+j==10) || (i==j)) {
    this.pixArr[i][j] = true;
  }
}

Every time the user clicks their mouse, a random flower (different shape, size, color) is generated. Each flower also has a green stem (its size is determined by the flower size). I didn’t want the flowers to exist in a vacuum so I created cloud objects as well that move across the screen and a blue background to seem like a sky. The clouds also have randomly generated speeds and positions within a given range. The flowers’ positions are also limited to the lower half of the screen because it wouldn’t make sense for them to be in the sky. There’s a “clear” button at the bottom of the screen to clear the flowers as well.

Randomness for the flowers’ parameters:

var xCoor = random(-20,400);
var yCoor = random(200,400);
var pixelSize = random(2,10);
var col = color(random(255), random(255), random(255));
var shape = floor(random(5));

For future improvements, I want to develop more algorithms that’ll give me more complex flower shapes, because right now, you can tell these flowers have a limited range of shapes.

Brainstorming:

Week 3: Generative Art

Concept

For the concept I was inspired by jellyfish and their movement in the wild. I tried to recreate their look with glowing circles to make the piece more aesthetic. Their movement is random, yet smooth, simulating real life movement but they also leave marks behind their movement for the overall look of the project.

Process

I started by just creating a class for the “creatures”, this included their initial positioning and their size. I then started implementing the movement, which was not that hard with the use of object oriented programming. For the movement, I wanted it to be random and smooth also so I used the noise function of p5js to achieve this. I then created a glowing feel to the creatures and also wanted to make them change colors smoothly and randomly similar to the movement. This proved to be a little bit difficult as noise function only returns 0 and 1 and I kept getting just the black color. To overcome this I had to use sin and cos functions which would keep the values between -1 and 1 and with some math achieve the wanted effect.

//useing the sin and cos which only return 1 or -1 to keep the values under 255
let r = 100 + 155 * sin(frameCount * 0.01 + this.noiseOffset);
let g = 50 + 150 * cos(frameCount * 0.01 + this.noiseOffset);
let b = 150 + 105 * sin(frameCount * 0.02 + this.noiseOffset);

//create a glowing effect
noStroke();
fill(r, g, b, 30);
ellipse(0, 0, this.size * 1.5, this.size * 1.5);
Reflection and future improvements

It was fun to use object oriented programming in p5js. It proved to not be that difficult and made the overall project making experience easier. After some time the creatures leave the screen which could be interpreted as a feature and not a bug as they are being scared away from us looking at them. In the future I would maybe like to implement some interaction with the mouse, maybe they either group around the mouse or stay away from it. Overall a great learning experience!

Week 3 – Reading Response

What do you consider to be the characteristics of a strongly interactive system? What ideas do you have for improving the degree of user interaction in your p5 sketches?

A strongly interactive system is one that feels alive in the sense that it responds to the user and isn’t just like a one way conversation. It listens to what the user is doing, understands those actions, and adapts in a way that makes the experience feel more personal and engaging. In the reading Crawford talks about interactivity being a kind of conversation between the system and the user, with three essential elements, listening, thinking, and speaking.  This means the system is not just reacting, but actively participating and if any of those elements falter, the interaction falls flat.

Thinking about how I can bring this to my p5 sketches, I realize there’s a lot I could do to make the interaction feel more alive. Specifically I think there’s room to play with how the system “speaks” back to my users. Before this reading my idea of interaction was just having visual feedback when a user clicks or drags, but now I think there’s more potential to make those responses more dynamic and meaningful. For example, instead of the same visual change with every interaction, I could have the system react differently based on how the user engages. If a user clicks quickly or drags slowly, the feedback could reflect that, so essentially just subtle changes in how elements behave could help keep the user invested. By treating user interaction as this ongoing exchange, I think I can create sketches that feel more responsive, intuitive, and engaging. The goal is for the user to feel like the system is learning and adapting, making each interaction unique. That’s what really makes it feel like the system has a personality of its own, and the user is an active part of shaping the experience.

Reading Reflection – Week#3

Characteristics of a strongly interactive system

One key takeaway of the reading is that degrees of interactivity can be determined by examining how much the three necessary elements of conversation (namely, listening, thinking and speaking) are incorporated in a cyclic, alternative manner between two actors. Let’s take this definition further. Here is my expanded definition of a strongly interactive system – it scores well on the following three aspects:

  1. the amount of information it receives (eg. taking in the position of the user’s feet v.s. taking in the position of the user’s whole body over time, their voice and their facial expressions)
  2. the extent to which it understands the data (eg. not understanding due to lack of knowledge vs understanding due to having knowledge on the subject area) and intellectually engages with it in a manner that fulfills its intention. It is measured by the amount of influence it gives to the other actor (eg. an action that causes a subtle change in the user’s view of a topic vs. an action that causes a total shift in the same user’s view of the same topic).
  3. how well the data it processed is expressed, considering form (eg. showing important information in small text vs large text), measured by how well a user understands the intention.

Let’s break it down. Firstly, I posit that the test for interactivity must consider all users whom the system is intended for. In the refrigerator example, not only one actor, but different types of actors are considered here: adult and child. Since different kinds of users can use one system, and the system may not be intended for every single person who exists (eg. babies who wouldn’t open refrigerator doors), the test for interactivity must consider all users whom the system is intended for. Second, a strongly interactive system is the opposite of the weakly interactive system: it has a great extent to which it listens, thinks and speaks in response to all users whom the system is intended for. Third, since interaction is not one-way, but two-way, a strongly interactive system must indicates both: (1) a great extent to which that system (a) receives information, (b) qualitatively processes it according to intention, and (c) clearly expresses that data which it had made sense of – in response to all users, as well as (2) a great extent to which intended users can (a) listen, (b) think and (3) speak in response to the system, in an alternating and repeatable manner. Fourth, a strongly interactive system’s quality of processing its data received can be measured by the how well it intellectually engages with it in a manner that fulfills its intention. By intention, I mean intention within a spectrum of full transparency and some ambiguity (total ambiguity is excluded because that does not allow proper communication and consequently, does not allow proper interaction). Sometimes, we need ambiguity – some things hidden, not everything revealed. Think of a teacher teaching a student – a good teacher could give some information on a topic, then raise difficult questions to the student in order to engage the student more deeply and intellectually, find nuances and dive into greater complexity. Ambiguity can provoke further curiosity and interaction, thus, intention matters and is necessary. Fifth, processing of information must be done in a way that intention must be made clear to the user (eg. the user actually notices that some information is hidden and others emphasized). In the teacher-student example, the student recognized that the teacher is hiding certain information. Engagement sparks with this recognition, so helping the other user understand intention is crucial. See the appendix below for my proposed expanded definition of a highly interactive system.

Ideas for improving degree of user interaction in p5 sketches

There are so many ways to improve the degrees of user interaction. The system can perform some response to user’s actions: eg. mouse clicks, mouse moves left, mouse moves right, mouse moves upwards, mouse moves downwards, key pressed, and key released. Let’s take some examples. If the mouse is clicked, some text that’s associated with an object (eg. cat) can be displayed. If the mouse moves left, spacing between dots may decrease, and if the mouse moves right, spacing between dots may increase. If the left key is pressed, an object can move left and if the right key is pressed, an object can move right. If the ‘a’ key is pressed, the canvas could have a background the colour of an apple. And if the ‘b’ key is pressed, the canvas could have a black background. As an interactivity designer, it will be important to consider the purpose of the artwork, and as the reading puts it, consider both form and function in creating a unified design.


Week 3: Generative Art

Concept

One of my goals for this week’s project was to incorporate live movement as my previous sketches were all static. I also found Tuesday’s in-class exercise on bouncing balls and collisions interesting, so I wanted to incorporate collision into my sketch as well.

I got inspiration from Casey Reas’ CENTURY piece to work with lines– specifically exploring randomness in lines in terms of coordinates, speed and strokes.

CENTURY, Casey Reas

When I think of lines in classical art, Piet Mondrian’s artworks are the first that come to my mind. I decided to take ideas from both of these artworks, each representing the digital and physical world, to create my generative artwork piece.

Piet Mondrian

Process

This sketch consists of a class for drawing a moving line across the canvas. Each line is randomly sized (length & stroke weight), located and colored; it can either move towards the top or the bottom of the screen and at randomly selected speeds. Each line moves across the canvas and when it goes out of the canvas bounds, it wraps around and appears again from where it originally started. When two lines intersect, the color of both temporarily changes to white. The colors used in the sketch are inspired by Mondrian’s color palette and a black border is drawn around the canvas to give the sketch a more traditional art feeling.

Most of the line attributes (speed, stroke weight, line count etc) are chosen randomly within two sets of boundaries and I plugged in various different values for each bound before settling on certain values to ensure that the movements are not too quick and pleasant to the eyes.

Challenges

Detecting the intersection between two lines was the trickiest part of this project and had to get mathematical. I referred to a StackOverflow comment to write the function to check for intersection between two lines, which I later found was based on Cramer’s rule.

intersects(other) {
  // function to detect line-line intersection
  // reference: https://stackoverflow.com/a/55598451
  let det = (this.x2 - this.x1) * (other.y2 - other.y1) - (this.y2 - this.y1) * (other.x2 - other.x1);
  
  // lines are parallel so will never intersect
  if (det === 0) return false;

  let s = ((other.x1 - this.x1) * (other.y2 - other.y1) - (other.y1 - this.y1) * (other.x2 - other.x1)) / det;
  let t = ((other.x1 - this.x1) * (this.y2 - this.y1) - (other.y1 - this.y1) * (this.x2 - this.x1)) / det;
  
  // intersection occurs if both s and t are in the range (0, 1)
  return s >= 0 && s <= 1 && t >= 0 && t <= 1;
}

The update function for moving the lines according to their gradients and wrapping them around the canvas was also a bit time-consuming as the code had to change depending on which direction the lines were going. When it got confusing, I did lots of testing with slowed up line speeds to debug and figure out why things were drawing incorrectly.

update() {
  this.x1 += this.speed;
  this.x2 += this.speed;
  
  this.y1 = this.computeY(this.x1, this.initial_x1, this.initial_y1);
  this.y2 = this.computeY(this.x2, this.initial_x2, this.initial_y2);
  
  if (this.go_up) {
    // check if the line has went beyond the top or left boundary
    if (this.x2 <= 0 || this.y2 <= 0) {
      // reset the line so that it appears from the bottom
      this.x1 = width;
      this.y1 = this.computeY(this.x1, this.initial_x1, this.initial_y1);
      this.x2 = this.x1 + this.delta_x;
      this.y2 = this.y2 + this.delta_y;
    }
  
  } else {
    // check if the line has went beyond the bottom or right boundary
    if (this.x1 >= width || this.y1 >= height) {
      // reset the line so that it appears from the top
      this.x2 = 0;
      this.y2 = this.computeY(this.x2, this.initial_x2, this.initial_y2);
      this.x1 = this.x2 - this.delta_x;
      this.y1 = this.y2 - this.delta_y;
    }
  }
}

Reflections & Improvements for Future Work

I spent a considerable amount of time deciding on this week’s project and struggled to settle on one, but once I found an artwork I liked, I was able to seek and find more sources of inspiration. The actual implementation process, though with some challenges, went considerably smoothly once the idea was set, thanks to StackOverflow and repeated slow testing. In the next assignments, I hope to continue seeking inspiration from not only the digital world, but also from the physical world and from what I see with my eyes everyday.

Assignment 3: Twinkling Constellations

My Concept

This project is a twinkling night sky, where stars pulse and change brightness naturally. Clicking (or pressing a key) creates constellations by connecting nearby stars, randomly forming unique patterns each time. The background is a real sky image that i uploaded beforehand.

Code Highlight

It took me a while to figure out the way to form constellations between stars. So first, I try to find stars near the mouse (within a distance of 100). Then, I enhance the twinkling effect by making closer stars (within a distance of 50) brighter. Also, my constellations sometimes looked messy with too many connections so i had to limit those to only nearby stars (within a distance of 70) for cleaner constellations.

function createConstellation(x, y) {
  let constellationStars = [];
  
  for (let star of stars) {
    let d = dist(x, y, star.xPos, star.yPos);
    if (d < 100) {
      constellationStars.push(star);
      if (d < 50) {
        star.setSizeAndAlpha(d);
      }
    }
  }

  connections = [];
  for (let i = 0; i < constellationStars.length; i++) {
    for (let otherIndex = i + 1; otherIndex < constellationStars.length; otherIndex++) {
      let d = dist(
        constellationStars[i].xPos, constellationStars[i].yPos,
        constellationStars[otherIndex].xPos, constellationStars[otherIndex].yPos
      );
      if (d < 70) {
        connections.push([constellationStars[i], constellationStars[otherIndex]]);
      }
    }
  }

  for (let star of constellationStars) {
    star.setBrightness(255);
  }
}

Reflections

The vision i had when creating this was the power of connection, resembling “the butterfly effect” — the idea that everything is interconnected and happens for a reason.  At first, the stars exist independently, scattered across the sky like people and events in the world. But through interaction (user clicks), certain stars come together to form constellations: patterns that weren’t visible before. This could represent how separate people, situations, or choices can align to reveal meaning in what once appeared random.

Looking back, if I had to do this project again, I would likely try to refine the performance, especially if the number of stars increases. I would also improve the design part by adding more visually engaging elements. Overall, I’m satisfied with the result.

Embedded sketch

Week 2 – Reading response

How are you planning to incorporate random elements into your work?

Well, I myself have am not used to the idea of producing something random, although there is beauty in the idea of randomness it’s not as alluring as the idea of systematic approach. When it’s random, it’s likely only to be produced once like that and twice if you can beat the odds. Although Casey, with in the video showed how these random elements can prove to not only provide an unique appearance, he also presents its limitations on how once done can’t be done agin, the idea of having to repeat a process to hopefully create something similar can be infuriating, but also fascinating as the random elements could go beyond expectation or never reach the expectations sent. I intend to incorporate this kind of thinking into future works, I might not be happy in the beginning due to my rigid thinking but over time I could change and will change in how to balance the randomness that can only produced once and the control of the scope in which it happens.

Where do you feel is the optimum balance between total randomness and complete control?

I think that when theres a start of a systematic approach too randomness. All randomness has to be born with in a confined space, whether by the laws of science that govern the way things move or how systems have an algorithm that will produce a random sequence based off the a equation thats been written before hand. You can’t escape, it but you can confine it with in a space. Like a science experiment you might have the tools, and test it out and then an outcome that works. You have your controlled variables and uncontrolled variables. Sometimes we are the uncontrolled variables but our way of thinking is the controlled variable. The way we move and do things, the laws of the universe these are controlled, set in stone in that moment, but once we release it without being able to calculate or speculate the outcome it then becomes random.

Week 2 Assignment

Introduction:

While looking through the same art, I thought that its actually far from what I could create at least at this point. I wanted it to simple yet something that reminds me of home. I ended up then thinking about what makes home, home? Was it the people that I missed? Was it the seas and mountains? Was it the seasons? Well, it was a bit of everything, the way the mountain changed its vegetation across the seasons, the way I’d travel to those mountains with those very precious people. The way the seasons or the feel of the seasons could not be replicated here with in the UAE.

Concept:

My concept for the post had to do with mountains and seasons. The reflection on something not season as clearly or with in the country as abundantly as my own country. I didn’t really use any references from the document but it’s essence rather gave me something I’d rather implement.


Production and Completion:

Although I had to go through many trials, like getting the color scheme, the clouds, the sun and moon, the mountains, as well as the time switch to show the seasons. I wasn’t satisfied, because I had a dream of how it should have made me felt. I hadn’t gotten close but I had gotten somewhere, starting with what can represent the seasons? the time? The way things change. If you look at the code you will notice that the frame rate changes at about every 3 seconds like the months. The sun changes into the after 1.6 seconds and the moon to the sun at 0.8 seconds, match 16 hours of sun and 8 hours of moon.


let sunAngle = 0;
let showMoon = false;
let seasonProgress = 0;
let currentSeason = "spring";
let mountainProgress = 0;
let seasons = ["spring", "summer", "autumn", "winter"];
let brushColors;
let icons = [];
let clouds = [];

function setup() {
    createCanvas(800, 600);
    brushColors = [
        color(139, 69, 19),  // Brown (Autumn)
        color(34, 139, 34),  // Green (Spring)
        color(255, 165, 0),  // Yellow-orange (Summer)
        color(173, 216, 230) // **Distinctive icy blue for Winter**
    ];
    frameRate(30);
    generateIcons();
    generateClouds();
}

function draw() {
    if (currentSeason === "spring") {
        background(144, 238, 144);
    } else if (currentSeason === "summer") {
        background(255, 223, 186);
    } else if (currentSeason === "autumn") {
        background(255, 165, 0);
    } else if (currentSeason === "winter") {
        background(100, 150, 200); // **Deeper Frost Blue for Winter**
    }

    drawMountain();
    drawClouds();
    if (!showMoon) {
        drawSun();
    } else {
        drawMoon();
    }
    displayIcons();
    updateIcons();
    updateClouds();

    if (frameCount % 90 === 0) {
        changeSeason();
        generateIcons();
    }
}

function drawMountain() {
    let layerHeight = 50;
    let numLayers = 6;
    for (let i = 0; i < numLayers; i++) {
        let layerColor = getMountainColor(i);
        stroke(layerColor);
        strokeWeight(15 + (sin(mountainProgress + i * 0.5) * 5));
        noFill();
        beginShape();
        for (let x = 0; x < width; x++) {
            let y = sin(x * 0.02 + mountainProgress + i * 0.5) * (100 + i * layerHeight) + 400;
            vertex(x, y);
        }
        endShape();
    }
    mountainProgress += 0.02;
}

function getMountainColor(layerIndex) {
    let seasonIndex = seasons.indexOf(currentSeason);
    if (currentSeason === "spring") {
        return lerpColor(brushColors[1], color(255, 255, 255), layerIndex * 0.1);
    } else if (currentSeason === "summer") {
        return lerpColor(brushColors[2], color(255, 255, 255), layerIndex * 0.1);
    } else if (currentSeason === "autumn") {
        return lerpColor(brushColors[0], color(255, 255, 255), layerIndex * 0.1);
    } else if (currentSeason === "winter") {
        return lerpColor(brushColors[3], color(255, 255, 255), layerIndex * 0.2); // **Stronger white contrast for winter**
    }
}

function drawSun() {
    fill(255, 204, 0, 150);
    noStroke();
    let size = 100 + sin(sunAngle) * 30;
    ellipse(650, 100, size, size);
    sunAngle += 0.02;

    if (sunAngle > TWO_PI) {
        sunAngle = 0;
        showMoon = true;
    }
}

function drawMoon() {
    let moonSize = map(sin(frameCount * 0.1), -1, 1, 50, 100);
    fill(255, 255, 255, 150);
    noStroke();
    ellipse(650, 100, moonSize, moonSize);
    if (frameCount % 24 === 0) {
        showMoon = false;
    }
}

function changeSeason() {
    let nextSeasonIndex = (seasons.indexOf(currentSeason) + 1) % seasons.length;
    currentSeason = seasons[nextSeasonIndex];
    generateClouds();
}

function generateIcons() {
    icons = [];
    let iconSymbol = "";
    if (currentSeason === "spring") {
        iconSymbol = "🌸";
    } else if (currentSeason === "summer") {
        iconSymbol = "☀️";
    } else if (currentSeason === "autumn") {
        iconSymbol = "🍂";
    } else if (currentSeason === "winter") {
        iconSymbol = "❄️";
    }
    for (let i = 0; i < 5; i++) {
        icons.push({
            x: random(width),
            y: random(100, 300),
            speed: random(0.2, 0.5),
            symbol: iconSymbol
        });
    }
}

function updateIcons() {
    for (let icon of icons) {
        icon.y += icon.speed;
        if (icon.y > height) {
            icon.y = random(100, 300);
        }
    }
}

function displayIcons() {
    textSize(32);
    textAlign(CENTER, CENTER);
    for (let icon of icons) {
        text(icon.symbol, icon.x, icon.y);
    }
}

function generateClouds() {
    clouds = [];
    for (let i = 0; i < 6; i++) {
        clouds.push({
            x: random(width),
            y: random(50, 200),
            size: random(60, 100),
            opacity: random(100, 200),
            speed: random(0.5, 1.5)
        });
    }
}

function drawClouds() {
    for (let cloud of clouds) {
        fill(255, 255, 255, cloud.opacity);
        noStroke();
        ellipse(cloud.x, cloud.y, cloud.size, cloud.size * 0.6);
        ellipse(cloud.x + 30, cloud.y, cloud.size * 0.8, cloud.size * 0.5);
        ellipse(cloud.x - 30, cloud.y, cloud.size * 0.9, cloud.size * 0.6);
    }
}

function updateClouds() {
    for (let cloud of clouds) {
        cloud.x += cloud.speed;
        cloud.size += sin(frameCount * 0.01) * 0.5;
        cloud.opacity = map(sin(frameCount * 0.01), -1, 1, 100, 200);
        if (cloud.x > width + 50) {
            cloud.x = -50;
            cloud.y = random(50, 200);
        }
    }
}

Sketch:

Improvements:

I think I can improve a lot with more dynamic visuals and smoother transitions. I will try to include more user interaction that can allow them to do more than just have a ‘watch’ experience. They should be able to have ‘active’ experience as a participant. I could include sounds that mimic the ambiance achieved in  places in South African to make it further immersive.


Reading Reflection: Week #3

In “The Art of Interactive Design” interactivity is defined as “a cyclic process in which two actors alternately listen, think, and speak”.  This approach suggests that the quality of interaction depends on the effectiveness of each subtask. It seems to me then that a strongly interactive system is great in perceiving input, processing it meaningfully, and providing feedback right on time, creating a conversation between user and system.

In my opinion, to create a better user interaction involvement, the artist should be designing elements that not only react to user inputs but also adapt and evolve based on user behavior. For example, incorporating real-time feedback mechanisms can make the interaction feel more engaging.

Apart from that, allowing for user customization and providing clear and simple visual cues can guide users through the interactive experience. This aligns with Crawford’s vision of interactive design as an art form creating meaningful digital exchanges, where the interaction feels like a real conversation between the user and the digital environment.