Week 4: Reading Response

One of the most annoying things that drives me crazy is how frustrating it is to use and deal with printers. For instance, the interfaces on our printers on campus are unnavigable. Simple things, such as wanting to print double-sided, have to be queued from the computer and cannot be changed at all in the printer interface. When the printers run out of paper, they simply error out but do not attempt to reprint once you add more paper. In my opinion, printers should not delete jobs from the print queue until they have been successfully confirmed to have been printed.

I think responsive designs, such as feedback mechanisms as mentioned in the reading, are important for giving users an intuitive sense of how a system will react to their input. For instance, when programming a site, on-hover CSS effects are incredibly helpful for users to understand when an element is clickable. Other techniques, such as user testing, are also crucial, where you watch people use the systems you build. If a user is not able to intuitively figure out how to use something I built, I usually take it as a sign that it’s not as simple as I had originally thought, and that it likely needs to be redesigned.

Week 4: Graduate School Applications

Overview

My concept this week is inspired by the past two semesters (and years) I have spent on graduate school applications. For my data, I sourced a list of self-reported applicant statistics for Computer Science programs. To preprocess the data, I used Python Pandas to drop unnecessary columns and rows that didn’t contain a GPA score. I also truncated the data to 10,000 rows, since I figured that 963,845 data points might be a bit unnecessary for my purposes.

df = (
    pd
    .read_csv('gradcafe.csv')
    .drop(columns=['comment', 'gre_quant', 'gre_verbal', 'major', 'season', 'date_of_result', 'gre_awa', 'date_added', 'applicant_status'])
    .dropna(subset=['undergrad_gpa'])
    .query('decision == "Accepted" or decision == "Rejected"')
    .query('undergrad_gpa <= 4.0')
    .reset_index(drop=True)
)
df[:10000].to_csv('gradcafe_cleaned_10k.csv', index=False)

Discussion

The piece is centered around the at times reductionist nature of graduate school applications, and applications of other natures (e.g., visa applications). These applications often hinge major aspects of your life on how well a sheet of paper communicates your story to the fatigued person reading it on the other side, tasked with reviewing hundreds of applications in a single sitting. The stakes can feel prolific, where years of your life depend on these single decisions. Furthermore, applicants pour their life stories into these applications–providing another level of vulnerability.

I chose to use GPA as the reductionist metric in this case, which appears slowly as the person’s profile disappears. It emphasizes how these applicants, while not in all cases, often get reduced to numbers and metrics to quantitatively compare and evaluate. This process often does not acknowledge the nuance, story, and personhood of applicants.

Code

Week 4 — Assignment

Ideation / Research

I first started off with wanting to pursue an idea that was artistic but also made sense in terms of its value as data visualization. I personally believe that data visualization is a great way to tell a story and send a message, whether it be sociopolitical or otherwise. First, I had to find a dataset (.csv file) that I wanted to work with. For this, I went to a website called Kaggle which had a bunch of fun and interesting data files for users to download for free. After browsing around for a while, I came across one that had the nutritional information of 80 different cereals, presumably in the US. In another class, I had a discussion with a fellow student who told me that in the US, many food products, despite appearing diverse, are owned by only a handful of companies, essentially being a market full of monopolies. Given that the US prides itself on how democracy fosters free markets, I was surprised to learn that monopolies exist within this system, as they seem to contradict the principles of a free market. To explore this contradiction, I decided to use the cereal.csv dataset to create a visualization that highlights the monopoly in the cereal industry. Each animation and effect is designed with a particular purpose, conveying meaningful insights about this issue.

Process / Code Review

For the cereal nodes, I wanted their colors to reflect their sugar content, making it easy to visually interpret how much sugar each cereal contains. To do this, I used the ‘map()’ function to scale the red intensity based on the sugar level, where low-sugar cereals are black and higher sugar cereals appear redder than black. This creates an intuitive color gradient that emphasizes the nutritional differences between cereals.

  for (let cereal of cereals) {
    let sugarLevel = cereal.sugar; // scale from 0-15
    let redColor = map(sugarLevel, 0, 15, 0, 255); // more sugar = more red
    fill(redColor, 50, 50); // red tones based on sugar content
    ellipse(cereal.x, cereal.y, 10, 10);
  }
}

To connect each cereal to its parent company, I created animated lines that gradually extend from the manufacturer to each cereal. Instead of appearing all at once, the lines animate over time, emphasizing the idea of hidden connections between brands that aren’t immediately obvious.

animationProgress = min(animationProgress + 0.02, 1); 

// drawing animated connections
stroke(0, 0, 0, 100); 
for (let link of links) {
  let midX = lerp(link.start.x, link.end.x, animationProgress);
  let midY = lerp(link.start.y, link.end.y, animationProgress);
  line(link.start.x, link.start.y, midX, midY);
}

Finally, I added subtle movement to the cereal nodes. Each one has a slight floating effect, created by modifying its x and y positions with sine and cosine functions. This gives the visualization a dynamic, organic feel rather than a static diagram. The manufacturers remain fixed, symbolizing their stronghold over the market, while the cereals drift slightly, reinforcing the idea that individual brands may seem independent but ultimately remain tied to their parent companies.

// floating effect for cereals
 for (let cereal of cereals) {
   cereal.x += sin(frameCount * 0.01 + cereal.offset) * 0.5;
   cereal.y += cos(frameCount * 0.01 + cereal.offset) * 0.5;
 }

+ Additionally, when hovering over a manufacturer, its abbreviated initials expand to reveal the full company name. This design choice symbolizes how large corporations often remain anonymous at first glance, its domineering presence only becoming recognizable when we, as consumers, dig deeper.

Reflection

Surprisingly, the hardest part of this assignment was actually loading and properly parsing the csv file. As you can also see in the code, there’s a good amount of debugging that for the csv file. Initially I had use ‘loadString()’, however, I quickly realized that ‘loadString()’ treats the CSV as a single string rather than structured data, making it difficult to extract individual values. To fix this, I switched to ‘loadTable()’ with the “csv” and “header” options enabled, which allowed me to access data in a more organized way using column names. Even after switching to “loadTable()”, I ran into issues where some rows had missing or improperly formatted values. To handle this, I added debugging statements, such as console.log(table.columns); to check the structure and console.warn() messages to flag any problematic rows. I also included a check for undefined or null manufacturer values to prevent errors from breaking the program. Overall, I think I really enjoyed doing this project because I felt like I was able to incorporate a lot of meaning into it. Through the process, I realized that I particularly find interest in embedding social commentary in my works. I think adding a bit more interactivity could be the next step.

Final Work

Week #3 – Reading Response

Interactivity is just like having conversation over a cup of tea. That might be an exaggeration, unless of course if you happen to be a Brit!

After having done the reading, I could almost immediately sense that the author is try to compare interactivity to conversation. In the reading, the author describes it as a ‘cyclic process’ which happens like a conversation does between more than 1 person, which involves ‘listening’,’thinking’, and ‘speaking’. Interactivity deals with all 3 spaces, therefore isn’t just limited to user input. Just like the metaphorical example of having a conversation, the computer too should interact with the user. It requires a purposeful exchange. Interactivity within itself is not a boolean value, therefore isn’t limited to a confined standard (objectiveness), but should however perform as per the context of information being provided! Some designs are bound to be interactive such as game media. while for some, interactivity is kept a low level to give user time to ‘think’. Overall, I think a strong interactive media shouldn’t limited to a certain logical function. Creativity and rationale go hand in hand , and in my opinion should complement each other, rather one snubbing away the other. Therefore  a strong interactive system should be clear in its approach and interaction,  should incorporate multimodal output to an appropriate extent, and should resonate emotions to the user, as well as perceive them just like a conversation!

Since the start, I have made sure to incorporate certain extent of interactivity into my sketches by including animations, color variance, mouse-click, spontaneity, etc. Yet still, after having read the reading, I realized that I do happen to miss out on opting for other media domains like sound and more importantly, the fluidity! Despite the mouse click, I should work on timing towards feedback to users input, and add certain constraints along side parameters to avoid haphazard response by the design incase the user makes mistake such as a double click! By incorporating textual elements and walking users through a manual or something, built into the sketch can also improve my sketches. Last but not the least, the conversation/ interaction should be open to all. Therefore, people with conditions like ‘photo-phobia’, ‘color-blindness’, ‘partial-vision’ can also be accommodated in my future design by providing options to adjust the graphics to a certain manner to their liking.


Weekly Assignment #3 – OOP and Array

Introduction:

Being an extrovert doesn’t come in as easy as it seems to be. Everyday we meet new people at different places, be it at the bus stand, mall, university, etc. With some of these, we end up forming some sort of relationship, whilst with some, that meeting ends that very day of having met them. I love talking to new people and getting to know them. Some people resonate with the same energy and others simply happen to pass over the opportunity.

Inspiration and ideation (Basic Hand-Drawn Sketch):

With this assignment, I wanted to communicate the idea of our lives ‘circling around the lives of others’. Sometimes it circles for longer, sometimes for very short period of time. During class we learnt how to draw balls bouncing within a confined space. I wanted to use the same aesthetics, represent people’s lives with circles. However, there is a catch! The circles themselves should circle around other circles circling inside a circle! Unintentional tongue twister? I guess so! I drafted a basic sketch on my iPad and hoped right onto my computer to code my idea.

The basic sketch I drew:

The static drawing couldn’t fill my appetite, so I switched over to using math. I recall watching certain tutorial video by our beloved ‘Coding Train’ youtube channel. You can watch the video by clicking on the link. I borrowed some coding inspiration from him, but had to draft my own coding logic to adapt to a much more dynamic style of spiral. I used the following mathematical logic to construct the clockwise spiral:

How to interact:

The program starts off with just ten spirals. Upon mouse click, it adds 5 more spirals (peoples) into our lives. The black canvas color represents the back of our mind.

Result:

Code I am proud of:

let spirals = []; // global array variable
let totalSpirals = 10; //start wtih 10 spirls.
// The Spiral class draws shapes along an outward spiral path
class Spiral {
  constructor(xpos, ypos) {
    // Center of the spiral
    this.cx = xpos;
    this.cy = ypos;
    // Starting angle and radius
    this.angle = random(TWO_PI);
    this.radius = 0; // begins with a zero radius
  
    this.rotationSpeed = random(0.05, 0.2); // speed of the spiral
    this.radiusIncrement = random(1, 3); // increases the cirlce radius
    
    this.shapeDim = random(10, 30); // size of each circe
   
    this.r = floor(random(255)); // random color assigned
    this.g = floor(random(255));
    this.b = floor(random(255));
  }
  
  update() {
    this.angle += this.rotationSpeed;
    this.radius += this.radiusIncrement;
    
    //math formula to calculate the circular movement
    let x = this.cx + this.radius * cos(this.angle);
    let y = this.cy + this.radius * sin(this.angle);
    
    if (x < 0 || x > width || y < 0 || y > height) {
      this.radius = 0;
      this.cx = random(width); // when circle moves.  out of the scren,
                              // randomly place it 
      this.cy = random(height);
    }
  }
  
  display() {
    
    let x = this.cx + this.radius * cos(this.angle);
    let y = this.cy + this.radius * sin(this.angle);
    
    noStroke();
    fill(this.r, this.g, this.b);
      circle(x, y, this.shapeDim); // drawing circle
  }
}

function setup() {
  ///
}

function draw() {
//
  
}

function mouseClicked() {
 //
}

In particular, the class and constructor function is something I got right after debugging and going through trial and error. To be even more precise, increase the angle depending on the speed as well planting a new circle  is my greatest achievement in this assignment, demonstrated by the following code :

  update() {
    this.angle += this.rotationSpeed;
    this.radius += this.radiusIncrement;
    
    //math formula to calculate the circular movement
    let x = this.cx + this.radius * cos(this.angle);
    let y = this.cy + this.radius * sin(this.angle);
    
    if (x < 0 || x > width || y < 0 || y > height) {
      this.radius = 0;
      this.cx = random(width); // when circle moves.  out of the scren,
                              // randomly place it 
      this.cy = random(height);
    }
  }


My mental state:

Future Improvements:

Make the trail pattern more visible, and use a different color scheme to give a glowing neon-like effect.

Week 3

Week 3 – Generative Artwork

Concept:

For my generative artwork, I was inspired by the simplicity and elegance of moving lines. The lines move in different directions across the canvas, creating a dynamic and constantly  changing composition. My idea was to explore motion, angles, and structure through minimalistic elements. The intention was to create an engaging visual using key programming concepts including functions, arrays, and object-oriented programming. I also wanted to implement an element of randomness, which is a concept we looked into last week. Through this, I believe the artwork can maintain a balance between structure and unpredictability, making each frame unique.

Code highlight: 

I needed to ensure that when a line moves across the canvas, it stays within the visible area instead of disappearing off the screen. 

// Keeps the lines inside the canvas
   if (this.x > width || this.x < 0) this.speedX *= -1;
   if (this.y > height || this.y < 0) this.speedY *= -1;


Challenges:

While I was creating this artwork, I faced some challenges. The first one was that initially, some of the lines would move off the screen permanently, which is not what I wanted. However, I overcame this by making them reverse their direction upon hitting the canvas boundaries. Additionally, at the start it was difficult making sure that I had the right balance between movement speed and line length. In order to ensure that the art was more visually engaging, I experimented with changing colours over time using frameCount % (). 

Future Improvements:

For the future, I would like to include more engaging elements to the artwork. For example, I could include more user interaction, like clicking to create new lines. Also, I would also like to also include more variations in stroke weight so that the final art has more added depth. Overall, this assignment has allowed me to explore generative art through the use of structured randomness, while also using key programming concepts in P5.js.


Reading response: 

To me, a strongly interactive system is characterised by intuitive user control, real-time responsiveness, meaningful feedback, adaptability, and finally, engagement. The system should have a dynamic feeling to it, where the users are able to influence the outcomes in both a seamless and rewarding way. Additionally, I believe the system should also anticipate and predict the user’s needs, be able to adjust to various inputs, and also provide a clear visual or auditory cue to ensure that users effectively understand their interactions. Interactivity is extremely important because it keeps the users invested and engaged with the system. For example, some interactive systems respond to user movement, which creates a personalised experience, making the users more invested and engaged with it. These are principles that can be applied to many disciplines, including education, entertainment, and digital art, as they help make more meaningful and engaging interactions. 

For my p5.js sketches, I could add a few elements to improve the user interaction in them. First, I could include real-time input, where I may use mouse movement, touch, or voice commands to affect the visuals. This is connected to adding more dynamic feedback, where the visual or auditory cues respond to user actions. Additionally, I could implement more adaptive elements, where various objects react differently based on the user’s behaviour. Lastly, I could include techniques that introduce elements like challenges or rewards in order to enhance engagement. By implementing these improvements, my p5.js sketches can become more interactive and also more immersive, engaging, and intuitive, which aligns with the principles of a well-designed interactive system.

Assignment #3 – Functions, Arrays, and OOP

1. Concept

As I have experienced implementing OOP before, I was supposed to be extra challenged with creativity. I brainstormed various ideas:

  1. drawing a large galaxy spiral, planets and regular shapes (squares, triangles) on the canvas
  2. intially an all black canvas except potentially the area around the cursor which can “glow” and reveal dots that are part of a representation of face portrait. integrate interesting elements such as planets as earrings.
  3. Using Weighted Voronoi Image Stipling – this looked cool but I couldn’t see a way to use OOP with it.

The challenge in this process was trying to avoid generic ideas. Based on the reading for this week, interactive design is important. So I considered ideas for it, especially idea 2:

  • change colour of features (eg. hair) based on music
  • ask user to put in music file
  • upon user’s click, display new art with dots closely resembling image input

But the problem with it was that idea 2 would take so much time. I had learned from the first assignment that I should plan on a project that appears objectively doable/achievable within the time constraint. I found the ideation phase time-consuming and particularly challenging, and discussion with friends was helpful. I decided that the ideas I had brainstormed could be stored and used instead for a later assignment. I decided to use simple objects where I could implement OOP.

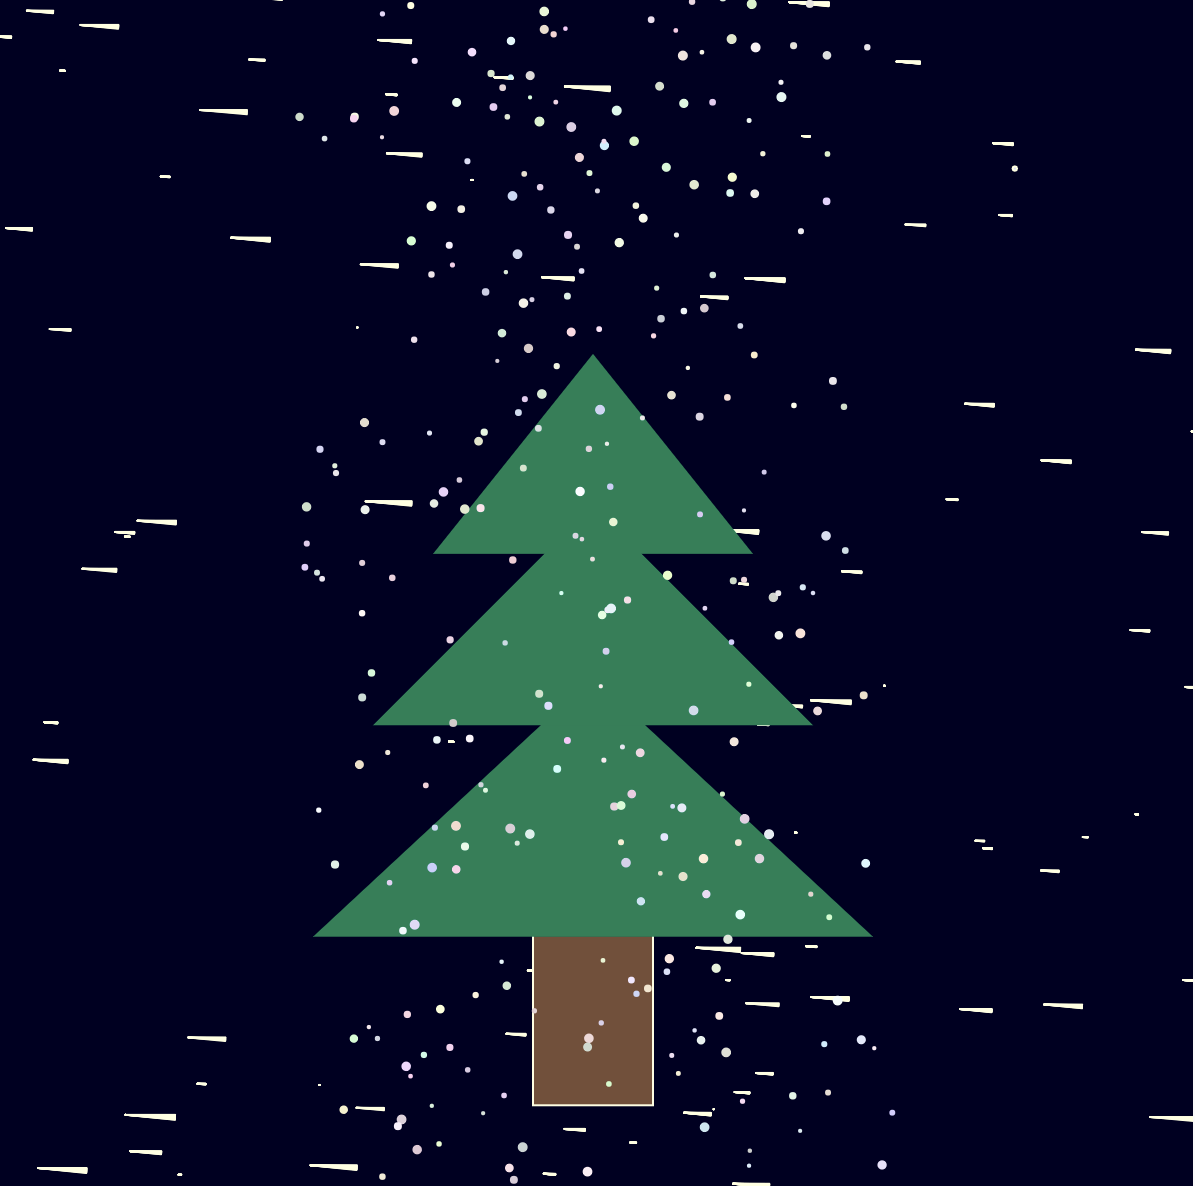
The concept for my art is “PARTY TIME.” It displays an evergreen tree with snow in the winter season. There needs to be a Tree class and Snow class. Since multiple snowballs are used, an array can be used to store snow objects. I wanted to try twinkling lights (if time permits).

2. Code Highlights

I started with creating the Tree class. A simple evergreen tree could be represented using three green triangles for its leafy parts (of increasing size as you go downwards) and one brown rectangle for the wooden trunk. So I defined attributes for each triangle’s top point x-coordinates and y-coordinates. At Professor Shiloh’s advice, I tried not to hard-code the numbers in.

class Tree {
  constructor() { 
    this.topTriangleTopX = width/2;
    this.topTriangleTopY = (2 / 7) * height + 10;
    this.middleTriangleTopX = width/2;
    this.middleTriangleTopY = (3 / 7) * height;
    this.bottomTriangleTopX = width/2;
    this.bottomTriangleTopY = (4 / 7) * height;
    this.woodCenterX = width/2;
    this.woodCenterY = (6/7) * height;
    this.woodWidth = width/10;
    this.woodHeight = height/7;
    this.color = color('hsb(160, 100%, 50%)');
  }
  ...
}

At first I created a Snow class. The idea was to have falling circles representing falling snowballs. But the issue was that my draw function would draw one row of falling circles that falls together. Even if I were to place a function to set these circles back to the top of the canvas when it reaches the ground, the prime issue is that between the time the snow moves from the top to the bottom of the canvas, there is only one row of snow falling. This was not lifelike at all.

There was one thing to appreciate, though, which was that the snow didn’t move in a straight-down manner, it could move leftward or rightward as it moved down, which was pretty realistic.

class Snow {
  constructor(xSpeed0, ySpeed0) {
    this.xPos = random(0,600);
    this.yPos = 20;
    this.xSpeed = random(-1,1);
    this.ySpeed = 
    this.diameter = 10;
  }
  move() {
    // move the ball
    this.xPos += this.xSpeed;
    this.yPos += this.ySpeed;
  }
  draw() {
    fill(255);
    noStroke();
    circle(this.xPos, this.yPos, this.diameter);
  }
}

To resolve this issue, I researched online. I found that p5js had a Snowflake class, which worked pretty similarly. I really appreciated its organic-ness that was beyond my attempt – it used a sine function to create a wavy falling down motion akin to being affected by wind – which, I have to say is pretty incredible to see even after watching it multiple times.

I played around with the Snowflake class, experimenting and researching to find out what some line does, and keeping what I liked. For instance, I watched a Khan Academy video to understand angular speed and changed it to 0 (snow falls down straight) and 100 (the rotational movement of the snow was super obvious which I didn’t want). The value 35 was nice so I kept it. I also learned that different size snowflakes fall at different y speeds, smaller snowflakes fall faster while bigger snowflakes fall slower using an equation with a graph that has a similar shape to 1/x graph.

class Snowflake {
  constructor() {
    this.posX = 0;
    this.posY = random(-height, 0);
    this.initialAngle = random(0, 360);
    this.size = random(2, 5);
    this.radius = sqrt(random(pow(width / 4, 2)));
    this.color = color(random(200, 256), random(200, 256), random(200, 256));
  }

  update(time) {
    // Define angular speed (degrees / second)
    let angularSpeed = 35;

    // Calculate the current angle
    let angle = this.initialAngle + angularSpeed * time;

    // x position follows a sine wave, using the parametric equation for x coordinate (x = r sin(theta))
    this.posX = width / 2 + this.radius * sin(angle);

    // Different size snowflakes fall at different y speeds, smaller snowflakes fall faster while bigger snowflakes fall slower using an equation with a graph that has a similar shape to 1/x graph
    let ySpeed = 8/this.size;
    this.posY += ySpeed;

    // When snowflake reaches the bottom, move it to the top
    if (this.posY > height) {
      this.posY = -50;
    }
  }

  display() {
    fill(this.color);
    noStroke();
    ellipse(this.posX, this.posY, this.size);
  }
}

For the stars, I tried to use a starry night source code. But as I tried to integrate it, I faced an issue which I couldn’t resolve, even after debugging attempts (by following p5js instructions: p5.js says: you have used a p5.js reserved function “currentTime” make sure you change the function name to something else.) and using AI. I couldn’t get the stars to appear and dynamically expand and contract as they should – they just seemed like dashes.

Once I moved the background color of the canvas from the draw() to setup(), I found that you can see the trailing movements of the canvas. It was supposed to be a bug, and I knew how to resolve it, but since I thought this looked so cool, I decided to keep it. I took out the stars, and used the trailing, colourful snow as the main cool and creative feature.

A slight dynamic element is a trailing cursor 🙂

3. Embedded sketch

4. Reflection and ideas for future work

There are several important experiences I had through this art process. Personally, I was able to create the snowfall animation that I had wanted to try from week 1, was able to meet my goals of implementing OOP, arrays and functions. Since I couldn’t add the music, I hope to try that in the upcoming week(s).

This work could be further extended through expanding the concept and adding design interactivity. One idea I have is that at the user’s click, the seasons would change, showing summer, fall, winter and spring, with the music changing based on Vivaldi’s Four Seasons piece. I love the idea of music complementing the visuals.

Week 3, reading response, Mustafa Bakir

The essence of a highly interactive system lies in its ability to fluidly engage with the user, accommodating diverse input methods that extend beyond conventional interactions such as keyboard strokes and mouse clicks. True interactivity is achieved through multisensory engagement, fostering deeper immersion by allowing users to communicate with the system in a more intuitive and natural manner. However, interactivity is not merely about designing creative input methods—it is about the system’s capacity to interpret, respond to, and, in a sense, “perceive” the nature of the input it receives. A truly interactive system should not only register commands but also discern the context, intent, and even emotional nuances behind them, refining its responses accordingly.

In my approach to integrating interactivity within my p5.js sketches, I aim to incorporate machine learning principles that expand the range of possible user inputs beyond simple mechanical interactions. Rather than restricting engagement to direct physical actions like clicking or typing, my goal is to develop a system that can process complex, multidimensional input—such as emotional states, gestures, or vocal inflections—enabling a richer and more intuitive experience. One potential interactive art concept would involve a dynamic piece that changes color, form, or composition based on the emotional state of the person viewing it. By leveraging machine learning to analyze facial expressions, body language, or even biometric data, the artwork could evolve in real time, creating a deeply personal and immersive interaction between the observer and the digital medium.

OOP Class 3

Concept: Blooming Emoji Garden

The Blooming Emoji Garden is a generative artwork that simulates a lively, interactive garden filled with animated emojis. The artwork is inspired by the beauty and dynamism of nature, where flowers bloom, insects flutter, and life interacts in playful and unexpected ways. Using Object-Oriented Programming (OOP) in p5.js, the piece brings together a collection of emojis that grow, rotate, and interact with each other, creating a vibrant and ever-changing visual experience.


Highlight of Code: Dynamic Interactions with checkNeighbors()

One part of the code I’m particularly proud of is the checkNeighbors() method in the BloomingEmoji class. This method enables the emojis to interact with each other in a dynamic and organic way. Here’s the code snippet:

checkNeighbors(shapes) {
  for (let other of shapes) {
    if (other !== this) { // Avoid self-comparison
      let d = dist(this.x, this.y, other.x, other.y); // Distance between emojis
      if (d < (this.size + other.size) / 2) { // If emojis overlap
        this.growthRate *= 0.99; // Slow down growth
        this.x += random(-2, 2); // Add a little jiggle
        this.y += random(-2, 2);
      }
    }
  }
}


Why I’m Proud of It:

  • Dynamic Behavior: This method makes the emojis feel alive. When they overlap, they jiggle and slow down their growth, creating a sense of connection and interaction.
  • Performance Optimization: Despite checking interactions between all emojis, the method is efficient enough to run smoothly with up to 50 emojis.
  • Organic Feel: The randomness in the jiggle (random(-2, 2)) adds an organic, natural feel to the interactions, making the garden feel more alive.

Embedded Sketch

You can interact with the Blooming Emoji Garden below. Click anywhere on the canvas to add new emojis and watch them grow, rotate, and interact!


Reflection and Ideas for Future Work

What Worked Well:

  • The use of emojis made the artwork visually appealing and accessible.
  • The interactions between emojis added a layer of complexity and engagement.
  • The user interaction (click to add emojis) made the artwork feel participatory and fun.

Challenges:

  • Performance became an issue with too many emojis. Optimizing the checkNeighbors() method was crucial.
  • Balancing randomness and control was tricky. Too much randomness made the garden feel chaotic, while too little made it feel static.

Ideas for Future Improvements:

  1. More Emojis and Variety:
    • Add more emoji types, such as animals, weather symbols, or food, to make the garden even more diverse.
  2. Advanced Interactions:
    • Introduce different types of interactions, such as emojis “attracting” or “repelling” each other based on their type (e.g., bees attracted to flowers).
  3. Sound Effects:
    • Add sound effects, like buzzing for bees or rustling for flowers, to enhance the immersive experience.
  4. Garden Themes:
    • Allow users to choose different garden themes (e.g., desert, forest, underwater) with corresponding emojis and backgrounds.
  5. Mobile Optimization:
    • Make the artwork responsive and touch-friendly for mobile devices, so users can interact with it on the go.
  6. Save and Share:
    • Add a feature to save or share the garden as an image or animation, so users can preserve their creations.

Conclusion

The Blooming Emoji Garden is a playful and dynamic generative artwork that combines the beauty of nature with the whimsy of emojis. It’s a testament to the power of Object-Oriented Programming and creative coding in p5.js. With its engaging interactions and endless possibilities for customization, the garden invites users to explore, create, and imagine. 🌸🐝🦋

Week 3 – GeneraTime (Generative)Art

Concept

I drew inspiration for this project from observing a wall clock. I saw an opportunity to apply what I had learned about arrays and classes by representing the minutes, hours, and clock arms as objects, classes, and arrays. However, I wanted to create something more dynamic and artistic. While searching online for inspiration, I came across several visuals that influenced my design.

Additionally, I used this project as an opportunity to improve my skills in color gradients. Implementing the desired background gradient took time, but it was a rewarding learning experience. One of the challenges I faced was not saving my work frequently, leading to lost progress and the need to start over. Another difficulty was choosing and balancing colors effectively.

Code Highlights

Below are some of the key sections of my code that I am particularly proud of, along with a brief explanation of their functionality:

class ClockArms {
  constructor() {
    this.p = 0;
    this.q = 0;
    this.angle = 0;
  }

  centreCircle() {
    fill(255, 0, 0);
    noStroke();
    circle(this.p, this.q, 30);
  }

  longarm() {
    let armLength = 150;
    let t = this.p + armLength * cos(this.angle);
    let s = this.q + armLength * sin(this.angle);
    let m = this.q + r * cos(this.angle);
    let n = this.q + r * sin(this.angle);
    stroke(255);
    strokeWeight(4);
    line(this.p, this.q, t, s);
    fill(255);
    noStroke();
    circle(m, n, 10);
  }

  update() {
    this.angle = map(frameCount % 360, 0, 360, 0, TWO_PI);
  }

In the code above, I created a class that implements the functionality of a clock, including the movement of the clock hand.

for (let i = 0; i < drawnMarkers.length; i++) {
  smallCircles(myCircles[drawnMarkers[i]].x, myCircles[drawnMarkers[i]].y);
}

In the code above, I used arrays to display the hour markers one by one.

Reflection and Future Improvements

Moving forward, I plan to utilize Perlin noise to create more visually interesting sketches. I also considered making this an actual working clock that tells time, but for now, that wasn’t my MVP (and I ran out of time!). Additionally, I aim to learn how to efficiently manage color schemes for accessibility, ensuring that my designs are not only visually appealing but also usable by a wider audience. By continuously experimenting with different color effects and combinations

Click to change the background image!