Hand-Drawn Shapes Recognition System
Project Overview
Please find code on my github repository
The Hand-Drawn Shapes Recognition system is an innovative interactive desktop application that combines computer vision and machine learning to recognize shapes drawn by users in real-time. The project emerged from the recognition that while humans can easily identify simple hand-drawn shapes, creating a computer system to replicate this capability presents significant challenges due to variations in drawing styles, imprecisions, and the inherent ambiguity of hand-drawn content. The system addresses these challenges through a sophisticated hybrid approach that leverages both traditional computer vision techniques and modern machine learning methods.
At its core, the application provides users with an intuitive drawing canvas where they can create shapes using either a mouse/touchpad or a connected Arduino controller. Once a shape is drawn, the system processes the image using OpenCV for preliminary analysis and contour detection, then employs a dual-recognition strategy combining geometric feature analysis with an SVM classifier to identify the drawn shape with high accuracy. This hybrid approach enables the system to recognize various shapes even with limited training data, making it both powerful and adaptable to individual users’ drawing styles.
Beyond mere recognition, the system offers a conversational interface that provides dynamic feedback based on recognition confidence and established interaction patterns. The application continually improves its recognition capabilities through user feedback, saving labeled drawings to a training database and supporting incremental model training in the background, effectively “learning” from each interaction.
System Architecture
The system employs a modular architecture with clearly defined components that handle specific aspects of the application’s functionality. This approach enhances maintainability, supports extensibility, and simplifies the debugging process. The architecture consists of four main component categories: Core Components, UI Components, Data Management, and Hardware Integration.
The core components form the backbone of the application’s functionality. The Recognition System serves as the central element, implementing the hybrid approach to shape recognition. It orchestrates the entire recognition process from image preprocessing to final shape classification. This component contains several specialized classes including the DrawingRecognizer that coordinates the recognition workflow, the ShapeFeatureExtractor for deriving geometric and statistical features from contours, the ShapeClassifier for machine learning classification, and the GeometricAnalyzer for traditional computer vision approaches to shape identification.
Supporting the recognition system, the Drawing Manager bridges the UI and recognition system, managing drawing operations and history tracking. The Conversation Manager handles the AI assistant’s responses, providing dynamic, context-aware feedback based on recognition results and interaction history. The Text-to-Speech component adds an auditory dimension to the user experience, verbalizing the AI assistant’s responses through multiple TTS engine options.
The UI components provide the visual interface through which users interact with the system. The Main Window contains the primary application interface, housing the drawing canvas and AI response display. The Canvas component serves as the interactive drawing surface, handling mouse events and supporting features like undo/redo, zoom, and grid display. Complementing these elements, the Toolbar offers access to drawing tools such as color selection and pen size adjustments, while various dialog screens provide access to settings, training data management, and shape labeling.
Data management components ensure persistence and organized data handling. The Database Interface manages data storage using SQLite, maintaining records of user settings, labeled shapes, and drawing history. User Settings handles application preferences, while Drawing History tracks past drawings and recognition results, allowing users to review their progression over time.
Recognition Technology
The recognition technology represents the system’s most sophisticated aspect, implementing a dual-approach strategy that combines traditional computer vision techniques with machine learning. This hybrid methodology provides robust baseline performance through geometric analysis while continuously improving through machine learning from user interactions.
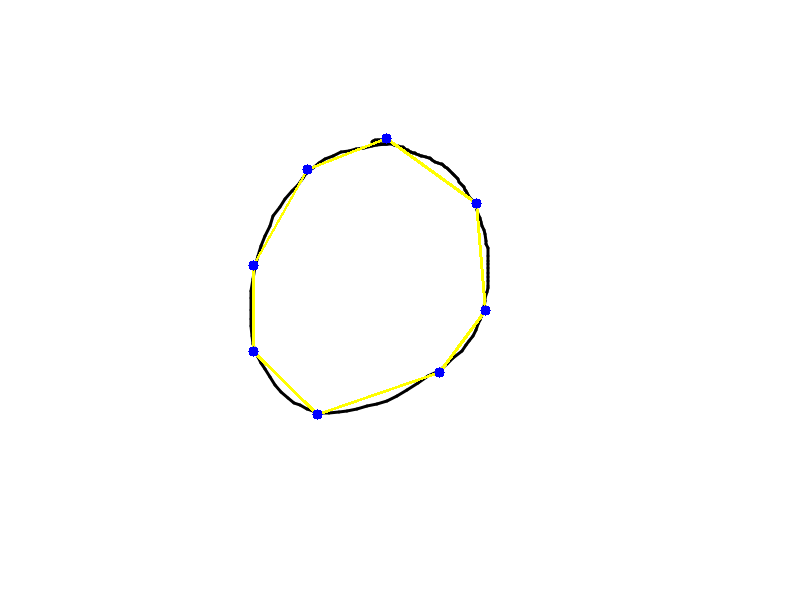
The recognition process begins with image preprocessing, where the drawn shape is converted to grayscale, Gaussian blur is applied to reduce noise, and adaptive thresholding creates a binary image. The system then performs contour detection using OpenCV to identify shapes within the image, extracting the largest contour as the primary shape of interest. This approach effectively isolates the intended shape even when the drawing contains imperfections or stray marks.
Feature extraction forms the next critical step in the process. The ShapeFeatureExtractor class derives a comprehensive set of geometric and statistical features from the identified contour. These features include basic metrics such as area, perimeter, and bounding box dimensions; shape properties including circularity, convexity, and solidity; moment-based features like Hu Moments that provide rotation, scale, and translation invariance; multiple levels of contour approximation; corner analysis examining count, angles, and distributions; symmetry analysis measuring vertical and horizontal symmetry; and enclosing shape analysis testing fit against geometric primitives.
With features extracted, the GeometricAnalyzer applies traditional computer vision approaches to classify the shape. This component implements specialized detectors for common shapes like rectangles, triangles, ellipses, and hexagons. Each detector analyzes the extracted features against known geometric patterns, calculating confidence scores that reflect how closely the drawing matches each potential shape type. This rule-based approach provides strong baseline recognition even before machine learning is applied.
The machine learning component, implemented in the ShapeClassifier class, adds another dimension to the recognition process. Using scikit-learn’s LinearSVC as the primary classifier, the system categorizes shapes based on their extracted features. The classification pipeline includes feature standardization to normalize values to zero mean and unit variance, feature selection using ANOVA F-value to focus on the most discriminative attributes, and finally, classification with LinearSVC including class balancing to handle imbalanced training data. This approach yields high accuracy even with limited training examples.
The final recognition decision combines results from both approaches. Geometric analysis provides baseline recognition scores, while machine learning classification results receive higher weighting when available. Confidence scores are normalized and ranked, with the system returning the top guesses along with their confidence levels. This dual-approach strategy leverages the strengths of both paradigms, producing recognition that is both accurate and continuously improving.
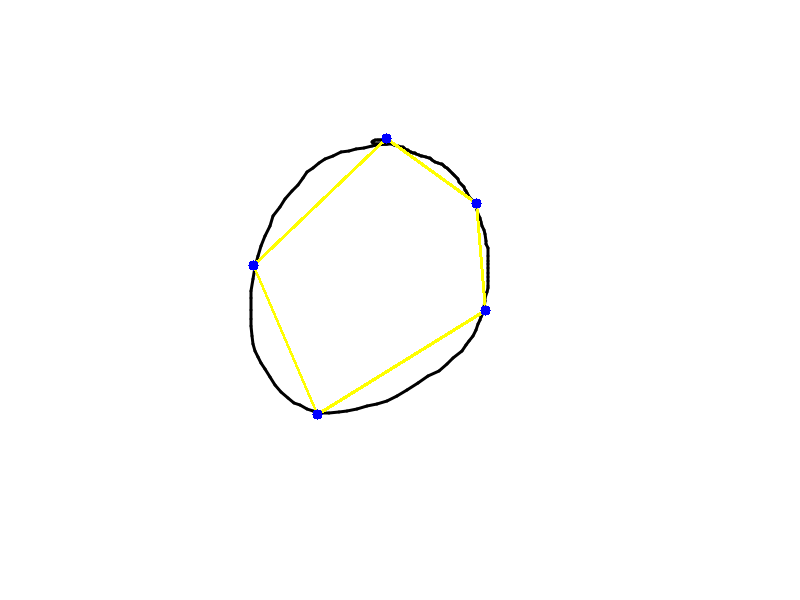
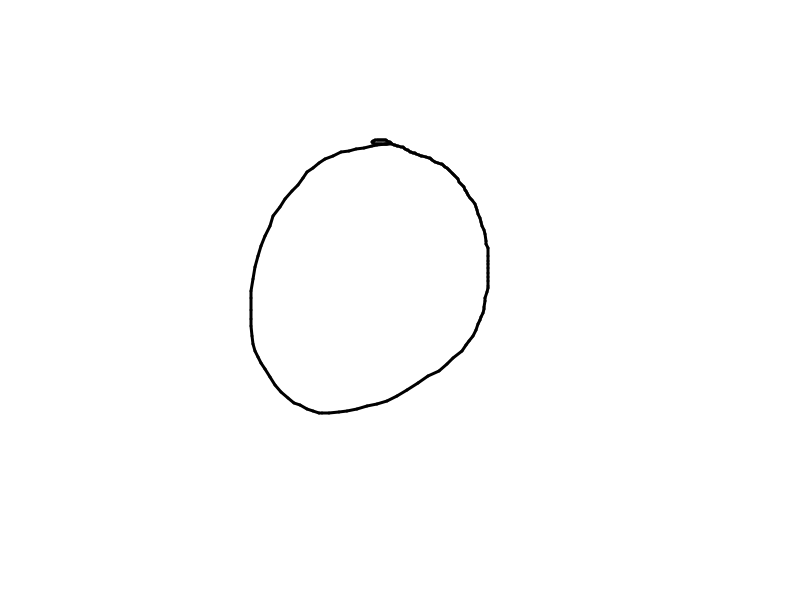
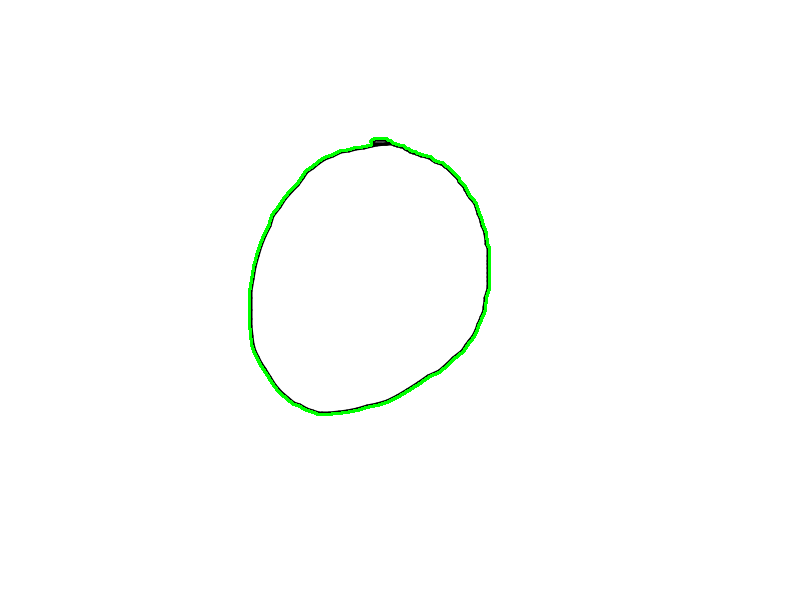
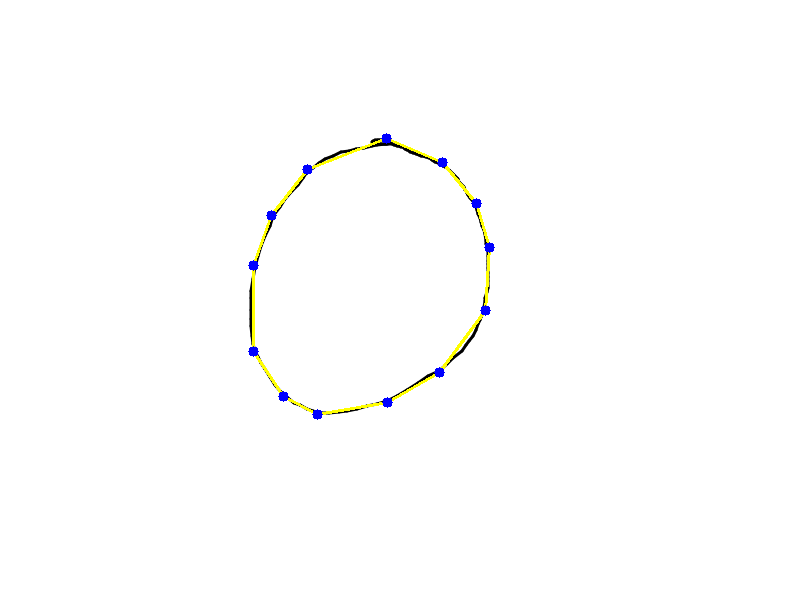
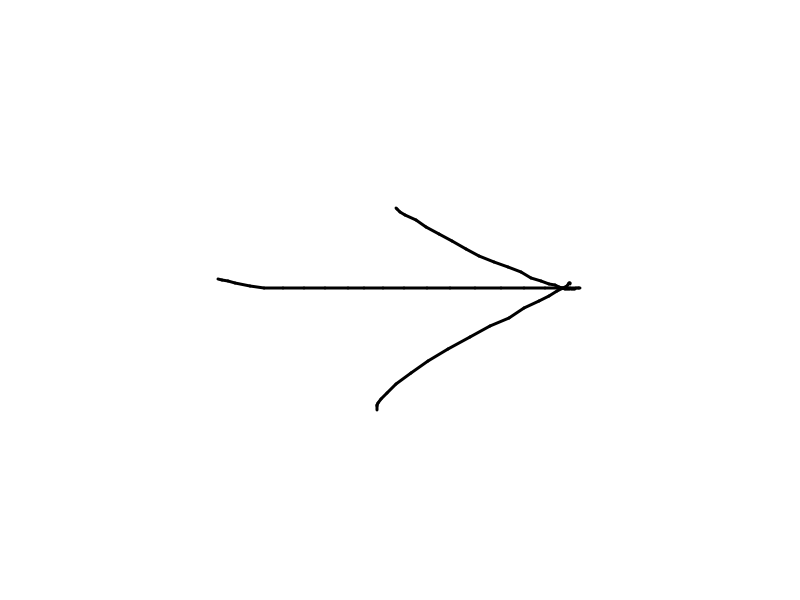
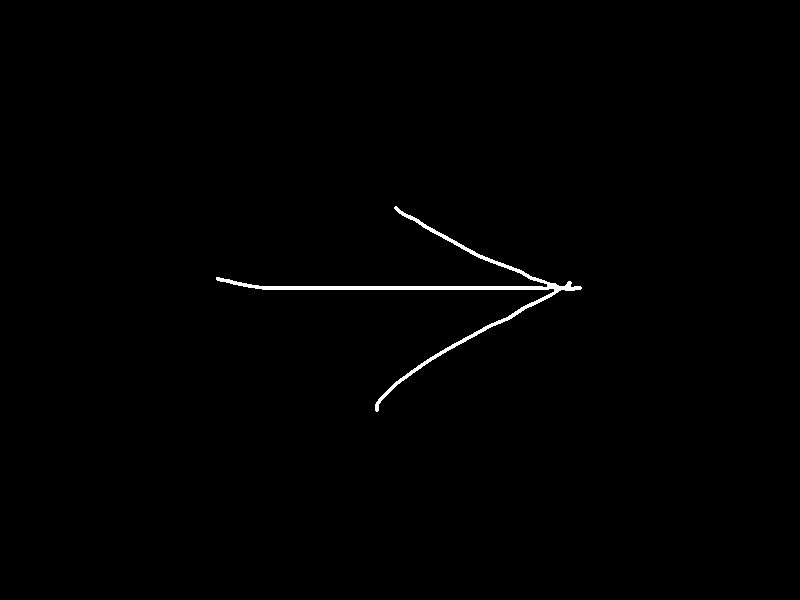
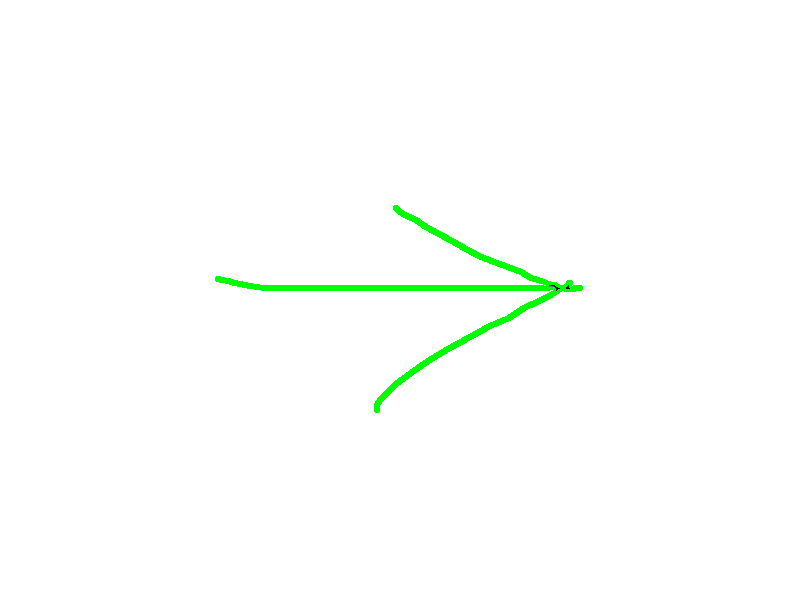
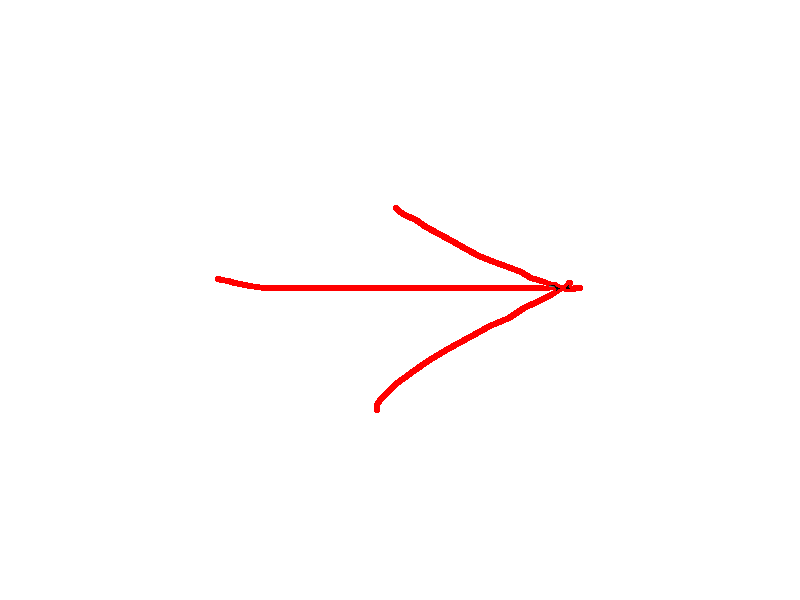
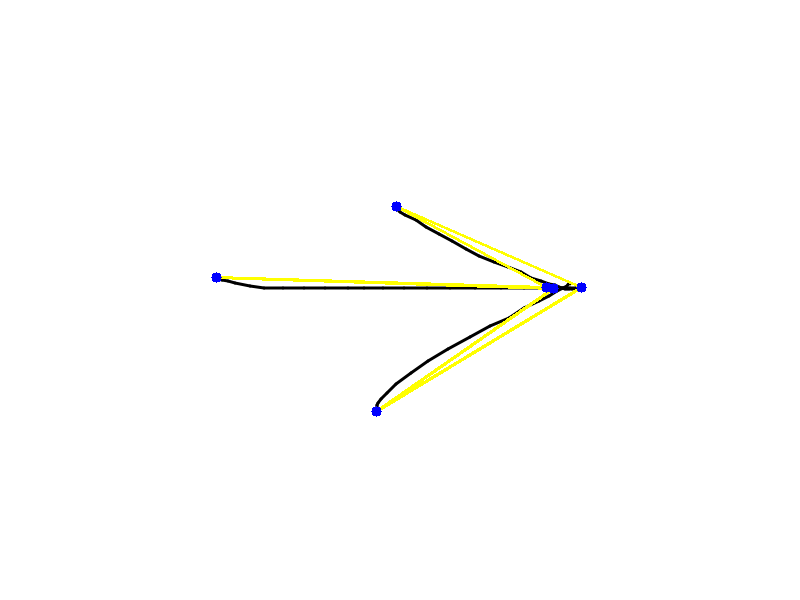
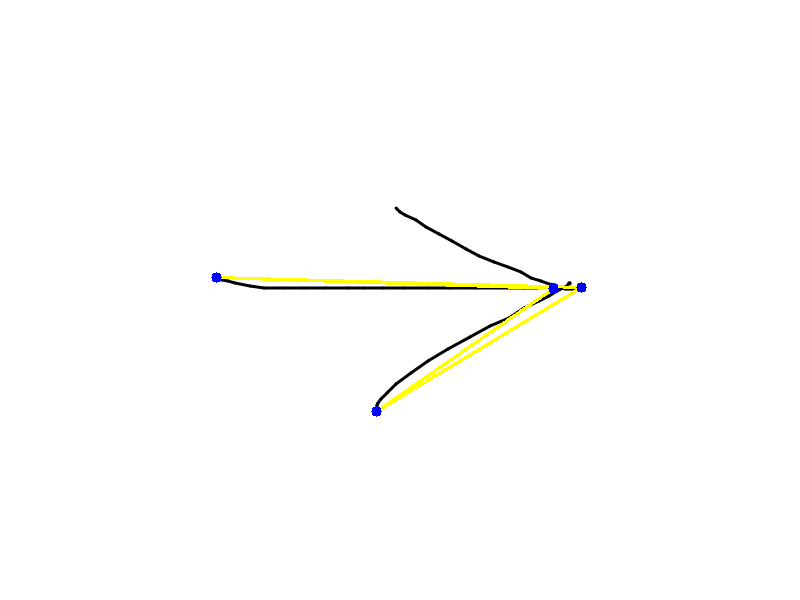
Here’s an example of debug images
User Interface


The user interface prioritizes intuitive interaction while providing access to the system’s advanced capabilities. Built with PyQt5, the interface combines simplicity with functionality to accommodate both novice and experienced users. The UI consists of several key elements designed to work together harmoniously while maintaining a clear separation of functions.
The drawing canvas serves as the primary interaction point, providing a responsive surface where users can create shapes. The canvas supports freehand drawing with customizable pen properties including color and thickness. Drawing operations benefit from features like undo/redo capability (supporting up to 50 steps), zoom and pan functionality for detailed work, optional grid display for alignment assistance, and pressure sensitivity support for hardware that offers this capability. An auto-save function ensures work is preserved even in the event of unexpected issues.
Complementing the canvas, the toolbar provides access to essential drawing tools and functions. Users can select pen color from a palette or using a color picker, adjust stroke thickness through a slider control, toggle between pen and eraser modes, clear the canvas with a single click, and access undo/redo functions for correcting mistakes. The toolbar’s layout prioritizes frequently used functions while maintaining a clean, uncluttered appearance that doesn’t distract from the drawing process.
The information panel displays the AI assistant’s responses and recognition results. After recognition, this area shows the top shape guesses along with their confidence percentages, presented in a clear, easy-to-understand format. The assistant’s conversational responses provide context-aware feedback, varying based on recognition confidence and previous interactions to avoid repetitive messaging. This panel also offers buttons for confirming or correcting the AI’s guesses, facilitating the training feedback loop that improves recognition over time.
Dialog screens provide access to less frequently used functions without cluttering the main interface. The Settings Dialog allows users to customize application behavior through categories including general settings, drawing tool properties, recognition parameters, and text-to-speech options. The Training Dialog displays statistics on the training data, showing labeled shapes in the database and allowing management of training examples. The Label Dialog facilitates correction of misrecognized shapes, capturing user feedback that enhances model performance.
The user experience flow has been carefully designed to feel natural and responsive. When drawing a shape, users experience immediate visual feedback as their strokes appear on the canvas. Upon requesting recognition (either through the UI button or Arduino controller), the system processes the drawing and promptly displays results in the information panel. The conversational AI response provides context to the recognition, often suggesting improvements or offering praise based on recognition confidence. If the system misidentifies a shape, users can easily correct it, with the application acknowledging this feedback and incorporating it into future recognition attempts.
Hardware Integration
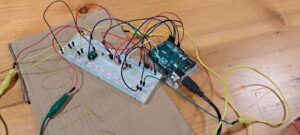
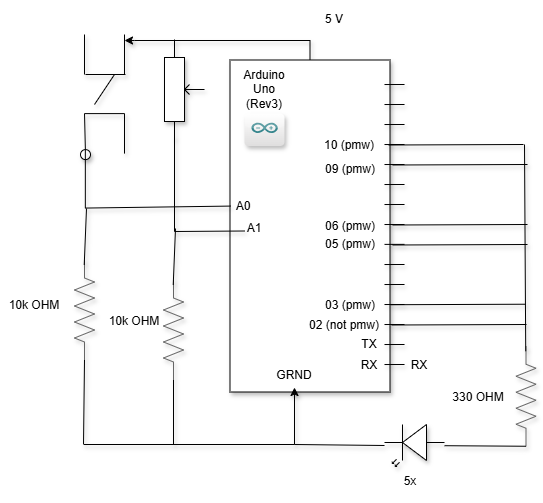
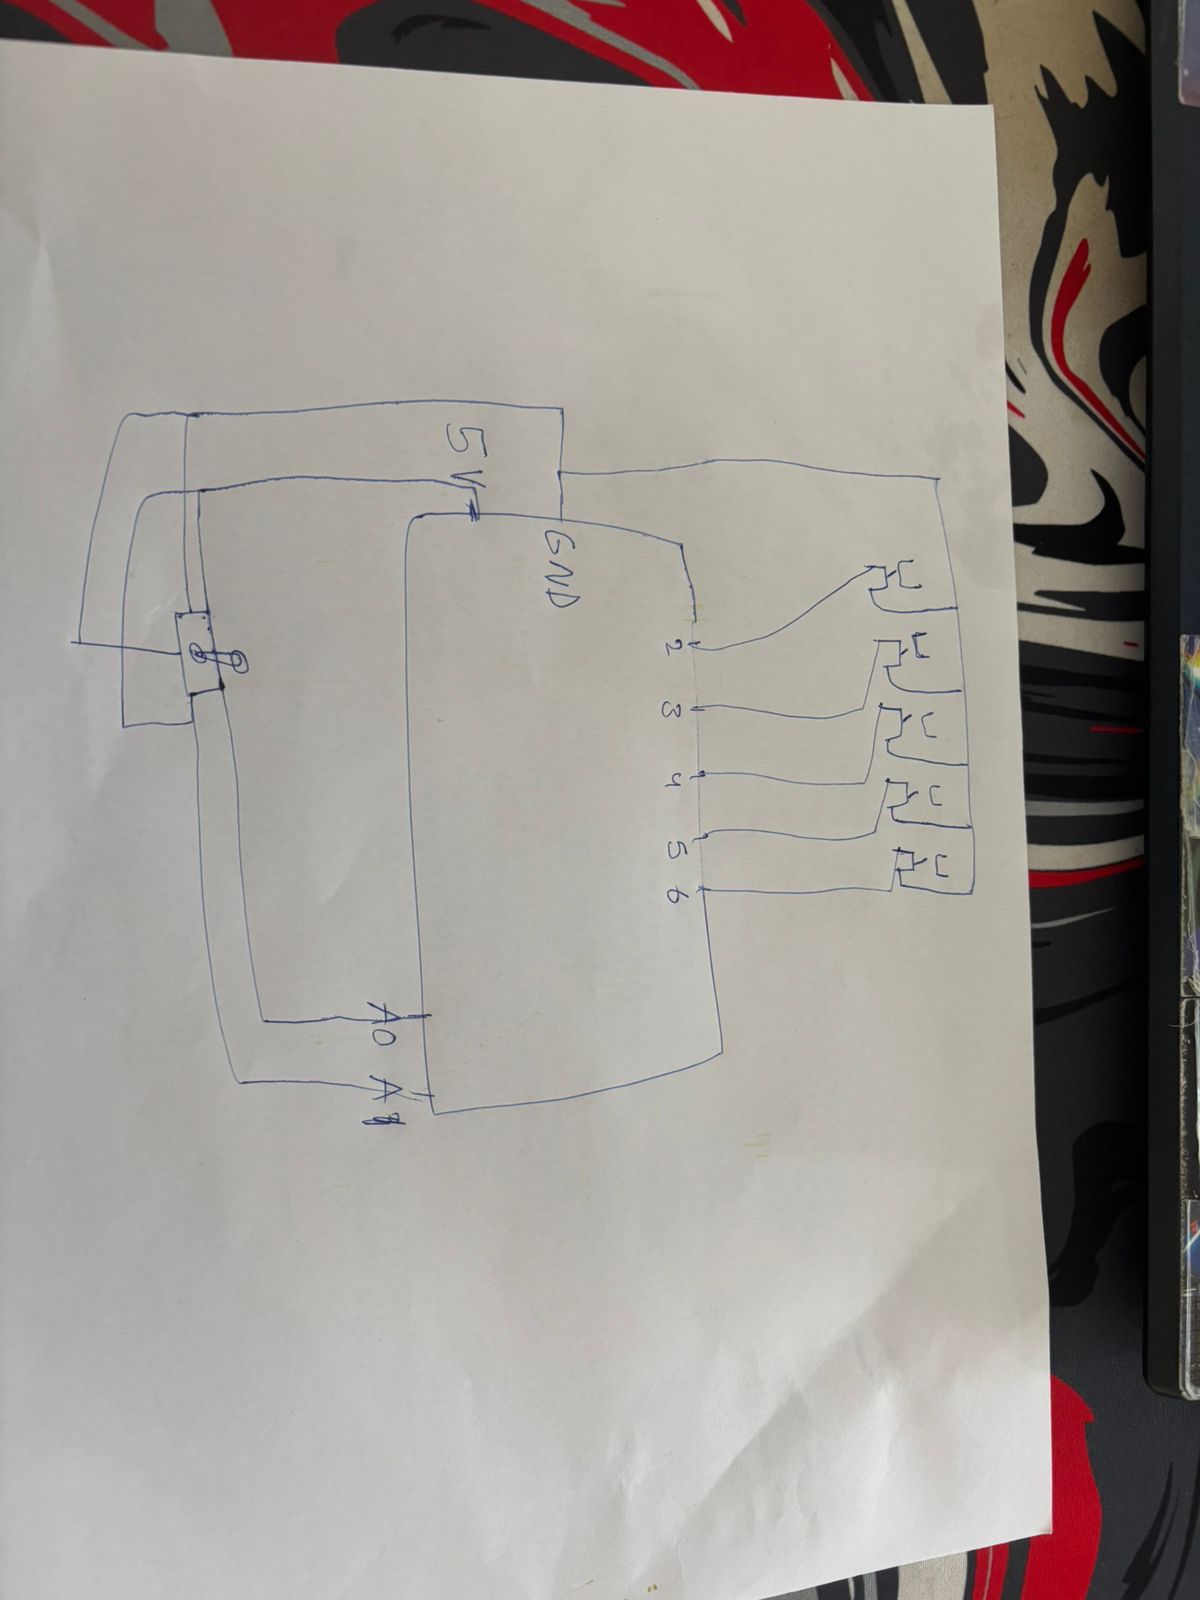
The system extends beyond traditional mouse and keyboard input through its Arduino integration, offering a novel physical interaction method that enhances the drawing experience. This hardware component connects through a serial interface and enables users to draw shapes using physical controls rather than conventional computer input devices.
The Arduino controller serves as an alternative input method, allowing users to draw using a joystick and trigger various actions with physical buttons. Five buttons are mapped to specific functions: triggering shape recognition, clearing the canvas, changing drawing color, adjusting stroke thickness, and toggling drawing mode. These correspond to pins 2 through 6 on the Arduino board. Drawing control is achieved through a potentiometer connected to pins A0 and A1, offering analog control of cursor position similar to a joystick. This physical interface provides a more tactile drawing experience that some users may find more intuitive than mouse-based drawing.
The system implements robust connection management for the Arduino controller. At application startup, the program automatically scans available serial ports to detect connected Arduino devices. Once detected, a dedicated thread continuously reads input data, translating it into drawing actions within the application. The connection management system includes auto-reconnect capability, allowing the application to recover from temporary disconnections without requiring user intervention. This ensures reliable hardware communication even in environments where connections might be intermittent.
Data processing for Arduino input employs a buffering system to handle the potentially variable data rate from the serial connection. Incoming data follows a structured format that indicates the input type (button press or analog input) and its value, with the application parsing this information and triggering appropriate actions in response. Analog inputs are normalized and mapped to canvas coordinates, ensuring smooth and predictable cursor movement despite potential variations in potentiometer readings.
Error handling for hardware integration is particularly robust, accounting for common issues like connection loss, malformed data, or hardware failures. The system implements graceful degradation when hardware components are unavailable, automatically falling back to mouse/keyboard input if the Arduino connection cannot be established or is lost during operation. Users receive clear notifications about hardware status through the application’s status bar, ensuring they remain informed about available input methods.
Development Journey
The development of the Hand-Drawn Shapes Recognition system followed an iterative process with distinct phases that progressively enhanced functionality and performance. Each phase built upon previous achievements while addressing limitations and incorporating user feedback, though not without significant challenges along the way.
The project began with the foundation phase, establishing the basic architecture and developing core components. During this period, I implemented the PyQt5-based user interface with a functional drawing canvas and basic shape extraction using OpenCV. Initial recognition relied solely on geometric analysis using traditional computer vision techniques, providing reasonable accuracy for well-drawn shapes but struggling with imprecise or ambiguous drawings. This phase established the project’s technical foundation while highlighting the need for more sophisticated recognition approaches.
As development progressed, I introduced machine learning to enhance recognition capabilities. Initial experiments with various classifiers led to my selection of Support Vector Machines as the primary classification algorithm due to their effectiveness with limited training data. The first training dataset consisted of manually labeled examples across eight shape categories: cross, square, other, triangle, ellipse, rectangle, hexagon, and line. This initial training process demonstrated the potential of machine learning while revealing challenges in data collection and feature selection.
A significant milestone occurred when the training dataset expanded to over 10,000 samples. Console output from this period reveals the distribution across shape categories: ellipse with 2,970 samples, rectangle with 2,680 samples, triangle with 2,615 samples, and “other” with 1,950 samples represented the majority classes, while cross (36 samples), square (17 samples), hexagon (16 samples), and line (20 samples) constituted minority classes. Training the model with this imbalanced dataset required careful consideration of class weights to prevent bias toward majority classes. The training process extracted 36 numeric features from each sample, excluding non-numeric data that might compromise model performance.
The training process during this phase required several minutes of computation, highlighting performance considerations that would later be addressed through optimization. Despite these challenges, the model achieved impressive accuracy metrics with 0.99 training accuracy and 0.97 test accuracy. These results validated the machine learning approach while providing a baseline for future improvements. Upon completion, the model was saved to disk as “shape_classifier.pkl” for subsequent use by the application.
One of the most devastating challenges I faced during development was losing approximately 60% of the codebase due to a catastrophic data loss incident. Most critically, this included a highly refined model that I had trained on over 10 million shapes from Google’s Quick Draw dataset. This advanced model represented tens of hours of training time across multiple GPU instances and had achieved significantly higher accuracy rates than previous iterations, particularly for complex and ambiguous shapes. Rebuilding after this loss required considerable effort, recreating critical code components from memory and documentation while working to reconstruct a training dataset that could approach the quality of the lost model.
Hardware integration represented another significant development phase. The Arduino controller implementation expanded the application’s input options while introducing new technical challenges related to serial communication and input mapping. I worked through issues of connection reliability, data parsing, and input calibration to create a seamless experience across both traditional and hardware-based input methods. This integration demonstrated the system’s flexibility while providing a novel interaction method that some users preferred over mouse-based drawing.
Throughout the development journey, user feedback played a crucial role in refining the system. Early testing revealed usability issues in the drawing interface that I addressed through UI refinements. Recognition errors highlighted gaps in the training data, leading to targeted data collection for underrepresented shape categories. Performance concerns during recognition and training prompted the optimization efforts that would become a major focus in later development stages.
Performance Optimization
As the system evolved and the training dataset grew, performance optimization became increasingly important to maintain responsiveness and enable real-time recognition. I implemented several key optimizations that significantly improved both training speed and runtime performance, particularly critical after losing my previous highly-optimized model.
A fundamental enhancement involved replacing the original SVC (Support Vector Classifier) implementation with LinearSVC, dramatically reducing computational complexity from O(n³) to O(n). This change resulted in training times that scaled linearly rather than cubically with dataset size, making it practical to train with larger datasets and more features. For a dataset with over 10,000 samples, this optimization reduced training time from hours to minutes, enabling more frequent model updates and facilitating experimentation with different feature sets and hyperparameters.
The feature extraction process, initially a bottleneck during both training and recognition, benefited from several optimizations. I implemented parallel feature extraction using Python’s multiprocessing capabilities, distributing the CPU-intensive work of calculating geometric features across multiple processor cores. This approach achieved near-linear speedup on multi-core systems, significantly reducing processing time for large batches of training images. Additionally, vectorizing operations with NumPy replaced inefficient Python loops with optimized array operations, further accelerating the feature calculation process. These optimizations were essential not just for performance, but for helping me recover from the lost advanced model by making retraining more efficient.
Data management optimizations addressed I/O-related performance issues. The system implemented batch loading and preprocessing of training data, reducing disk access frequency and allowing more efficient memory utilization. Feature caching stored pre-computed features for training examples, eliminating redundant calculations when retraining the model or performing incremental updates. Database operations were optimized with appropriate indexing and query strategies, ensuring efficient retrieval of training examples and user settings even as the database grew in size.
The recognition pipeline itself underwent substantial optimization to support real-time feedback. The system implemented adaptive algorithm selection, applying simpler, faster recognition methods for clear, well-formed shapes while reserving more computationally intensive analysis for ambiguous cases. Feature selection using techniques like Principal Component Analysis (PCA) and SelectKBest reduced the dimensionality of the feature space without significantly impacting accuracy, accelerating both training and inference. Memory management techniques minimized allocations during recognition, reducing garbage collection overhead and preventing memory-related performance degradation.
Command-line options added during this phase provided further optimization capabilities. The --retry flag enabled an automatic retry mechanism for failed samples, improving training robustness. Users could configure the maximum number of retry attempts with --max-retry-attempts (defaulting to 3) and specify the minimum required samples per shape class with --min-samples (defaulting to 10). For situations where machine learning was unnecessary or unavailable, the --geometric-only option limited recognition to geometric template rendering, reducing computational requirements. The --output option allowed specifying a custom output path for the trained model, facilitating experimentation with different model configurations.
These optimization efforts transformed the application from a proof-of-concept demonstration to a practical tool suitable for regular use. Recognition response times decreased from seconds to sub-second levels, providing the immediate feedback essential for a satisfying user experience. Training times reduced dramatically, enabling more frequent model updates and supporting the incremental learning approach that helped the system adapt to individual users’ drawing styles.
Future Enhancements
The Hand-Drawn Shapes Recognition system establishes a solid foundation that can be extended in numerous directions to enhance functionality, improve performance, and expand applicability. While the current implementation successfully addresses the core recognition challenge, several potential enhancements have been identified for future development iterations.
Advanced machine learning represents a promising direction for further development. Integrating deep learning approaches, particularly convolutional neural networks (CNNs), could improve recognition accuracy for complex shapes without requiring explicit feature engineering. Transfer learning from pre-trained models would enable leveraging existing visual recognition capabilities while reducing the required training data volume. Implementing ensemble methods combining multiple classifiers could enhance recognition robustness, especially for ambiguous cases where different approaches might yield complementary insights.
User experience enhancements could make the application more intuitive and powerful. Implementing multi-shape recognition would allow the system to identify multiple distinct shapes within a single drawing, expanding its applicability to more complex diagrams. A shape suggestion system could provide real-time guidance as users draw, helping them create more recognizable shapes. Enhanced drawing tools including shape creation templates, text annotation, and layer support would transform the application from a recognition demonstrator to a complete drawing tool with intelligent recognition capabilities.
Platform expansion represents another potential development path. Creating web and mobile versions of the application would increase accessibility, allowing users to benefit from shape recognition across different devices. Cloud-based training and recognition would enable sharing improvements across the user base, with each user’s corrections potentially improving the system for everyone. API development would allow third-party integration, enabling other applications to leverage the recognition capabilities for their own purposes.
Educational applications offer particularly promising opportunities. Developing specialized modes for teaching geometry could help students learn shape properties through interactive drawing and recognition. Creating games based on shape recognition would make learning engaging while simultaneously gathering valuable training data. Implementing custom shape sets would allow teachers to create domain-specific recognition tasks targeting particular educational objectives.
Accessibility improvements could make the system more inclusive. Enhanced text-to-speech integration would better serve users with visual impairments, providing more detailed auditory feedback about recognition results and drawing state. Implementing alternative input methods beyond the current mouse/touchpad and Arduino options could accommodate users with different abilities and preferences. Creating profiles for different user needs would allow the interface and recognition parameters to adapt automatically based on individual requirements.
The continuous improvement framework established in the current implementation provides a solid foundation for these enhancements. The modular architecture facilitates adding new components without disrupting existing functionality, while the dual-approach recognition strategy can incorporate new techniques alongside proven methods. As the system evolves, it will continue building on its core strengths while expanding to address new challenges and opportunities in shape recognition and interactive drawing.
Conclusion
The Hand-Drawn Shapes Recognition system represents my creation of a sophisticated blend of computer vision, machine learning, and interactive design, resulting in an application that not only recognizes hand-drawn shapes but continuously improves through user interaction. By implementing a hybrid approach combining geometric analysis with machine learning, my system achieves high recognition accuracy even with limited initial training data, while establishing a framework for ongoing enhancement through user feedback.
My development journey illustrates the iterative process of building intelligent interactive systems, progressing from basic geometric analysis to sophisticated machine learning while continuously refining the user experience. This journey included overcoming significant setbacks, most notably losing 60% of the codebase and an advanced model trained on over 10 million Quick Draw shapes that represented tens of hours of training time. Despite these challenges, I persevered, rebuilding critical components and implementing performance optimizations that transformed promising algorithms into a responsive application suitable for regular use, demonstrating how theoretical approaches can be successfully adapted to practical applications through thoughtful engineering, resilience, and attention to user needs.
The system’s modular architecture and dual-approach recognition strategy provide a flexible foundation for future development, supporting enhancements from advanced machine learning techniques to expanded platform support and specialized applications. This extensibility ensures the project can evolve to address new requirements and incorporate emerging technologies while maintaining its core functionality and user-friendly design, and provides resilience against potential future setbacks similar to my experience with data loss.
Throughout development, the balance between sophistication and accessibility remained a central consideration. While implementing advanced recognition techniques, I maintained focus on creating an intuitive interface that hides complexity from users while providing transparent feedback about recognition results. This approach makes the technology accessible to users regardless of their technical background, fulfilling my project’s goal of bridging the gap between human perceptual abilities and computer vision capabilities.
The Hand-Drawn Shapes Recognition system stands as both a practical application and a technological demonstration of my work, showing how computer vision and machine learning can enhance human-computer interaction in creative contexts. The project also represents my perseverance through significant technical challenges and data loss, emerging stronger with more efficient algorithms and robust error handling. As the system continues to evolve under my development, it will further narrow the gap between how humans and computers perceive and interpret visual information, creating increasingly natural and intuitive interaction experiences while maintaining resilience against the inevitable challenges of complex software development.