
For week 2, we needed to usr some loop to create some form of computational art. I decided to do some form of connecting particles and this was inspired from some work from my previous IM class. I know by altering some simple variables or having some simple visual changes, you can create something very different.
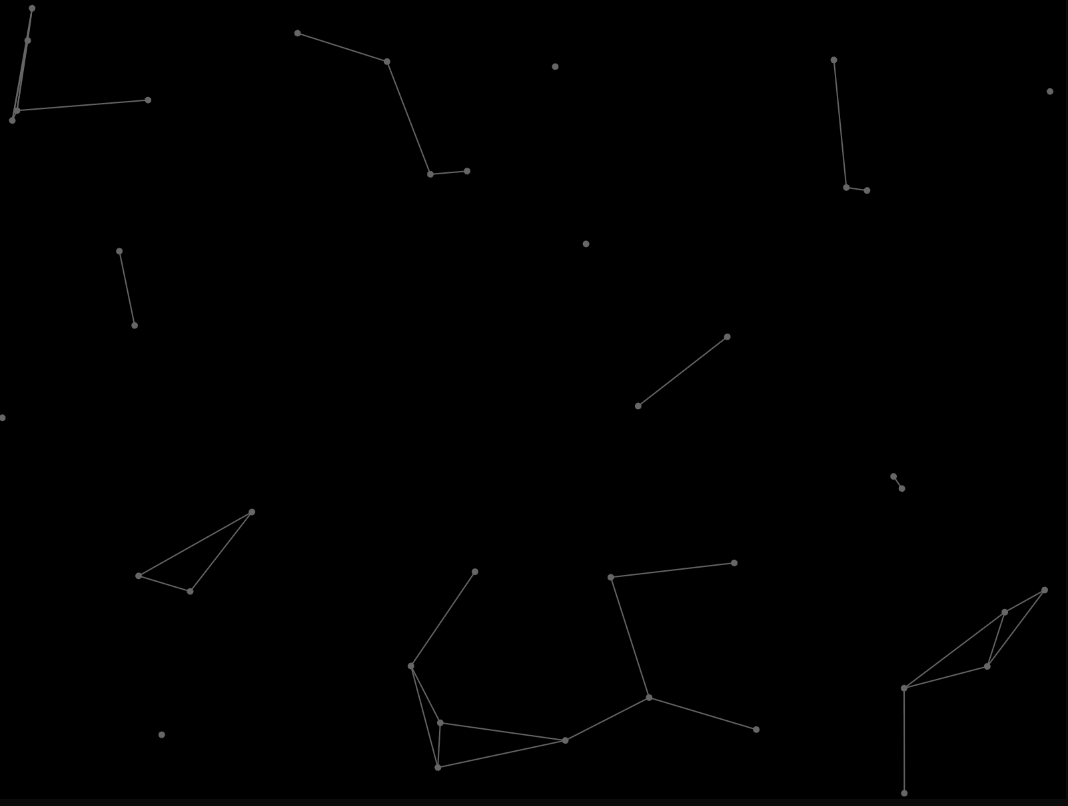
I had Dots placed randomly on the screen and gave each particle a velocity randomly assigned between -3 and 3.If the distance between points was less than 100 pixels, the line would be displayed.
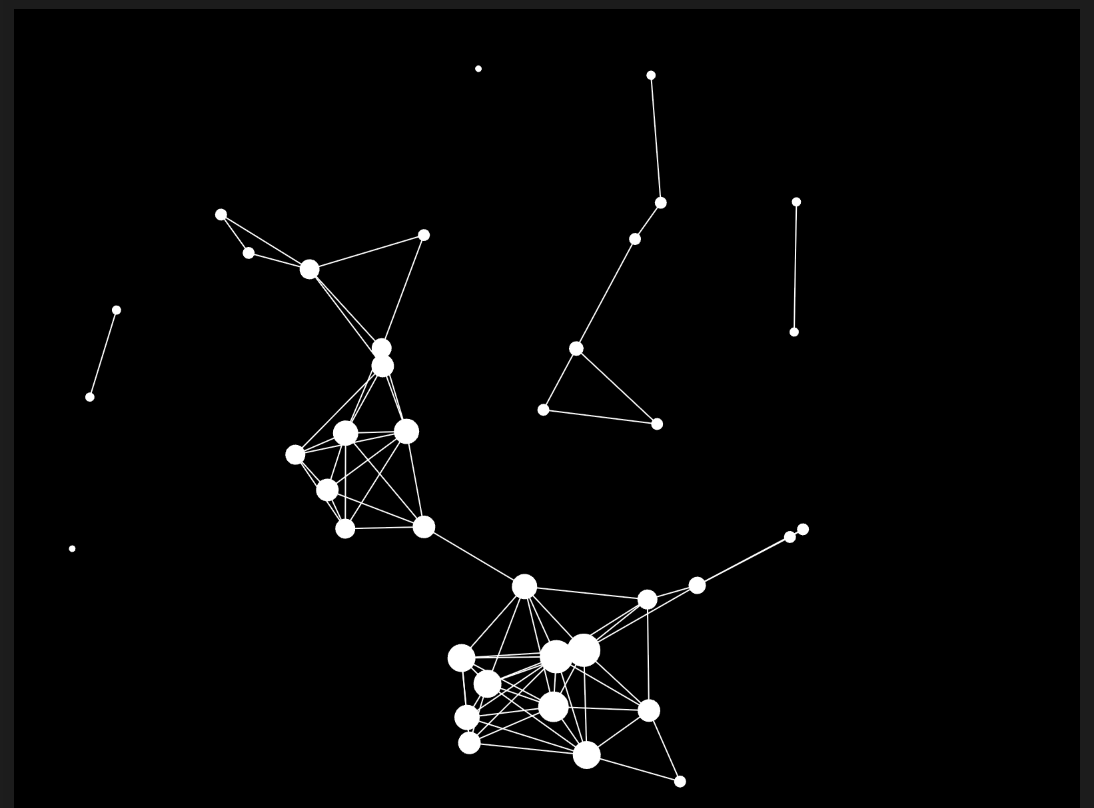
I then wanted to add some more dimension, so I added a NUMBER OF CONNECTIONS variable to keep track of how many lines were coming out of each dot (incrementing by 1). The more connections, the bigger the dot.
// size of dot increases with number of connections
const size = this.baseSize + (this.connections * 2);
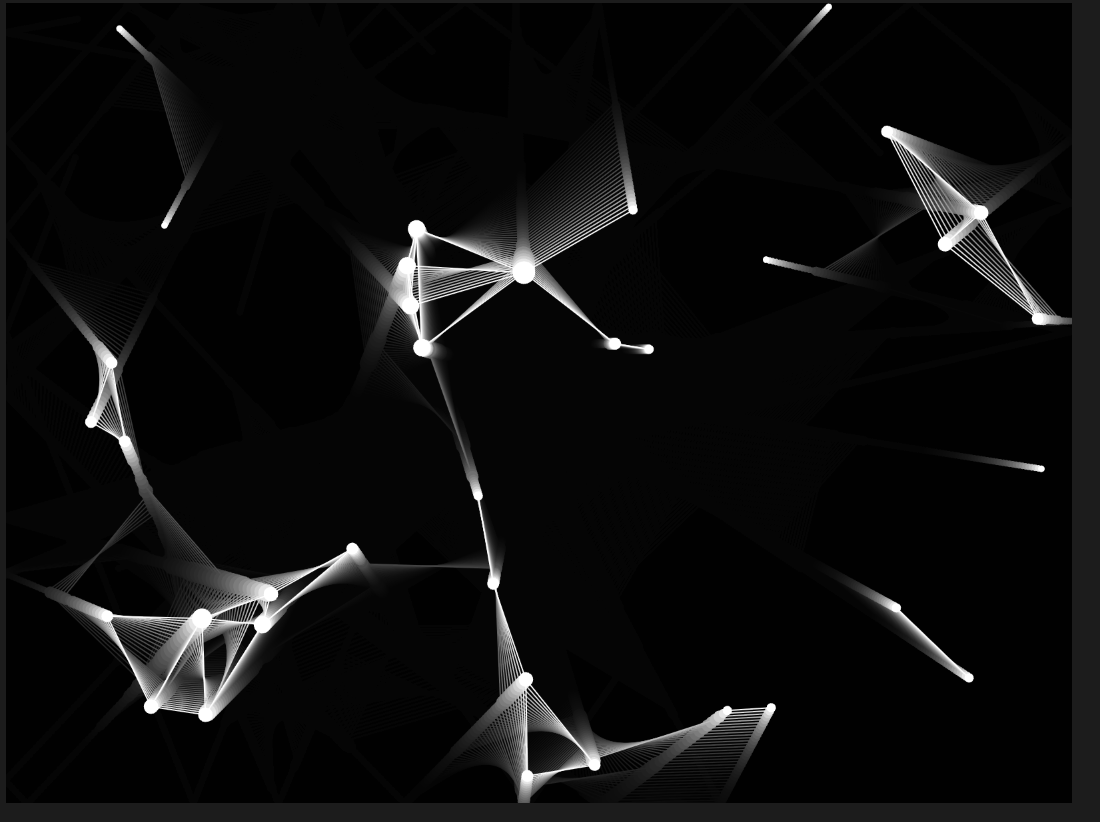
One very simple tool in p5.js that I love is the background alpha feature. When redrawing the background, you can add some opacity and you can see the cool trail effect it gives in the image below.
function draw() {
    // background(0, 0, 0);
    background(0, 0, 0, 25); // trail effect
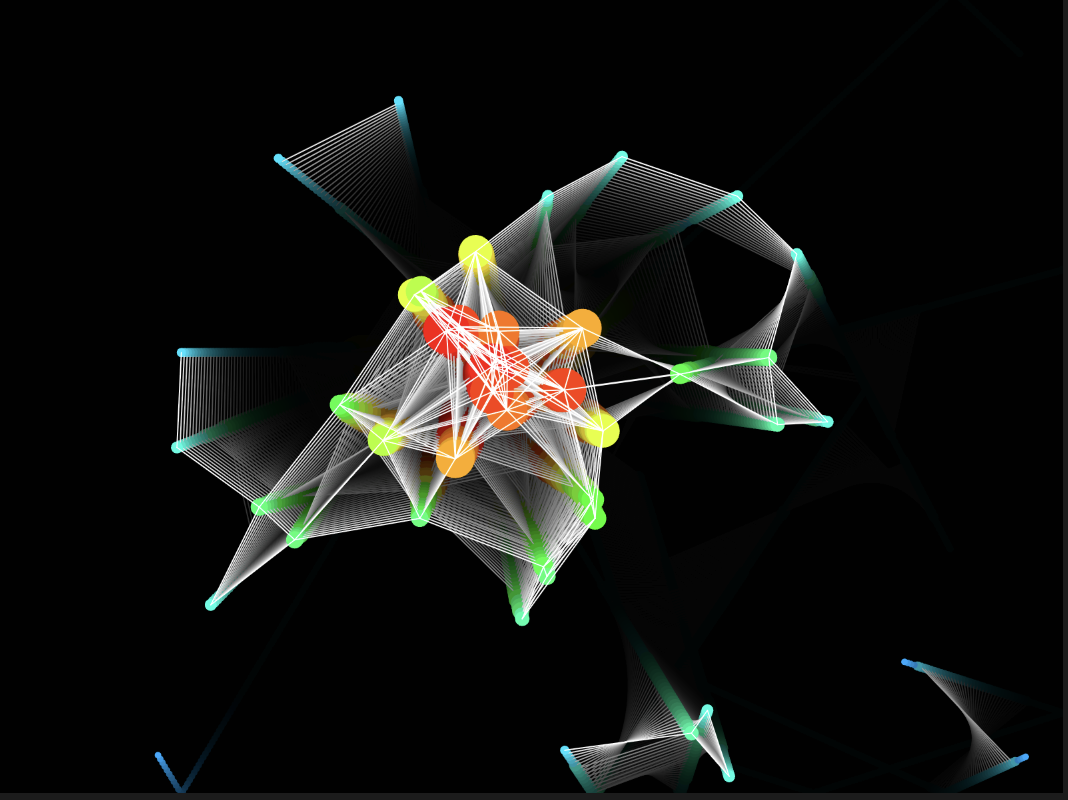
I wanted to add an additional dimension to the dots – the more connections, the more red, the less connections, the more blue. I used a map function to have the values be on a sort of scale, I needed to use HSB mode for this to work and then back to RGB for the background trial effect.
Blue -> red
display() {
    // colorr of dot changes with number of connections, more connections -> more red
    const hue = map(this.connections, 0, MAX_CONNECTIONS, 200, 0);
    // size of dot increases with number of connections
    const size = this.baseSize + (this.connections * 2);

    colorMode(HSB);
    fill(hue, 100, 100);
    //for trail effect - swithc back to rgb
    colorMode(RGB);
    noStroke();
    ellipse(this.x, this.y, size);
}
 I used for loops initalise the random dots, but to also go through each do to check the distance, number of connections, and ‘update’ them.
for (let i = 0; i < dots.length; i++) {
    for (let j = i + 1; j < dots.length; j++) {
        if (dist(dots[i].x, dots[i].y, dots[j].x, dots[j].y) < CONNECTION_DISTANCE) {
            // keep track of connections
            dots[i].connections++;
            dots[j].connections++;
            line(dots[i].x, dots[i].y, dots[j].x, dots[j].y);
        }
    }
}
For interactivity, the user can drag and hold the mouse across the screen to add more dots.