
Week 4: Data Visualization
Description:
This project consisted of creating a data visualization for some kind of data.
Idea:
For this assignment, I wanted to create some kind of visualization involving soccer. I really enjoy watching soccer and one of my favorite tournaments is the World Cup. Therefore I decided to do some research on the latest World Cup in Russia 2018. I initially liked the data involving goals for each country so I decided to collect such data on the official FIFA webpage.
Challenges:
For this project, there was no major challenge for me. The only difficult process was collecting data and working with CSV files. One major example was when I was using colors. I had to manually put every single piece of data. Initially, I thought I could write the colors in RGB in one single cell. However, Processing failed to read the data as colors. Finally, I had to write every single RGB value in a separate cell. For the piechart, I tried to make it interactive by making it bigger once clicked and making it display the names of the players. Although I tried to use the rotate function and textAlign function, I failed to get the outcome I wanted.
Process:
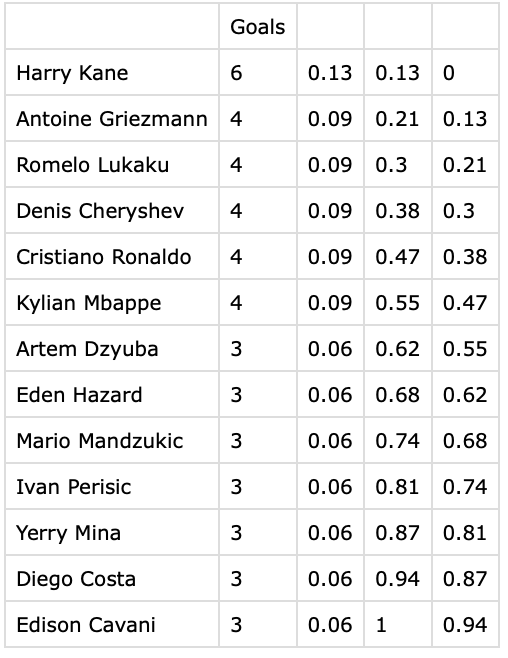
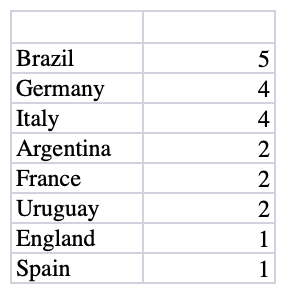
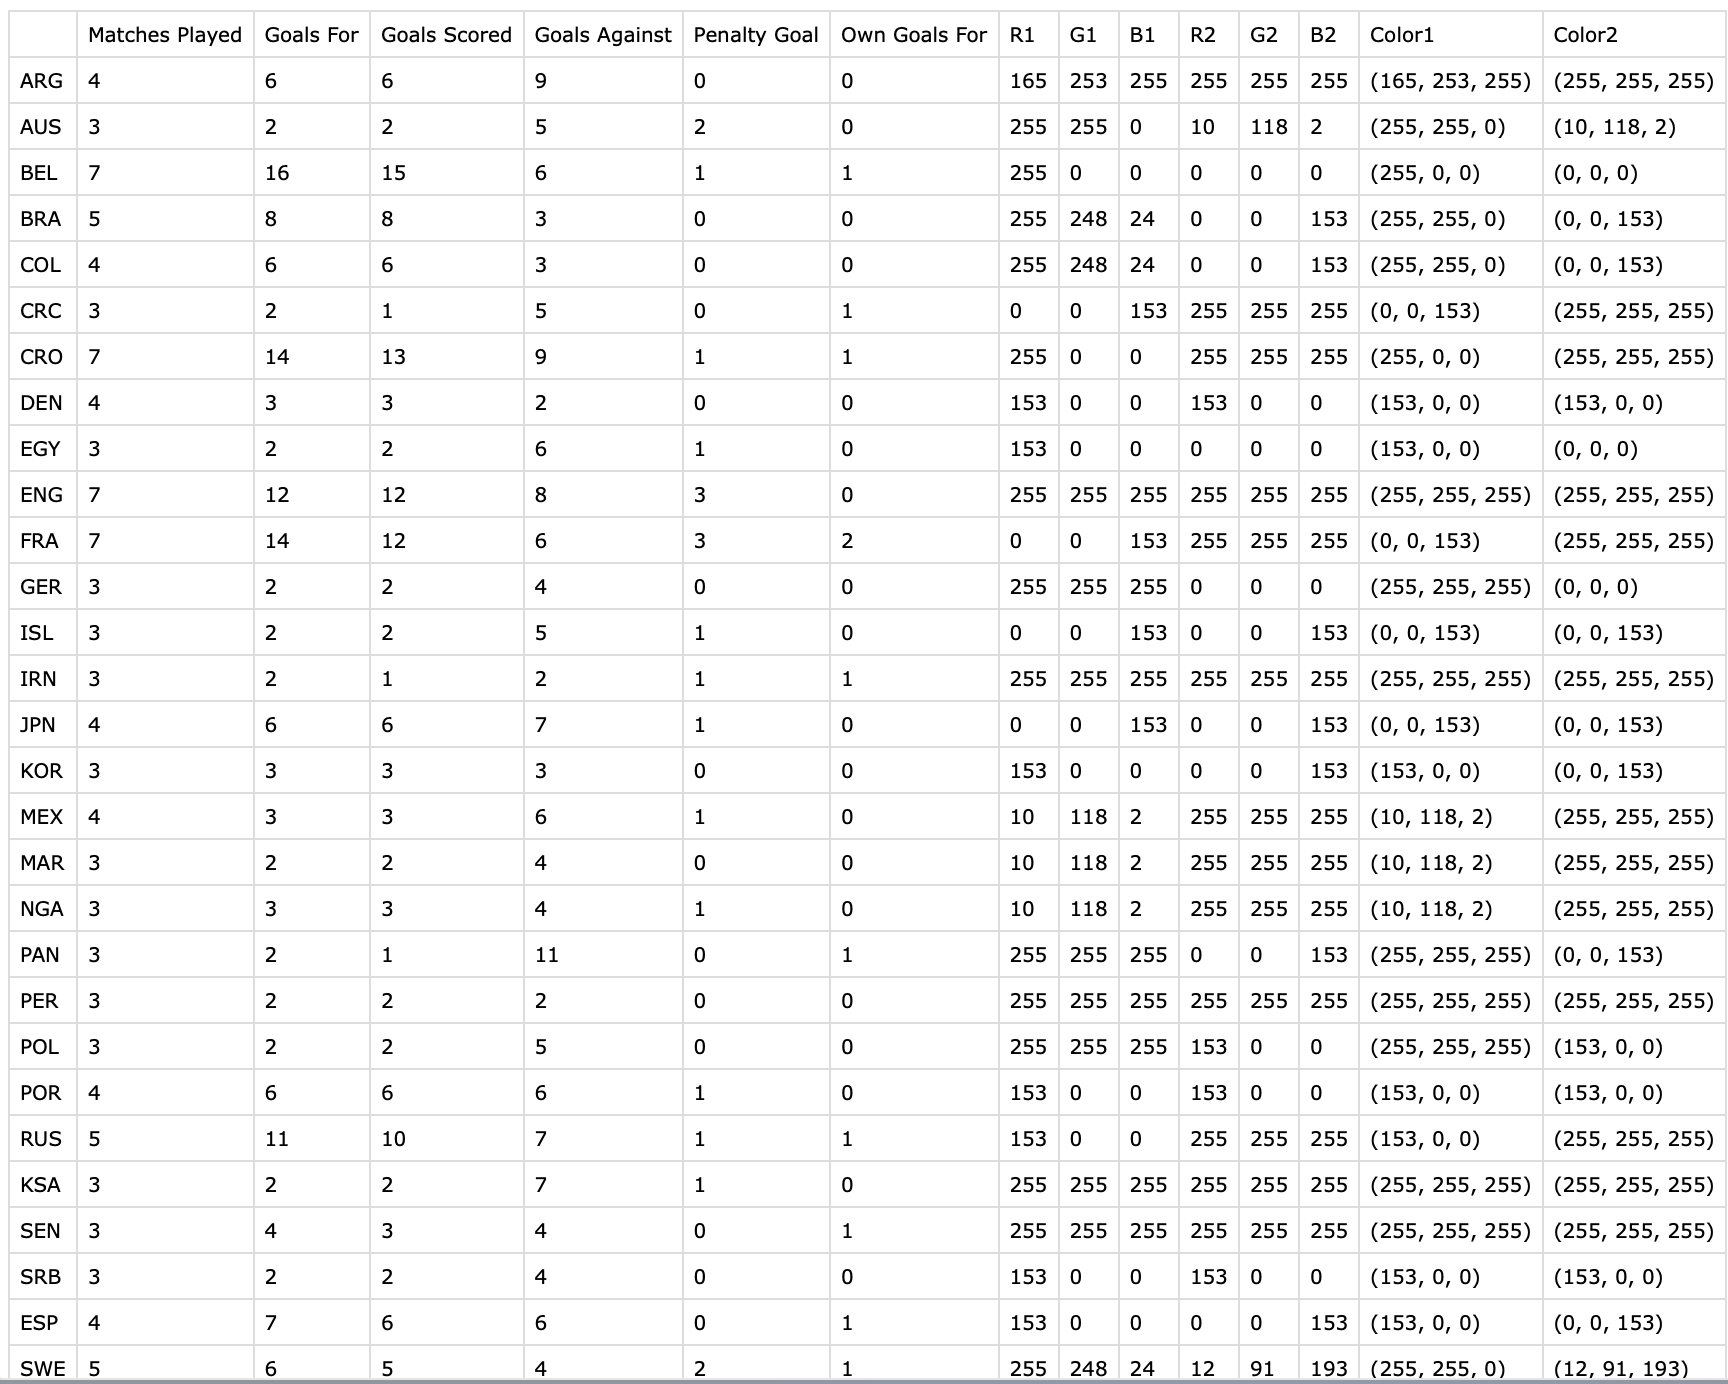
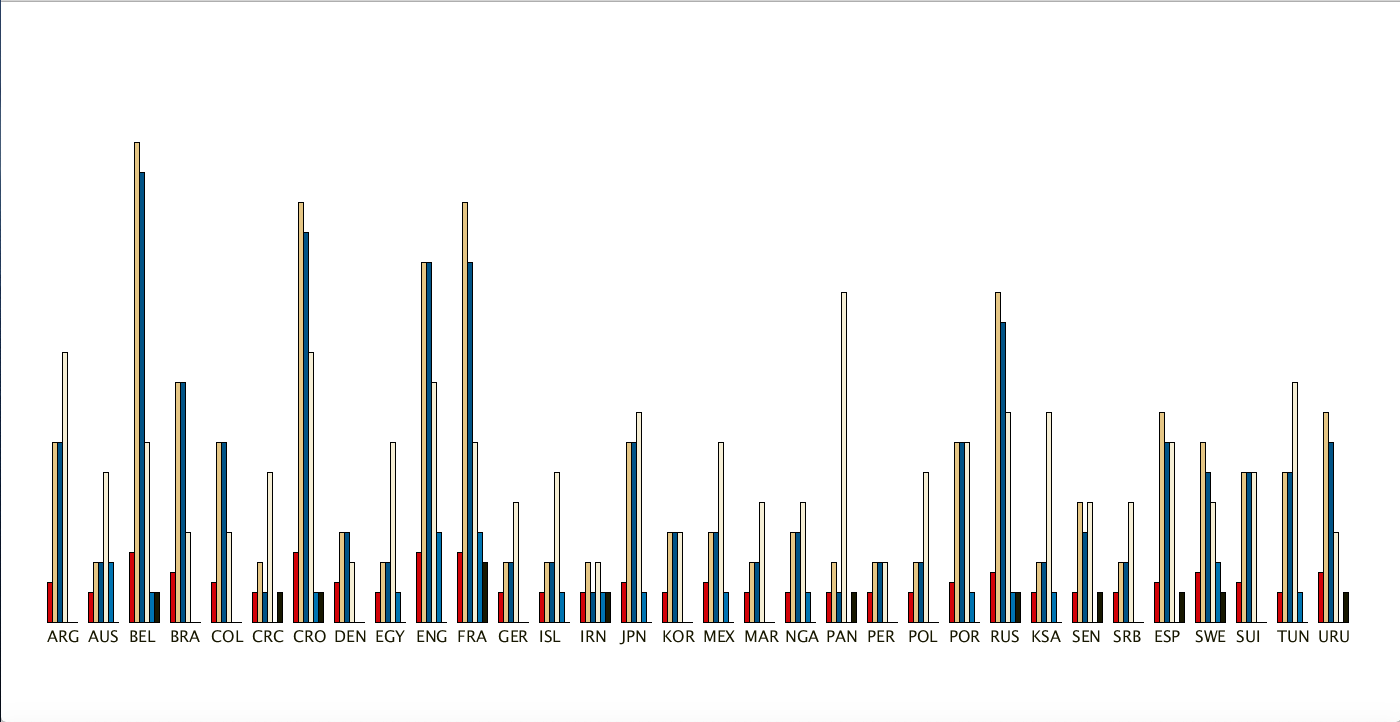
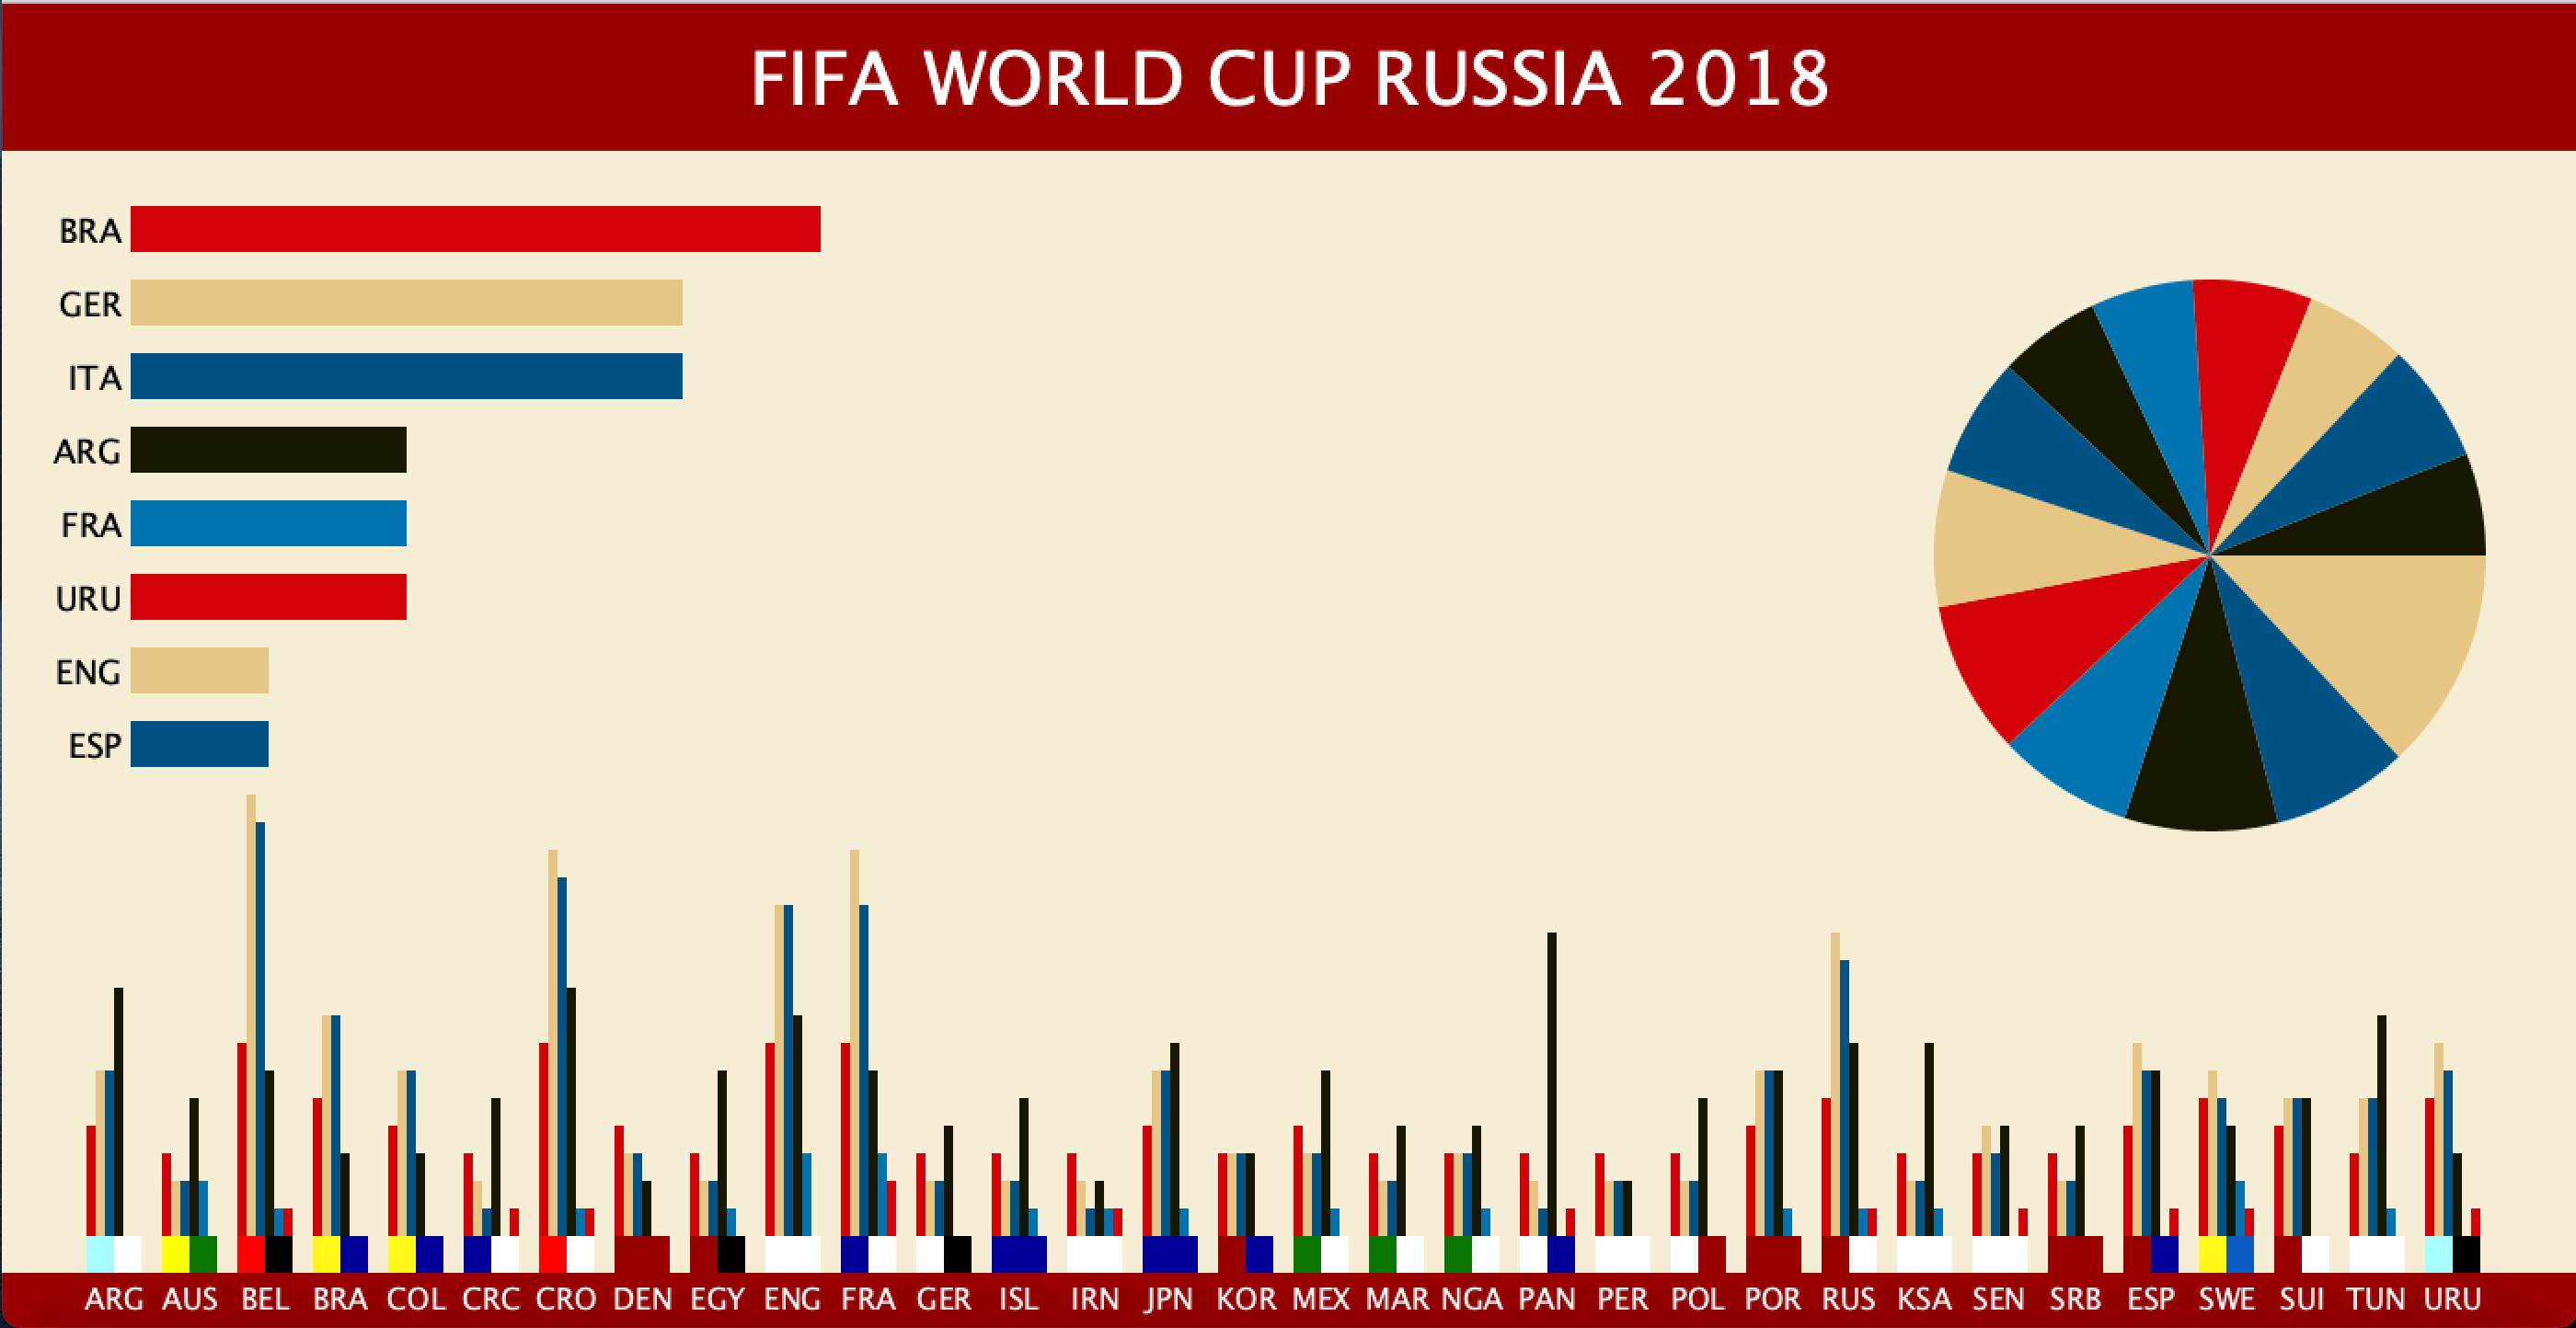
For this project, I first started collecting data. I used the official FIFA website to collect data such as matches played, goals scored, goals against, own goals, and penalty goals. After collecting such data I used Microsoft excel to write each country’s name and data. I tried different designs and positions until I liked the last one where I place all of the data at the bottom of the screen and show it in bar graphs. When I completed this, I decided to put some color. For the overall design, I used the official colors used in the Russia World Cup. Then I got the idea to represent each country’s uniform color along with the name. After being done with this, I realized that the screen looked somewhat empty. Later I decided to add two additional features. The first one was a pie chart involving the top thirteen goal scorers. The second one involved the number of World Cup wins by country.
Conclusion:
Overall I had a lot of fun creating this project because it involved something I liked. Although it was tedious to work with a lot of data I think I got to practice a lot for this project. I used previous topics such as OOP and using text. Even though I failed to complete the part for the text, I was satisfied with the result. The project looks a little empty but I think I will keep working on it to fill it and make it more interactive. Although the project took me more time than expected, I feel I enjoyed investigating and creating this data visualization. Also compared to other projects, I think I have improved a lot in avoiding hardcoding.
Country[] countries;
PieChart[] players;
Winners[] winner;

PFont font;
Table table, table2, table3;
color red = color(211, 2, 8);
color gold = color(229, 198, 133);
color white = color(245, 238, 213);
color black = color(23,23,0);
color blue = color(1, 83, 134);
color blue2 = color(0, 116, 177);
int zoomindata = 0;

color[] colors= { red, gold, blue, black, blue2 };
String[] countryname = { "BRA", "GER", "ITA", "ARG", "FRA", "URU", "ENG", "ESP"};

void setup(){
 size(1400, 720);
 loadData();
}

void draw(){
  font = createFont("Montserrat", 40);
  background(245, 238, 213);
  textSize(64);
  fill(153, 0, 0);
  rect(0,0,width, 80);
  rect(0,height-30,width, 30);
  fill(255);
  textAlign(CENTER);
  textFont(font);
  text("FIFA WORLD CUP RUSSIA 2018", width/2, 55);

  for(int i = 1; i < 33; i++){
    countries[i].drawData();
  }
  for(int i = 0; i < 14; i++){
    if(zoomindata == 0){
      players[i].drawData();
    }
    else if(zoomindata == 1){
      players[i].drawBigCircle();
    }
  }

  for(int i = 0; i < 8; i++){
    winner[i].drawData();
  }
}

 void loadData(){

    //array for bottom data
    table = loadTable("worldcup2018.csv");
    //array for piechart
    table2 = loadTable("piechart.csv");
    //array for winners
    table3 = loadTable("line_chart.csv");

    countries = new Country[table.getRowCount()];
    players = new PieChart[table2.getRowCount()];
    winner = new Winners[table3.getRowCount()];

    for (int i = 0;  i < table.getRowCount(); i++){
      TableRow row = table.getRow(i);
      String name = row.getString(0);
      float matchplay = row.getFloat(1);
      float goalfor = row.getFloat(2);
      float goalscore = row.getFloat(3);
      float goalagainst = row.getFloat(4);
      float pkgoal = row.getFloat(5);
      float owngoal = row.getFloat(6);
      int r1 = row.getInt(7);
      int g1 = row.getInt(8);
      int b1 = row.getInt(9);
      int r2 = row.getInt(10);
      int g2 = row.getInt(11);
      int b2 = row.getInt(12);
      color c1 = color(r1, g1, b1);
      color c2 = color(r2, g2, b2);
      countries[i] = new Country(41*i, name, matchplay, goalfor, goalscore, goalagainst, pkgoal, owngoal, c1, c2);
    }

    for (int i = 0; i < table2.getRowCount(); i++){
      TableRow row2 = table2.getRow(i);
      String player = row2.getString(0);
      float goal = row2.getFloat(1);
      int colornum = i%5;
      float anglei = row2.getFloat(4);
      float anglef = row2.getFloat(3);
      players[i] = new PieChart(player, goal, colors[colornum], anglei*TWO_PI, anglef*TWO_PI);
    }

    for (int i = 0; i < table3.getRowCount(); i++){
      TableRow row3 = table3.getRow(i);
      //String country = row3.getString(0);
      float wins = row3.getFloat(1);
      int colorbar = i%5;
      winner[i] = new Winners(i, countryname[i], wins, colors[colorbar]);
    }

 }

 void mousePressed(){
   if(mouseX > 1000 && mouseY < 500){
       zoomindata = 1;
   }
  }

 void mouseReleased(){
   zoomindata = 0;

 }
class Country{
  float posX, posY;
  String name;
  color color1, color2;
  float MP, GF, GS, GA, PG, OG;
  float spacebtwy, spacebtwx, widthbar, barheight;

  Country(float x, String n, float matches, float goalf, float goals, float goala,
  float pkgoal, float owng, color c1, color c2){
    posX = x;
    posY = height - 50;
    spacebtwy = 5;
    spacebtwx = 5;
    name = n;
    MP = matches;
    GF = goalf;
    GS = goals;
    GA = goala;
    PG = pkgoal;
    OG = owng;
    widthbar = 5;
    color1 = c1;
    color2 = c2;
    barheight = 15;
  }

  void drawData(){
    textSize(16);
    noStroke();
    fill(255);
    text(name, posX+20, posY+40);
    fill(red);
    rect(posX+spacebtwx, posY-MP*barheight, widthbar, MP*barheight);
    fill(gold);
    rect(posX+2*spacebtwx, posY-GF*barheight, widthbar, GF*barheight);
    fill(blue);
    rect(posX+3*spacebtwx, posY-GS*barheight, widthbar, GS*barheight);
    fill(black);
    rect(posX+4*spacebtwx, posY-GA*barheight, widthbar, GA*barheight);
    fill(blue2);
    rect(posX+5*spacebtwx, posY-PG*barheight, widthbar, PG*barheight);
    fill(red);
    rect(posX+6*spacebtwx, posY-OG*barheight, widthbar, OG*barheight);
    fill(color1);
    rect(posX+5, posY, 15, 20);
    fill(color2);
    rect(posX+20, posY, 15, 20);
  }

}
class PieChart{
  float posX, posY;
  float percentage;
  float radius;
  float anglei, anglef;
  color colors;
  String name;


  PieChart(String player, float goal, color colorpie, float angle1, float angle2){
    posX = 1200;
    posY = 300;
    radius = 300;
    colors = colorpie;
    anglei = angle1;
    anglef = angle2;
    float num = goal;
    name = player;

  }

  void drawData(){
    fill(colors);
    arc(posX, posY, radius, radius, anglei, anglef);
  }

  void drawBigCircle(){
    fill(colors);
    arc(width/2, height/2, radius*2, radius*2, anglei, anglef);
    textSize(24);
    pushMatrix();
    translate(width/2, height/2);
    rotate((anglei+anglef)/2);
    fill(0);
    textAlign(RIGHT);
    text(name, 0, 0);
    popMatrix();

  }

}
class Winners{
  float posX, posY;
  float wins;
  color colors;
  String name;
  int barlength, barwidth;


  Winners(int position, String country, float number, color colorbar){
    posX = 70;
    posY = 40*position + 110;
    name = country;
    wins = number;
    colors = colorbar;
    barlength = 75;
    barwidth = 25;

  }

  void drawData(){
    fill(colors);
    rect(posX, posY, wins*barlength, barwidth);
    fill(0);
    textSize(18);
    textAlign(RIGHT);
    text(name, posX-5, posY+20);
  }

}
Hi Rock, nice job on choosing a color palette for your visualization, looks good. The bar graph in the upper left illustrates some meaningful info, but it’s hard to get anything too meaningful from the rest. Perhaps use a mouse over to reveal more text giving more information on what is being shown, or choose information that you want to highlight that can make the rest of it easier to parse for a human. Also, you shouldn’t have to manually input data in most cases. In this case, you need to work with the data in processing instead of entering RGB colors in the CSV. If the colors relate directly to the data you would do something like: color c = color(map(dataValue, 0, 10, 0, 255); Or if indirectly related you can store the color in processing then use an if statement to choose the different colors.