Midterm Documentation Part 1 – Idea

Inspiration

This midterm project involves making a game, and though I love playing games and find a lot of them to be very impressive, the idea of creating one myself is very scary. To play it safe, I knew I wanted to make something simple yet fun enough for other people  to at least play when they’re really really bored. At first, it was hard to think of games that didn’t involve various elements that I was not familiar with or would require a lot of time that I do not have right this moment. I started thinking of online games I used to play on the computer when I was little. I then remembered coolmathgames.com. It gave me flashbacks to when I would be in my computer class and we would go on coolmathgames.com whenever we would get “free time” and had nothing else to do. I started exploring the games.

I found these relatively simple games:

  • https://www.coolmathgames.com/0-curve-ball-3d?utm_content=CTA_Top_Picks#immersiveModal
  • https://www.coolmathgames.com/0-run-3

I also remembered I used to play a lot of dress-up games, but I thought it would be too complicated to use or create a lot of the objects needed to dress up a figure so I abandoned that idea. I was favoring the idea of run 3 and wanted to look at more examples. A friend actually reminded me of the Google dinosaur game that pops up whenever a user attempts to navigate the google browser  offline. I inserted it below.

In order to add my own twist to it, I decided to go with a Halloween theme since we are in October and I am going to miss celebrating Halloween at home.  Below is a more detailed thought process related to the project requirements in terms of my own dino game.

  • Can be one or more players
    • One player; Jack O’ Lantern character
  • Must include
    • At least one shape
      • Obstacles for Jack to jump over or go under (or both?)
      • Background: dark, full moon, clouds
    • At least one image
      • Jack
    • At least one sound
      • Sound whenever he jumps or crashes into something. Game over sound? Background music?
    • At least one on-screen text
      • Instructions in the beginning
      • “GAME OVER”
    • Object Oriented Programming
  • The game must start with a screen giving instructions, and must wait there until a button or key (your choice) is pressed
    • “Jack is trying to escape pumpkin carving season. Press space to start running! Don’t get caught or else RIP Jack :(“
  • After the game is won or lost, there must be a way to restart the game without closing and restarting the program
    • button? automatic restart to the instruction page?

Future Improvements

I have not started my code yet, but that is for part II, which will then lead to the final part. I look forward to creating my own version of this game and learning along the way.

Assignment 4: Data Visualization

Concept

For this assignment, I chose to try and do either a line or bar graph based on a set of data. I retrieved a data set from datahub.io, it was a data set showing the mean global temperate yearly from 1880 to 2016. I referenced the class example, The Coding Train, and various other YouTube videos to help me.

Code Highlight

let dataMin, dataMax = 0;

function minMax() {
  for (let i = 0; i < numRows; i++) {
    if (table.getNum(i, 1) > dataMax) {
      dataMax = table.getNum(i, 1);
    }
  }
  dataMin = dataMax;
  for (let i = 0; i < numRows; i++) {
    if (table.getNum(i, 1) < dataMin) {
      dataMin = table.getNum(i, 1);
    }
  }

  print("max value " + dataMax + "min value " + dataMin); // checks if finding the min and max value works
  
}

This part of my code finds the maximum and minimum average global temperature. To make sure it worked, I printed the max and min value.

Image

No image 🙁

// IIM Michael Shiloh
// October 4, 2022 Assignment 4 Data Visualization
// Abigail Mata-Hernandez

// Description: This code attempts to create a data visualization about annual global temperature means in celcius from 1880 to the present. My goal is to create either a line or bar graph showing the how the global temperature changes over time.

// I chose this data set randomly from https://datahub.io/core/global-temp

// Inspiration: Class, The Coding Train,

let table;
let numRows, numCols;
let date = [];
mean = [];
let diagramX, diagramY; // x and y coordinates

function preload() {
  table = loadTable("annual_csv.csv", "csv", "header");
}

function setup() {
  createCanvas(400, 400);
  background(220);

// print(table); // check if loads table

  numRows = table.getRowCount();
  numCols = table.getColumnCount();

//print("rows:" + numRows + "cols;"+ numCols) check number of rows and columns

// load data

  for (let r = 0; r < table.getRowCount(); r++) {
    date[r] = table.getString(r, 0);
    mean[r] = table.getNum(r, 1);

// print(date[r] + " " + mean[r]) check if I get the date and mean, the date  points needed on the graph
    
  }

  // const name = table.getString(r, "Source");
  // const year = table.getNum(r, "Year");
  // const x = random(0, width);
  // const y = random(0, height);
  // text(name, x, y);
  // console.log(name);
  // the above code was a different attempt at drawing the graph using a different way but I did not understand it and stopped
  
  minMax(); //minMax function found below
}

function draw() {
  background(240);
  
  diagramX = width/2;
  diagramY = height/2;
  
 // When I tried to actually use the points to visualize the data is when I got stuck. I tried to follow videos such as https://www.youtube.com/watch?v=hokTcLVtZs8 but it was very different than what I was doing
  
}


let dataMin, dataMax = 0;

function minMax() {
  for (let i = 0; i < numRows; i++) {
    if (table.getNum(i, 1) > dataMax) {
      dataMax = table.getNum(i, 1);
    }
  }
  dataMin = dataMax;
  for (let i = 0; i < numRows; i++) {
    if (table.getNum(i, 1) < dataMin) {
      dataMin = table.getNum(i, 1);
    }
  }

  print("max value " + dataMax + "min value " + dataMin); // checks if finding the min and max value works
  
}

It wasn’t until I got to the actual data visualization part where I had trouble. The code before attempting to draw the line or bar chart had already taken me quite some time, more than I would have liked. I thought however that because I already loaded and figured out how to get some values, it would be easier to get the rest of the values I needed and plot them on a line graph. I know there is a solution which is why I kept trying, but I kept failing.

Reflection

I don’t think looking at just examples or videos is helping me. I tend to try and do almost the exact same thing as the examples, but the code that I had made on my own from what I understand is obviously too different to fit into what the examples do. I plan on taking more time to practice coding outside of the assignments assigned.

Assignment 4: Data Visualization

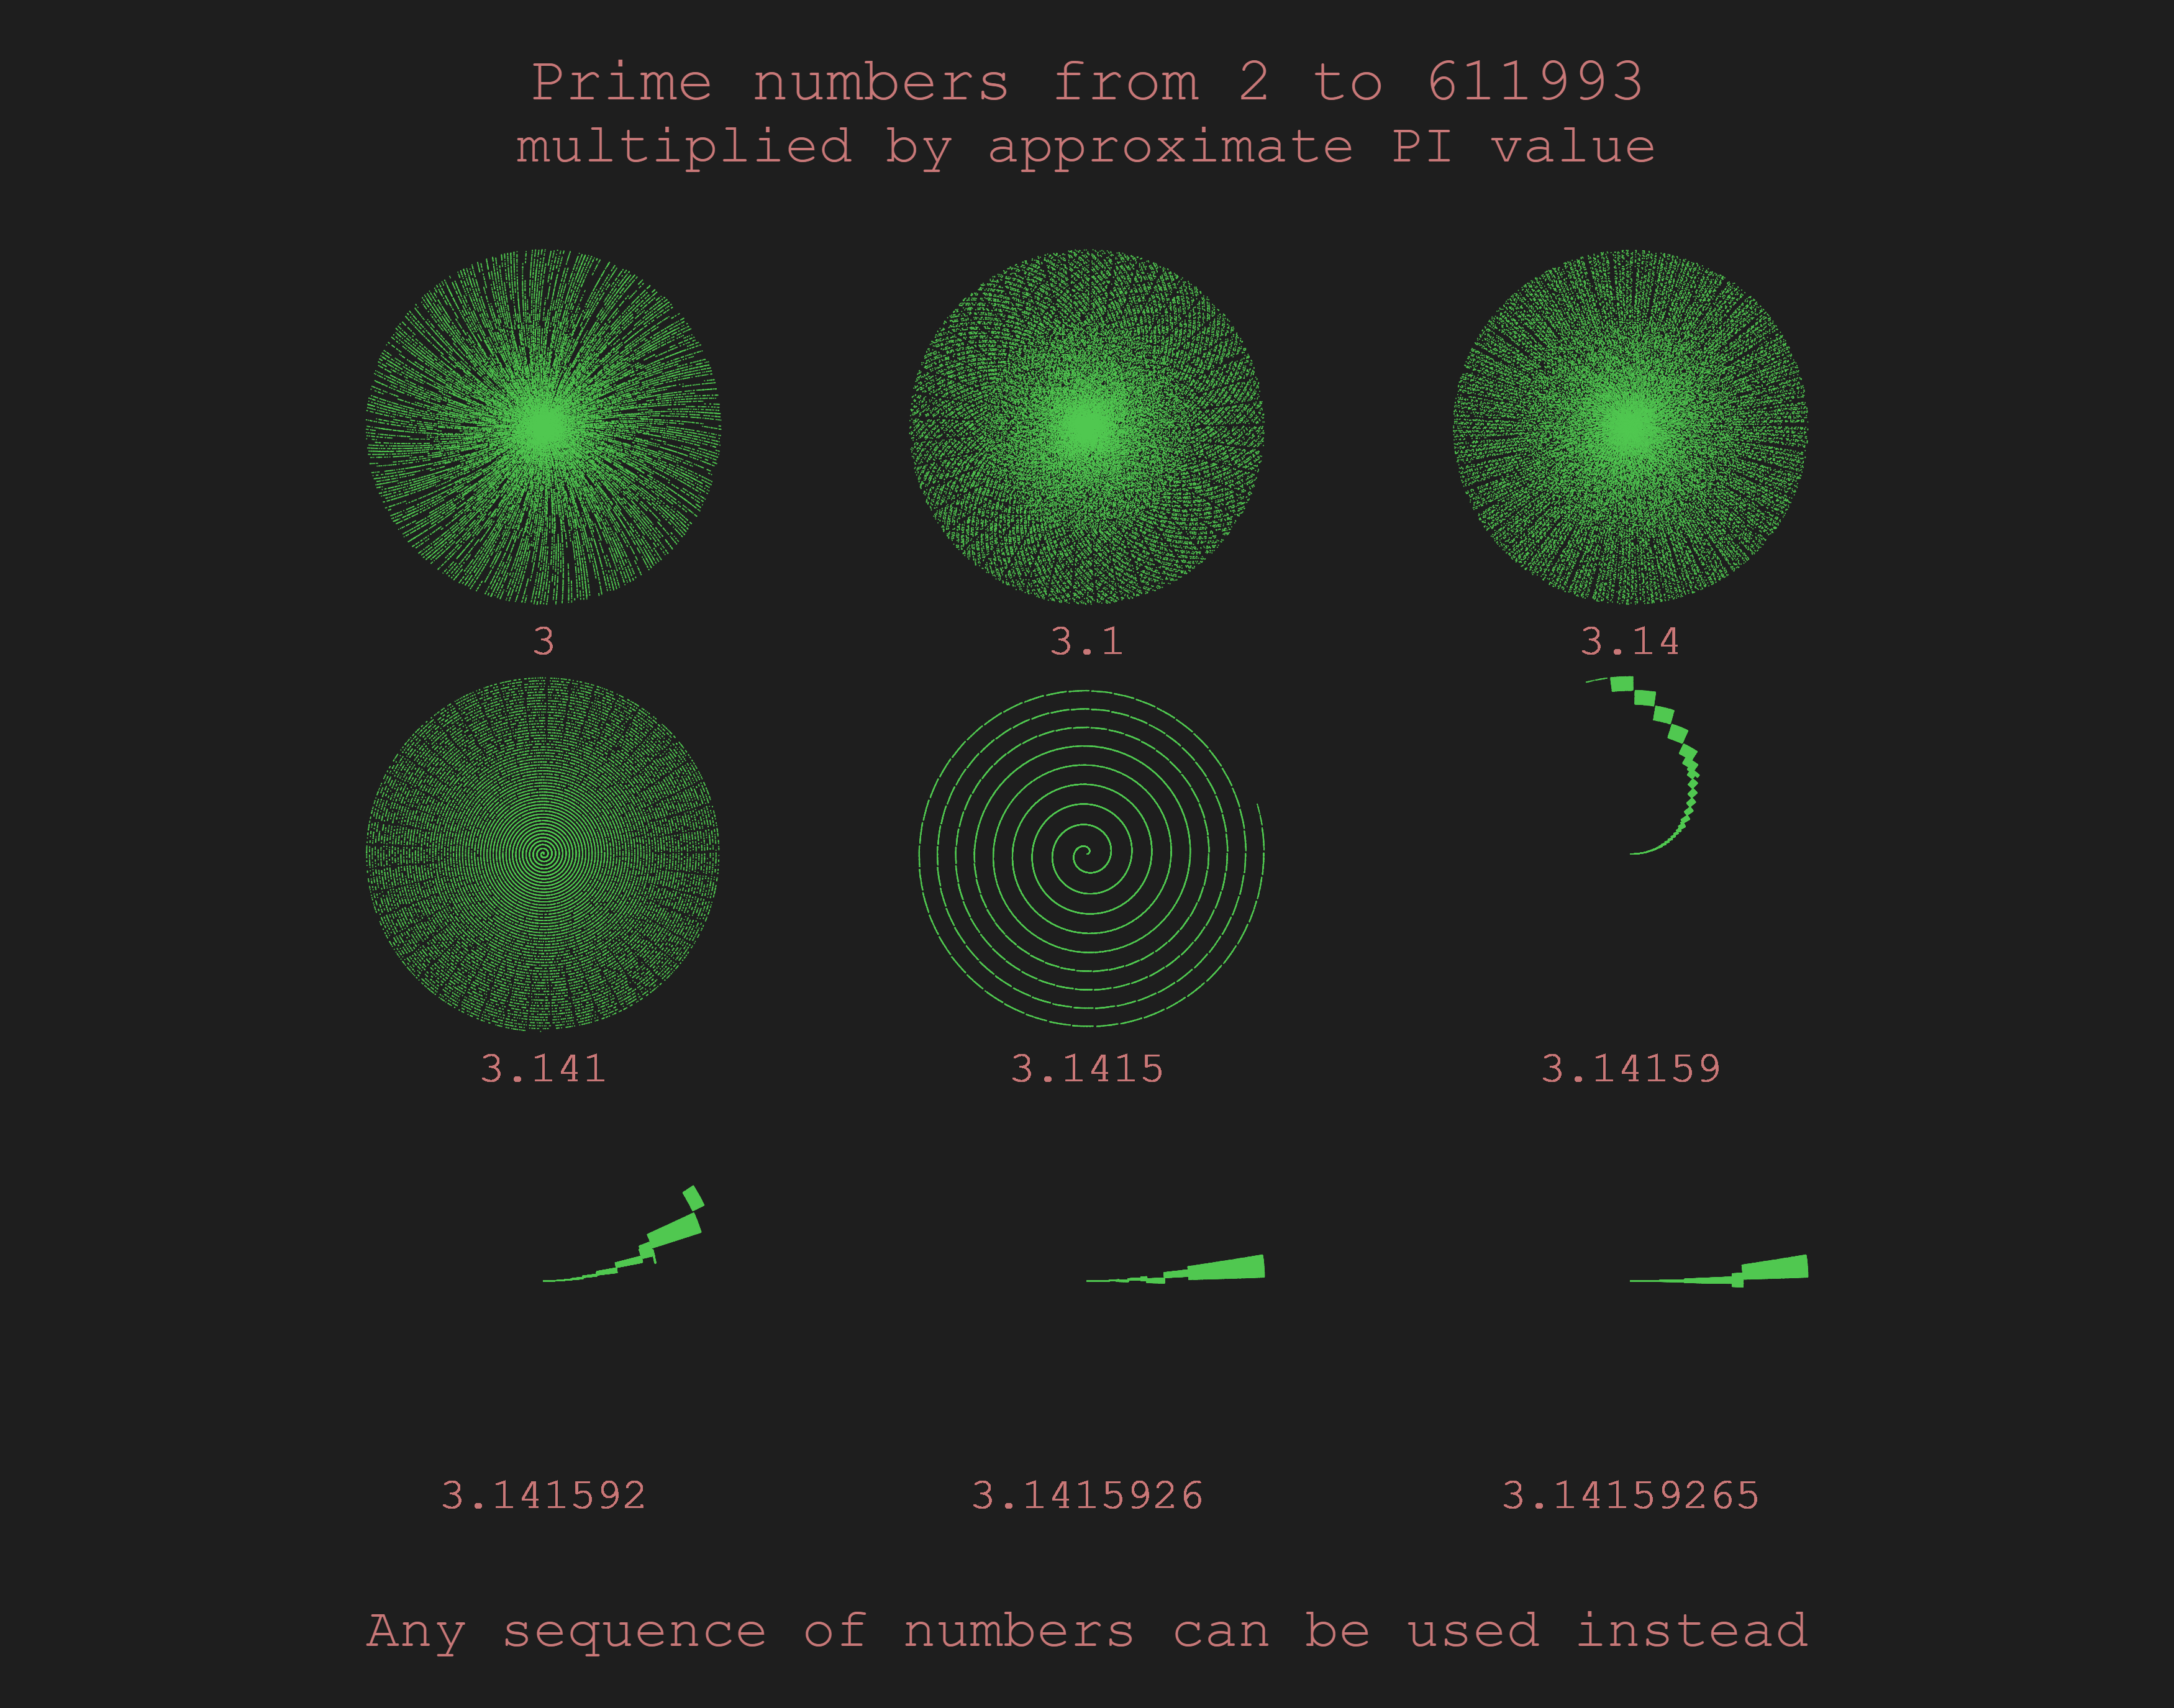
This time, I had to think what kind of data I wanted to visualize. For some reason, I did not want to use the real-world data. Maybe I wanted to represent something more general. After thinking awhile, I decided to use a list of prime numbers. I got the numbers from here.

This time, I will show the results first.

Click to view the full image – you can zoom in to see the details

Which is generated from the below:

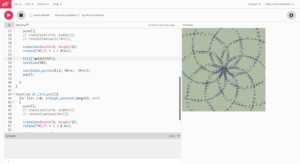
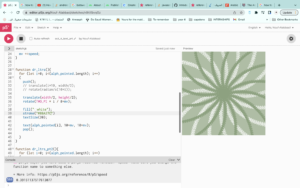
It does not mean much as data, but it shows an interesting pattern. Roughly speaking, what I am doing here is that I am printing out 9 different results based on different approximations of PI, each starting from the center and incrementing the distance from the center for each point. The position of each points is determined by the distance from the center and an angle, which is determined by the value of prime numbers multiplied by an approximate PI value. Those are shown in the code below.

function plot(num,row,col) {
  push();
  translate(col*width/4,row*height/4);
  for (let i=(frameCount-1)*500;i<frameCount*500&&i<numbers.length/2;i++) {
    push();
    rotate(Number(numbers[i])*num);
    point((-i/350),0)
    pop();
  }
  noStroke();
  text(num,0,numbers.length/700+40);
  stroke(80,200,80);
  pop();
}

The for condition here is slightly modified so it is 500 times faster than associating the drawing 1:1 with frameCount. It still plots all  the points I want.

Also, the visualization does not have to involve prime numbers. It could have been the incrementing number i, although it may have a bit different outcome.

Click to view the full image – you can zoom in to see the details

The label here is wrong, but the results are still interesting. It appears as if a tangled ball of string is unfolding as we approximate more precisely.

For the next project, if feasible, I will try to reuse the modified for condition because it has a big advantage of processing every step while speeding up. There is no need for frame rate modification.

Assignment #4 – Text Output

Concept:

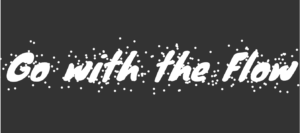
With this assignment, I didn’t have a particular vision in mind but instead wanted to focus on exploring and combining new skills that I haven’t tried yet. So, without an exact picture in mind, I searched up some tutorials on YouTube and found one that I really liked, which looked like this:

Process/Coding:

First things first, I had to figure out how to insert a font of my choice into p5.js because none of the default fonts appealed to me. For this I referenced this source, specifically the “custom font” section, from which I realized that I had to download a font file and insert it using a specific format name such as “.ttf” or “.otf.” Here’s the code that I used for uploading the font:

function preload(){
  font = loadFont('knewave.ttf');
}

My font was named Knewave, and it was taken from this website.

Once I had my font, I had to think of a quote or a phrase that I wanted to use, which was honestly the most no-brainer part of this assignment. I went with the first phrase that came into my mind, which was “go with the flow.”

For generating this text on screen, I used this code:

textFont(font);
 textSize(80);
 fill(255);
 noStroke();
 text('Go with the Flow',12,180);

After this, it got tricky as I tried to make the dots form into the shape of the letters and have them bounce off from each other, making them disperse after its initial shape. For this, I went back to the tutorial by The Coding Train and learned the idea of “function Vehicle,” which was what controlled the dots’ movements such as velocity, dimension, position, etc. I was also able to control the colors and the thickness of the dots in this “vehicle.js” file as well, which is shown below:

function Vehicle(x,y){
  this.pos = createVector (x,y);
  this.target = createVector(x,y);
  this.vel = p5.Vector.random2D ();
  this.acc = createVector ();
  this.r = 8;
}

Vehicle.prototype.update = function(){
  this.pos.add(this.vel);
  this.vel.add(this.acc);
}

Vehicle.prototype.show = function(){
  stroke(199, 236, 242);
  strokeWeight(7);
  point(this.pos.x,this.pos.y);
}

(original author of the code: Daniel Shiffman, here’s the link to the code)

Then, in order to bring in this vehicle function and actually draw the dots, I plugged the according values of variable points back into the draw function. But unfortunately, when I ran the program, it didn’t stay in this format long enough as I wanted them to:
Instead, they dispersed into a formless shape way too fast. And since I didn’t quite figure out how to slow the movement, I decided to just create the phrase in text form and let it sit there, while the dots will just bounce off from the letters, like this:

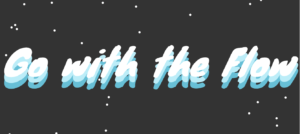
Because I wanted there to be more pop of a color rather than simply making it black and white only, I decided to create three text layers of gradient blue so that they will give an illusion of being more 3D. Here’s what it looked like after I was done layering the texts:
And finally, I decided to add a simple loop using the click of a mouse so that I could freeze the moment of the dots dispersing when the dots were at the desired pattern. And once you clicked on the screen once, you’d have to continuously press down on the screen for the dots to continue moving; if you released the mouse, the dots will stay frozen. For this function, I used the following code:

//stopping the dots in the pattern that you'd like
function mousePressed() {
  loop();
}

function mouseReleased() {
  noLoop();
}

And here is the final product!

Reflection:

The process of learning a new function (function Vehicle) and also learning how to animate the dots in a way that they start in an assemble before they disperse was an interesting process! It was a pretty tough concept to get at first because I was introduced to many new functions, but it also made the satisfaction at the end when I saw the final product be extra special as well. One thing that I’d like to change about my product is to have a “reset” button which will reset all the dots into its original place once it is pressed – this is something that I’ll hope to achieve in my midterm project!

dissolving matrix

concept:

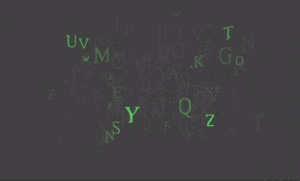
This week’s assignment required us to explore letters and text functions offered in the p5 coding program and make a program from that. I initially wanted to figure out a way in which I could somehow separate the letters in a word in a creative way. That said, I opted to delve into a ‘matrix’ and mysterious related theme.

code:

//modify how many letters you would like to have appear
letterAppear = 26;

function setup() {
  createCanvas(500, 300);
}

function preload() {
  //loading a matrix-themed font 
  fontMatrix = loadFont("assets/matrix.ttf");
}

function draw() {
  //setting the background color, transparency, text color, and random sizes
  background(80, 20);
  textSize(random(48));
  textFont(fontMatrix);
  fill("#64d86b");

  text(
    "*"
    //attributes that repeat the phrase "ABCDEF..." while mapping it into separate letters
      .repeat(letterAppear)
      .split("")
      .map((m, i) => String.fromCharCode(i + 97))[frameCount % letterAppear],
    noise(frameCount ) * 500,
    noise(frameCount + 1) * 300
  );
}

method:

It was essential to start laying out the text and knowing what and how to modify it. So, I uploaded a preferred font and set the size of the text and what the text would be. Then I played around with ‘text’ attributes such as ‘.repeat,’ ‘.split,’ and ‘.map.’ In the end, I was able to modify the text presented in a way that randomly separates its letters, which presents a fabulous sketch that reminds me of the matrix. A final thought I had, in the end, was lowering the transparency of the background, which previewed a dissolving effect on the text/letters presented.

sketch:

The following gif preview how the program displays the hacked matrix program!


(^ click me)

future improvements:

Adding some sort of secret message of a specific word that would randomly pop up would be a mysterious and engaging element to the program.

Arabic text

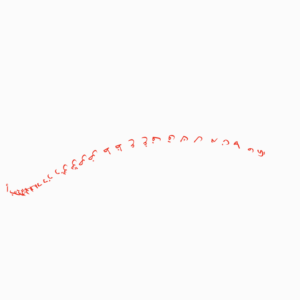
For this project we needed to create a data visualization. I wanted to explore Arabic text and how it could be displayed. I started by creating a list of the alphabet and playing around with how it looks with different transformations.

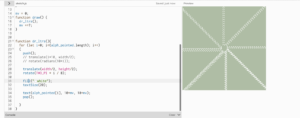
I started with some rotation and transformation

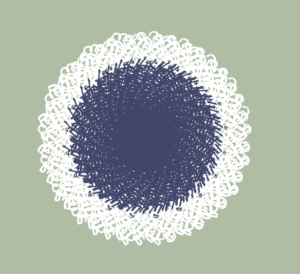
I then created a function that takes some of the alphabet and prints them, each would be rotated a little to create a circle and they would repeated across a line

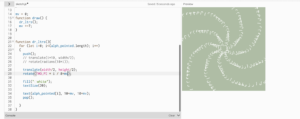
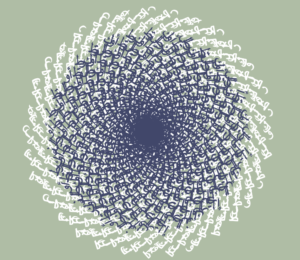
I then added movement to the rotation to create a swirl like shape


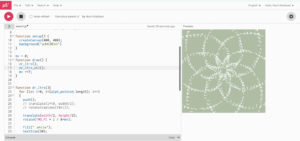
I reversed the swirl and printed it on top. Then I experimented with colors, sizes and numbers.

I then tried to reprint the background in the draw

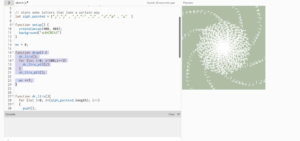
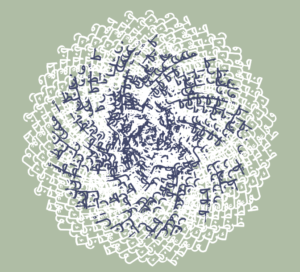
Then I thought it might be interesting to go back to the initial code and reverse the speed once the letters reach a certain position and re-add the background

This created something that was a little more readable. The next step would be to use Arabic text instead of random alphabets.

Aisha – Floor is Lava Midterm project

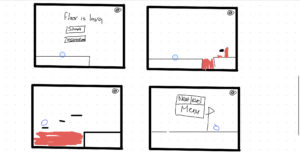
For my midterm project, I decided I wanted to make a floor is lava type of game where the player has to move from left to right without touching lava. There will be platforms in the game that can help the user as they can jump on it thus avoiding the lava. Once the user finishes a level they will have an option to go to the next level or back to the menu. At the beginning of the game, there will be the main menu where the start and instructions buttons are displayed. Furthermore, I might add background music or a sound effect when the user jumps (or both) to the game but there will be an option for the user to turn off the sound.

The user will move at a constant velocity from left to right. The user can press the up arrow button to allow the shape to jump. The background will be moving to the left to allow the image to scroll.


Inspirations:

I was inspired by games such as geometry dash and super Mario.

Geometry dash:

https://www.youtube.com/watch?v=HW41UNolUec

Super Mario:

Rising Tides of Lava - Super Mario Wiki, the Mario encyclopedia


Rough Sketch of the game:


This is all I have done so far:

let gravity = 0.5;

class Player {
  constructor() {
    this.x = 100;
    this.y = 320;
    this.d = 30;
    this.v = 0.05;
    //gravity
    this.xg = 0;
    this.yg = 0;
  }

  draw() {
    fill(15, 192, 252);
    stroke(0, 255, 255);
    ellipse(this.x, this.y, this.d);
  }

  update() {
    this.y += this.yg;

    if (this.y + this.d + this.yg <= height) {
      this.yg += gravity;
    } else {
      this.yg = 0;
    }

    // if (this.x < 400){
    //   this.x += this.xg;
    //   this.xg += this.v;
    // }
  }
}

class Platform {
  constructor(x,y) {
    this.x = x;
    this.y = y;
    this.w = 100;
    this.h = 20;
  }

  draw() {
    fill(0);
    rect(this.x, this.y, this.w, this.h);
  }
}

let player;
let platforms = [];

function setup() {
  createCanvas(800, 400);
  player = new Player();
  for (let i = 0; i < 100; i++) {
    platforms[i] = new Platform(i + 500, 300);
  }
}

function draw() {
  background(230, 143, 172);
  player.update();
  player.draw();
  for (let i = 0; i < 10; i++) {
    platforms[i].draw();
  }

  if (player.x < 400) {
    player.x += player.xg;
    player.xg += player.v;
    for (let i = 0; i < 10; i++) {
      platforms[i].x -= 5;
    }
  }

  // platform condition

  for (let i = 0; i < 10; i++) {
    if (
      player.y + player.d <= platforms[i].y &&
      player.y + player.d + player.yg >= platforms[i].y &&
      player.x + player.d >= platforms[i].x &&
      player.x <= platforms[i].x + platforms[i].w
    ) {
      player.yg = 0;
    }
  }
}

function keyPressed() {
  if (keyCode === UP_ARROW) {
    player.yg -= 10;
  }
}


There is obviously still much more I need to do however this was a quick test run I did to make sure I know what’s going on.

Things I need to add:

  • Change the look of the platforms
  • Add more platforms
  • Add a ground for the ball to be on
  • Add a better background
  • Add the lava
  • Add the title screen
  • Add the sound button
  • Add more levels

I’m looking forward to continuing to work on this project and hope that it ends up being similar to how I imagined it.

MidTerm Idea

Consept

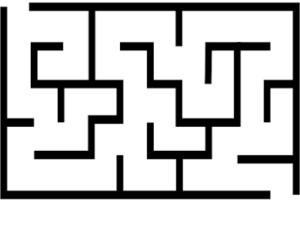
My initial idea had was to make a game that consist of randomness. in this class we discussed many topics and something that stuck out to me was randomness. it is both wonderful and frustrating. the main idea that i have is a maze that you can solve only by luck instead of skill. so you can reach a stop for example and only be able to pass it by flipping a coin and landing on heads. this maze will be very frustrating since you cant rely on skill its more of a game of chance.

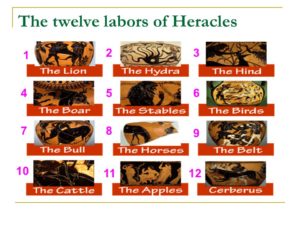
It will be more complex than this with a character and diffrent sections that make you reach the next trail. it will be like Hercules trails if they were based on luck.

Elements

the game will have

  1. the objects we learned with the maze
  2. the character is unable to move thru the walls
  3.   the trails start when the character reaches them
  4. if the character fails they start from the start

the project will contain

  1. sound when losing or through the trail (example the sound of flipping a coin)
  2. instruction page
  3. a dash board to shoe progress
  4. a start button
  5. a game over condition
  6. control over the character
  7. speech from the trails
  8. if you win a celebration command

I know this sounds relatively simple but I am  sure it will be very  challenging

Assignment 5: Generative Text Output

Concept

For this assignment, I decided to develop a simple generative text output program through a textbox. this textbox takes user input and displays them and has the following functionalities:

  1. User can use any language keyboard to enter text
  2. User input is stored letter by letter (except action keys e.g. Shift, Backspace, Enter, etc. which is stored as one keystroke/one word)
  3. User can enter capital letter words by pressing Shift + letter or by activating Caps Lock
  4. User can delete their input letter by letter using Backspace
  5. User can clear the whole text box using the <<clear textbox>> button

Code highlight

For the implementation of the textbox, I decided to not use any input functions and make it a bit more interesting. I’m using the function KeyPressed()  to store any key pressed by the user. The reason I picked KeyPressed() was that, unlike other functions such as KeyTyped() and KeyCode(), it recognizes the action keys such as Shift, Backspace, Control, Enter, Alt, etc.  These action keys are useful for implementing features such as erasing, moving to the next line, typing capital letters, etc. In this program, only the erasing and capitalizing are implemented.

// %%%%%%%%%%%%%%%%%%%%%%%%%%%%%%%%%
let text_array, len_array;
let box_obj, box_x, box_y, box_w, box_h, txt_stroke, txt_size;


function setup () {
  createCanvas(1500, 500);
  background(200);
  text_array = [];
  
  // clear text box
  clear_button = createButton('clear textbox');
  clear_button.position(width/30, height/4);
  clear_button.mousePressed(empty_array);
  clear_button.style('font-size', '18px');
  clear_button.style('background-color', 255);
}

function draw () {
  background(244, 194, 194);
  
  textSize(20);
  fill(255);
  let msg = "CLICK ANYWHERE ON THE TEXTBOX AND START TYPING";
  text(msg, width/30, height/2.5);
  
  box_x = 50;
  box_y = height/2;
  box_h = 100;
  txt_stroke = 7;
  txt_size = 45;
  
  box_obj = text_box(box_x, box_y, box_h, txt_stroke, text_array, txt_size);
}

function text_box (x, y, h, stroke, txt, size) {
    box_w = textWidth(join(txt, "")) + 30;  // width of the rectangle changes
    
    // box
    strokeWeight(stroke);
    fill(255);
    rect(x, y, box_w, h);
  
    // text
    fill(0);
    textSize(size);
    text(join(txt, ""), x + stroke, y + size);
    noFill();
    rect(x, y, box_w, h);
  }

function keyPressed () {
  len_array = text_array.length;
  
  
  if (key == "Backspace") {
    text_array.pop();
  }

  else {
    if (key != "Shift" && key != "Enter" && key != "CapsLock" && key != "Control" && key != "Meta" && key != "Alt") {
      text_array[len_array] = key;
    }
  }
  
  if (len_array > (width * 2)) {
    text_array.splice(0, 1);
  }
}

function empty_array () {
  text_array = [];
}

// %%%%%%%%%%%%%%%%%%%%%%%%%%%%%%%%%


Embedded sketch:

Reflection and ideas for future work or improvements:

This simple textbox is the foundation for a simple browser text editor. Some natural next steps for improving the above textbox program would be:

  1. Implementing a blinking cursor (like in the text editors)
  2. Implementing the cursor’s move to the next line (using Return/Enter action key)
  3. Implementing a feature where pressing and holding down a key would continuously add that key to the textbox (with the help of keyReleased())
  4. Implementing features to modify the text’s font, size, and style from within the editor itself.

Assignment 4: Data Visualization and Generative Text | Midterm Idea

I wanted to do data visualization for this assignment, but I used the words in my csv to add to the visualization as well. The file I used is an excel spreadsheet of my spendings from a semester in New York City. I had five values: date, amount spent, category, payment method, memo. I mainly used amount, category and memo.

Coding Process

I began by following the same process that we did in class for the wind turbine example.

function draw() {
  background("#394053");
  noStroke();

  title();

  //separate each row of the csv into another array
  // put the array here instead of set up b/c when I tried to access singleRow[1] outside of the loop it didn't show the correct value
  for (let csvRowNumber = 4; csvRowNumber < strings.length; csvRowNumber++) {
    singleRow = split(strings[csvRowNumber], ",");
    text(singleRow[MEMO], random(width), random(70, height));
    ellipse(
      random(25, width - 25),
      random(90, height - 25),
      float(singleRow[AMOUNT] * 2.5)
    );
    noLoop();

    fillCircles();
  }

The difference is that I put the for loop in draw rather than setup. I tried using singleRow outside of the loop, but it would only give the last line in the strings array, so I have to do most of the “drawing” inside the loop as well.

I also had another function specifically for filling the circles, because it was just a bunch of if statements. I used the category column in my csv file to correlate the colors to the amount. So the size of the ellipse is based on the amount while the color is based on the category.

I felt like it was a bit empty, so I added the memo text as well. I wanted it to be transparent and in the background, but it didn’t really work out the way I wanted it to.

Future Improvements and Ideas

I have quite a lot of improvements and ideas for this assignment. Currently, it looks really busy and messy, so I want to make it less crowded and more of an “organized mess”. I also wanted to add lines connecting the ellipses to each other using the date, but I wasn’t sure how because 1) I would need to use points instead of ellipses, 2) I would need to know the coordinates and 3) I can’t use the date because it’s not formatted like an integer or float. One idea I had was using map() for the dates to correlate with where the circles are. But the problem was figuring out how to connect the ellipses with a line when I don’t know the x and y, since it’s random…

Another idea I had was was to place the ellipses in random spots but with no overlaps. I watched a video on how to do this and I attempted it using class, but it didn’t work out. So this is something I would like to work on in the future as well.

Overall, I personally feel like working with a csv file is harder than working with JSON. I’ve done a data visualization before with JSON, so it was interesting to try a different method of using files in javascript.

Midterm Idea

My idea for the midterm project is to do something similar to i-Spy. The things necessary for this idea are:

      • Mouse clicking on the image that the user needs to look for
      • Uploading images
      • Checking for if the user picked the right image
      • Sound effects for when the user correctly finds the object
      • Counter for the objects found
      • Restarting the game