Yunho Lee Second Assignment – Raindrops

The concept of my artwork is displaying the splash raindrops makes when it hits the puddle. I wanted circles to be created in random positions with different timings since not all raindrops drop at the same time.

First task: Creating a Circle in a random position

This task was fairly simple compared to the other one. I created my code in an object-oriented way by making an object named splash (which is stated as a function in the script). Then, I give two random variables that are used for the x and y coordinates of the circle.

for (i = 0; i < 20; i++) {splash[i] = new Splash(random(50, 350), random(50, 350), i*8);}

As a result,  I create 20 circles that have random starting x,y coordinates.

Second task: Display the circle at different timing

It was challenging to find a way to make circles appear at different timings. The solution to this problem was to give different large number indexes to every circle that will constantly decrease until 0, and let them start to be drawn when the index becomes 0. This delays the initiation of drawing and results in displaying circles at different timing.


Assignment 2

This is assignment is based on using loops to design art and it was more of automating the designs rather than doing repetitive things again and again.

While I had completed this assignment with another design, I got another idea after seeing a filter on Instagram and I wanted to merge these. However, I kept them separately for the time being The idea was around optical illusion as well.

It required heart shapes, so I took the heart shape function code from here.
To figure out the pattern and visualize what I wanted, I created a non-iterative model:

After some time of playing around with the code, I figured out how to loop and draw the hearts. However, now what was challenging was to have different colors. I used if-else conditions to alternate the colors using the odd-even method. The next challenge was to make sure the colors changed and for that, I used a random function.

✨ Final Look ✨:

—first design—
I browsed the web for inspiration, and with the first search result, I came across this P5js code with a few lines halfway through the screen.

The reference/idea:

It is a pretty simple use of lines. That gave me the inspiration to create a moving illusion pattern like this:

Optical illusion lines background. EPS 10 vector illustration

I started playing around with the code, changing colors, the orientation of the lines and it turned out like this, pretty different than what I expected.

Final Look:

I basically used loops, to draw lines in different orientations and spacing, used if-else conditions to change their colors. I also added a circle that moves with the cursor using mouseX and mouseY functions that changes its color on every click (used mousePressed function).

Assignment 2

Before beginning this assignment, I was watching a ton of videos online. The loading symbol in the shape of a circle which would show up when the video was buffering stood out to me a lot. This shape and movement stayed in mind while I began assignment 2, and so I decided to center my work around that.

I was able to recreate the movement of the shape using a for loop by changing the length of the arc in each iteration. To mimic the multiplicity of speeds a loading bar has depending on internet connectivity/buffering speed, I also decided to make each arc move in different speeds ranging from (-2,2).

Since 1 arc wasn’t achieving a visually fulfilling motion, I decided to make multiple arcs using a for loop as well.

One challenge I faced for this project was making the ends of my arc lines  fade off just like in the reference image above. In order to make up for that, I managed to successfully apply the lerp color gradient background which I attempted to use for Assignment 1 but was unable to, this time it worked well as part of my process.

Credits for the lerp gradient

Assignment 2 – Generative Art

I think this assignment was really challenging for me compared to the first. I was struggling to use p5 so I searched up many tutorials online on how to make generative art. I took inspiration on the professors example but with more squares, more color, and more randomness. I tried to play around with all the settings to conjure up something new as I was still trying to familiarize with p5.

Simple Work of Art

After looking at the images, the first image stuck out to me, specifically, the lack of order in the image. In my own, I added color to highlight the disorder as well as add disorder with the contrast between the colors.

For this week’s assignments, I had many different ideas on what I wanted to do, but instead of exploring the many ideas, I found myself playing with this one for a long time, making small changes to see what it would do to the image, changing the size of the rectangle, the color of the fill, background, and stroke. While working, I was listening to music, and it was so satisfying to watch the music somehow sync with the visual image, which I think could also make for an interesting future project.

While I previously used the push and pop function for a very simple result, understanding the function, was important as changing the angle component of the function could make a significant change to the final result. In the future, I would aim to make it more 3-D looking to get a result like or even add a shape in the background to give a layered look as seen in the first image:

Assignment 2: Computer Graphics Art

The beauty of Spirographic Art

I drew inspiration from one of the sketches in the Computer Graphics and Art book and started to experiment with lines and loops to see what creative and motion graphics i could create with all the knowledge we have acquired in class.

Here is the image of the Computer Graphics Art that inspired me.

After getting some practice with the looping and line strokes i wanted to create a rotating motion like figure with line strokes that would alternate in colors.

In order to get the motion correct i had to make sure I got the degrees and angles correct and being able to move them by a small angle. After watching Dan Shiffman’s video on rotate and Transformations I was able to learn the translate() and angleMode(DEGREES) functions and how to properly used them.

Here is a link to his p5.js tutorial video https://www.youtube.com/watch?v=o9sgjuh-CBM.

I started coding by initializing the global variables that i might need such as storing X and Y coordinates the color values and the boolean flag to alternate the colors. Then I began by creating the canvas and setting up the background color values. I used the random() function inside the color for all the RBG arguments so that i can get a new color on everycall. I also used a predefined alpha value as the transparency of the color.

I setup the X and Y position to be in the middle of the canvas as i wanted it to start from somewhere in the middle of the canvas since the range of the random spawn would be controlled by the new_step offset value. 

Inside the draw function i started by translating the X and Y position and rotate by the angle variable which was initialized as 0 but would increment by 1 every frame. I also created the line and played around with the x2 and y2 coordinates. I used to colorFlag to change the color of the stroke of the lines. 

After this i decided to increment both the X and Y position by 1 to move the next line a little bit. I also had a checking function which used the angle variable and checked if it was more than 360 if so it would reset the X and Y positions by randomly adding a new spawn distance from the step offset range, while setting the angle back to 0. In other words this allowed the circle of lines to start again from a new random location once it was completed. 

Lastly, something that i wanted to solve was the problem of the X and Y position to be out of the canvas. Thus i used 4 if conditions to see if it coordinate was greater than the canvas size if so i set it back to zero. Else if it was less than 0 then i simply set it to the canvas dimension (width and height). This allowed me to the wrap the design around and continue back on the canvas.

In order to make the sketch visually appealing I tried to remove the restarting aspect at a random location and started to create continuous spiral which wrapped around the whole sketch in a diagonal manner.

Breathing Cubes – Assignment 2

Breathing Cubes

My inspiration for this week’s assignment came from this image below called Boxes: This is taken from the book, Computer Graphics and Art Vol. 2, No. 3 which can be found here.

I thought it looked really cool how the blocks were falling apart in the middle and the rotations were getting less and less chaotic towards the end.

I wanted to achieve a similar effect of rotating cubes but with some more interaction (it is interactive media after all!).  To begin, I just laid out cubes on a canvas of size 600 x 600 using the for loop that we learned in class.

This was fairly simple to achieve but the real trouble began after this. How do I make it rotate? This was the hardest challenge of the assignment since I wanted the rotation to somehow be associated with the movement of the mouse so that the user can interact with it. At first, it was chaotic as everything was just being thrown around.

But I was able to fix this using the translate function and with a  couple of iterations, I was able to get the rotation around the center of the rectangles. I tracked the distance between the mouseX and mouseY to the rectangle to determine the angle to rotation and things were looking good.

I wanted to another concept we learned in class, Perlin noise. So I decided to use the frameCount and mouseX and mouseY to add some movement to the cubes and the color even without any input from the user. This leads to a slight movement in the cubes making them look alive.

The final result is down below and I hope you like it!

You can find the code down below or in this GitHub repo:

const rectWidth = 50;

function setup() {
  createCanvas(600, 600);
}

function draw() {
  background(255);
  rectMode(CENTER);
  // for consistent color output
  noiseSeed(4)

  // laying out the squares
  for (let rectY = rectWidth / 2; rectY < height; rectY += rectWidth) {
    for (let rectX = rectWidth / 2; rectX < width; rectX += rectWidth) {
      // noise factors for color and angles
      let frameFactor = noise(frameCount * 0.005);
      let mouseXFactor = noise(mouseX * 0.001);
      let mouseYFactor = noise(mouseY * 0.001);

      // push and pop for translation and rotation
      push();
      let colorValue =
        255 - (abs(mouseX - rectX) + abs(mouseY - rectY)) * frameFactor;

      fill(colorValue, mouseXFactor * colorValue, mouseYFactor * colorValue);

      translate(rectX, rectY);

      // changing this will change the intensity of the rotation
      let rotationFactor = 800
      let angle =
        ((abs(mouseX - rectX) + abs(mouseY - rectY)) /
          (rotationFactor + frameFactor * 1000)) *
        TWO_PI;

      rotate(angle);

      rect(0, 0, rectWidth);
      pop();
    }
  }
}


Boxes, Assignment 2

I picked the design Boxes I by William Kolomyjec to recreate in this assignment.

This image fascinates me. As the viewer, I naturally focus in the center of the image where the distortion in the boxes is the greatest. It feels as if my gaze is what’s causing that distortion. This is why I wanted to recreate, or create something similar to, this piece.

I started by creating a grid of squares – 10×17 squares on the canvas – using nested for loops. The first for loop is used to address the rows, creating rectangles starting from the left most to the right most side of the canvas. For every rectangle created in this row, the second nested for loop adds rectangles as columns for the row.

I thought of many views to achieve the same distortion effect as seen in the original image. The most important underlying concept in all those methods was that the lesser the distance of the squares from the center of the canvas, the greater the distortion. Using four if-statements, and dividing the canvas into quadrants, I record the above mentioned distance for every square into two variables: randx and randy. I also reserve a small rectangular space in the middle of the canvas where no squares are drawn (to achieve a higher distortion).

Finally, I use the random function coupled with the corresponding randx and randy values to set offsets for the coordinates for every squares. While experimenting with colors, I found an aesthetic combination and decided to implement it – instead of adhering to the style in the original. Here is what I came up with:

In the future, I will try to implement a rotation relative to the square’s distance from the center in all the squares to enhance the distortion effect in the original image.

Assignment 2: Looping

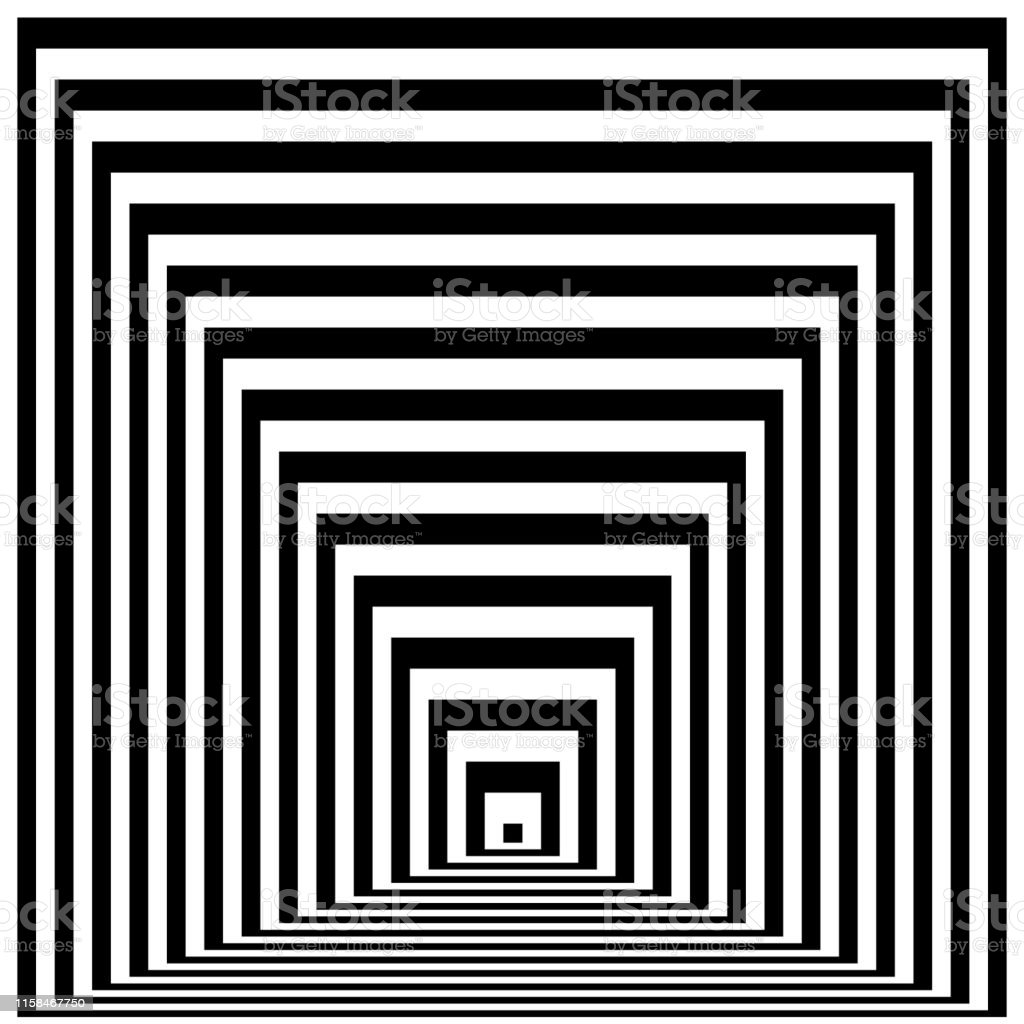
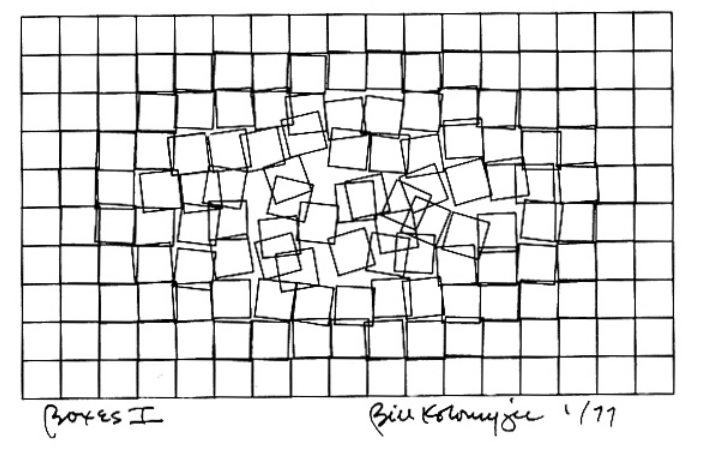
For the second assignment, I took inspiration from Random Squares by Bill Solomyjec.

I liked the idea of incorporating randomness in a controlled manner and how each square was unique.

Implementation

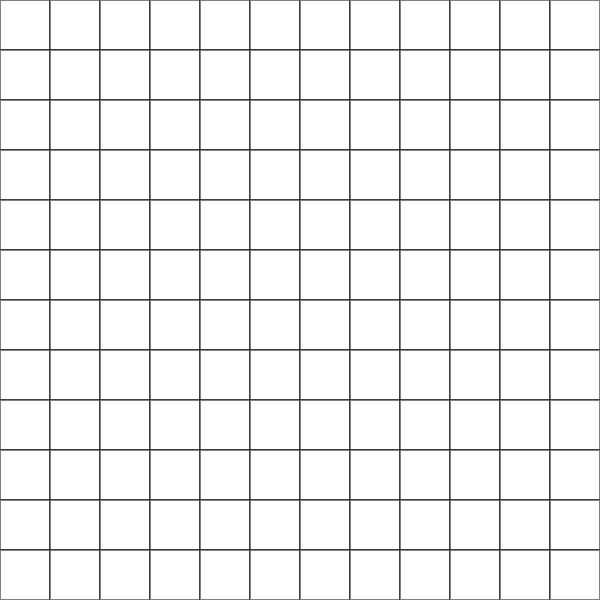
I figured that I needed to first created a grid within my canvas. I was able to do this by using variables and loops to divide the canvas evenly.

let square_length = 80;
let num_rows = 5;
let num_cols = 8
createCanvas(square_length*num_cols, square_length*num_rows);
for(let row = 0; row <num_rows;row+=1){
    for(let col = 0; col<num_cols;col+=1){
      let startx = col*square_length;
      let starty = row*square_length;
      fill(255)
      square(startx,starty,square_length)
    }
}

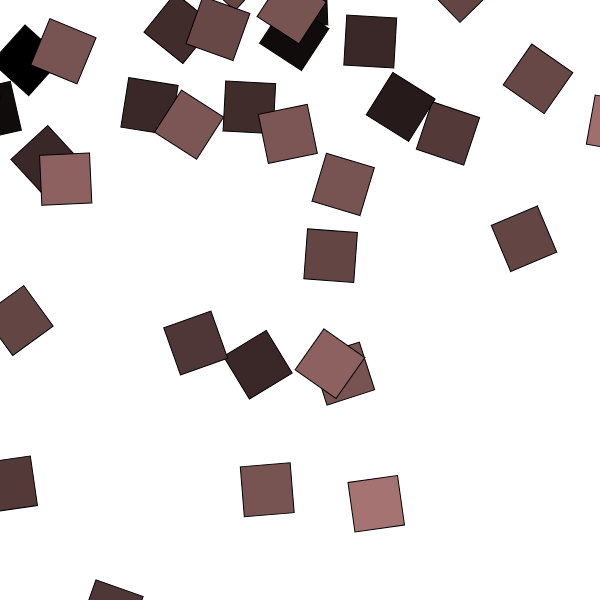
Then I figured for each square within the grid, I needed a number of random values: an offset for the initial square, a random ratio in the x and y direction for the squares to grow, and a random gap between each square to multiply the ratios by.

I implemented them via multiple 2D arrays in the following way:

for(let row = 0; row <num_rows;row+=1){
    currrow = []
    for(let col = 0; col<num_cols;col+=1){
      currrow.push([random(minoffset,square_length-base_length-1),random(minoffset,square_length-base_length-1)])
    }
    offsetlist.push(currrow);
  };
  for(let row = 0; row <num_rows;row+=1){
    currrow = []
    for(let col = 0; col<num_cols;col+=1){
      currrow.push([random(maxratio),random(maxratio)]);
    }
    ratiolist.push(currrow);
  };
  for(let row = 0; row <num_rows;row+=1){
    currrow = []
    for(let col = 0; col<num_cols;col+=1){
      currrow.push(random(mingap,maxgap));
    }
    gaplist.push(currrow);
  };

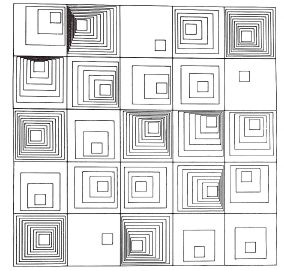
Then, using these values, I could draw each square in each grid location by extracting these random values as I drew each grid square.

for(let row = 0; row <num_rows;row+=1){
  for(let col = 0; col<num_cols;col+=1){let [xoffset, yoffset] = offsetlist[row][col]
      let [xratio, yratio] = ratiolist[row][col]
      let squaregap = gaplist[row][col]
      for(let sqoffset=0; sqoffset<min(xoffset/xratio,yoffset/yratio); sqoffset+=squaregap){
        let offsetedx = startx+xoffset-sqoffset*xratio;
        let offsetedy = starty+yoffset-sqoffset*yratio;
        let offsetedlength = base_length+sqoffset*(1+max(xratio,yratio))
        square(offsetedx,offsetedy,offsetedlength);
      }
  }
}

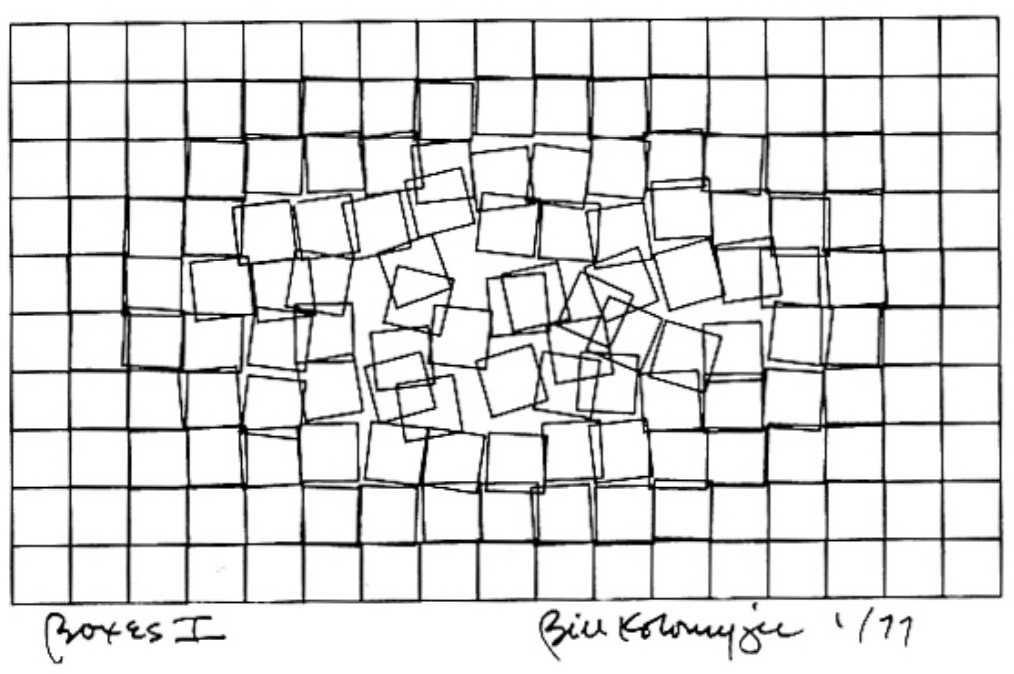
The min(xoffset/xratio,yoffset/yratio) in the innermost for loop controls the boundaries of the largest square, ensuring that the squares do not extend beyond the top or left of the grid. This prevents a lot of the potential chaos.

Kashyapa Week 2

For this assignment I picked the following image to recreate.

I decided to start by using a for loop to draw the long thin vertical lines first. I noticed that some lines were shorter than others and their starting positions on the y-axis slightly varied. Also, they were slightly to the right and the distance between each one of them was also slightly different for each line. To achieve these parts of the image, I used a for loop using i to change where the lines appear and also used the random function a number of times.
Then I used a lot more for loops to make the blocks of lines appearing in the image. Finally I used rect to generate the black rectangles seen in the image.

This is what my recreation looked like: