Midterm progress

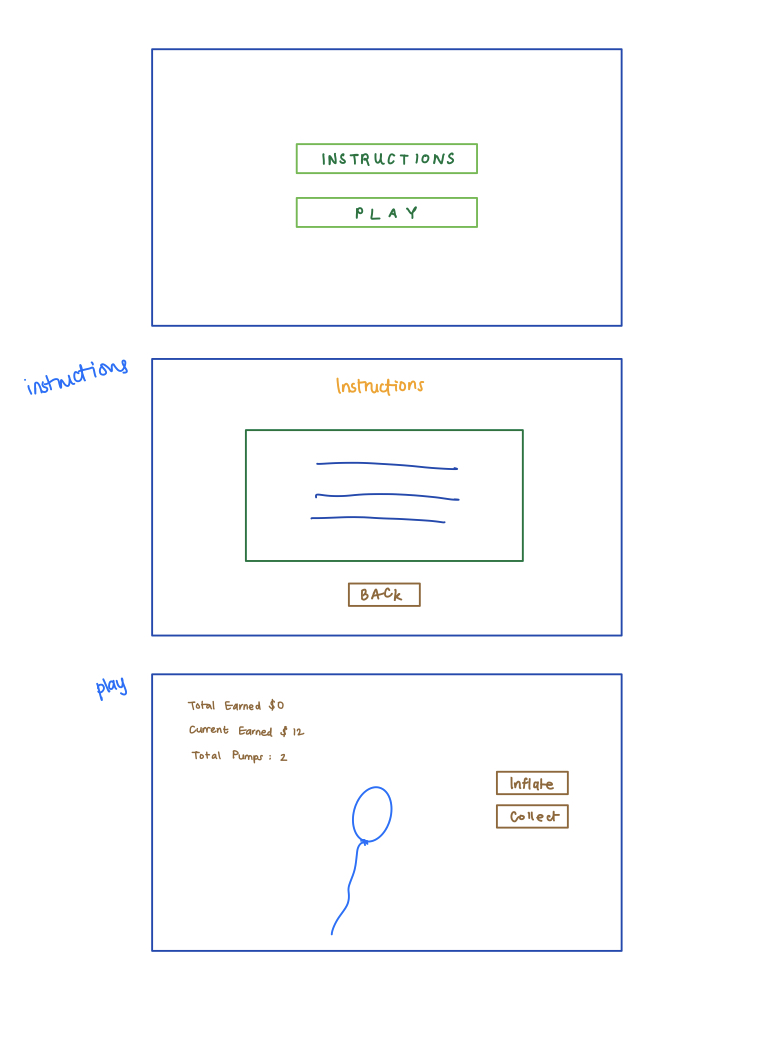
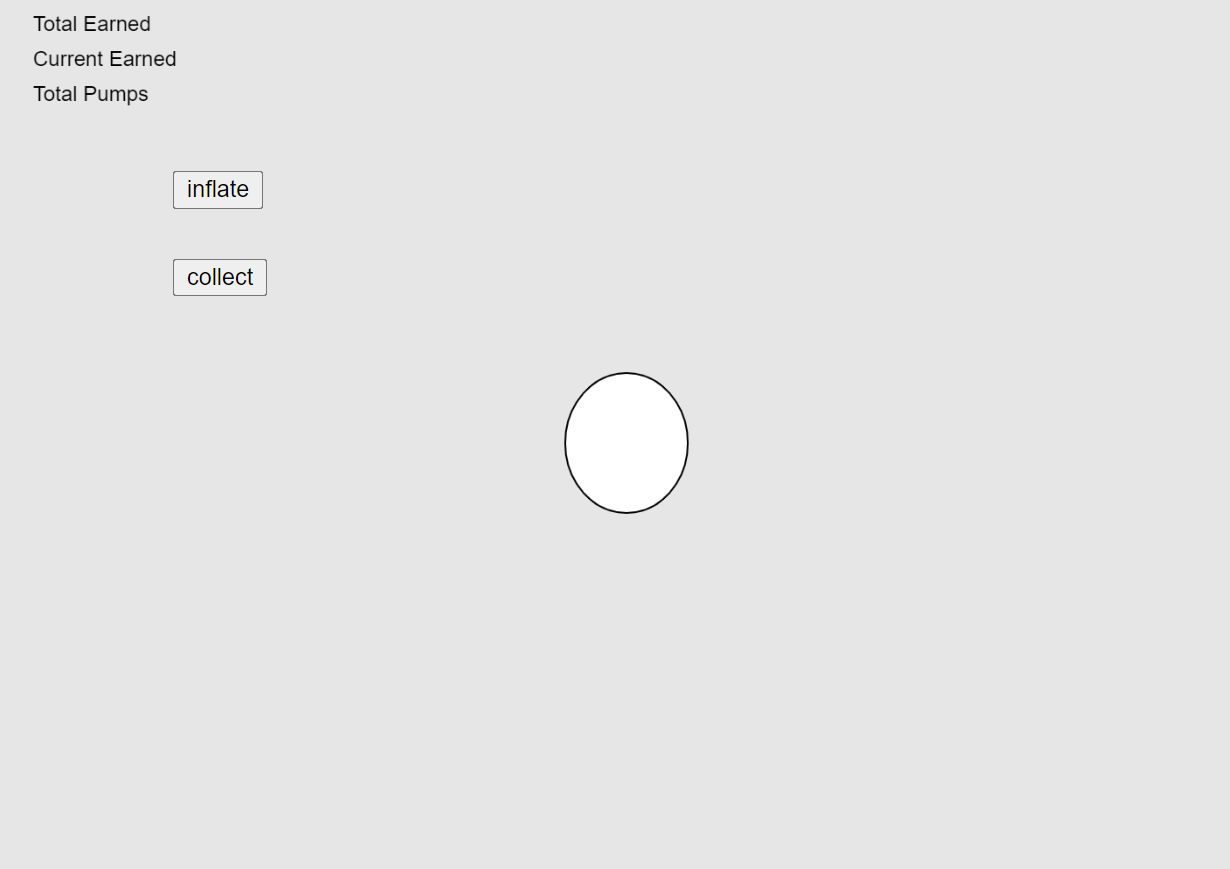
For the midterm, I’ll be working on a balloon inflation game. The idea is to inflate the balloon using a button and the more you inflate it the more money earned, but the more you inflate it, there’s a higher risk for it to burst and the money earned is 0. For 1 game, there will be a total of 7-10 balloons that burst randomly at different sizes. The landing page will have two buttons, instructions and play button. The game page will have to buttons: inflate and collect. Inflate makes it bigger by *1.2 and increases the “current earned”. Collect resets the balloon size and “current earned” and increases “total earned”.

Idea

Progress

Midterm – Progress Check

Concept

The current idea that I have for my midterm game is a recreation of a minigame from Mario Party named Goomba Spotting. In the game, players are tasked with accurately tallying the number of Goombas (mushroom-shaped creatures from the Mario series) that run across the screen. The Goombas run at varying speeds and overlap each other to make it difficult to count them. The hope is that I will be able to reproduce these mechanics and effects in p5js!

Progress As of Now

My main focus has been on replicating the main mechanic of the game—namely, the Goombas and their “walking” behavior. After much trial and error, I’ve managed to figure out a way to make things work. Crucial to this process was how I created this class specifically for the Goombas:

//Create Class for Goombas
class Goomba {
  constructor(){
    this.xPos = 0;
    this.yPos = 492;
    this.xSpeed = random(5, 10);
    this.ySpeed = 0;
    this.check = false;
  }
  //Used to "Stall" Each Goomba to Make Them Come Out in Order
  stall(order){
    if(frameCount % (30 * order) == 0){
      this.check = true;
    }
  }
  //Changes Goomba's Position Based on Speed
  move(){
    if(this.check == true){
      this.xPos += this.xSpeed;
      this.yPos += this.ySpeed;
    }
  }
  //Draws Goomba
  draw(){
    image(photo, this.xPos, this.yPos, 60, 70);
  }
  //Constantly Randomizes Goomba Speeds
  random(){
    if(frameCount % 20 == 0){
      this.xSpeed = random(0, 15);
    }
  }
}

This class then works in tandem with an array and a for() loop in the setup() function to generate a random number of Goomba objects—their appearances and movements on the screen are then facilitated through another for() loop in the draw() function:

//State Variables
let goomba = [];
let randI;

function setup() {
  //Generate Random Number for # of Goombas
  randI = random(15, 30);
  randI = Math.round(randI);
  //Generate Multiple Values in Array for Multiple Goombas
  for (let i = 0; i < randI; i++){
    goomba[i] = new Goomba();
  }
}

function draw(){
  //Functions for Each Goomba
  for (let i = 0; i < randI; i++){
    goomba[i].stall(i + 1);
    goomba[i].draw();
    goomba[i].move();
    goomba[i].random();
  }
}

And now, the Goombas in motion:

Moving Forward

I’m glad that I was able to figure out how to make a major component of my game work! There’s obviously a lot more left to do, ranging from creating the start/end screens and implementing the Goomba-tallying system—but my success so far gives me hope that I will be able to make my concept come to life! Here goes.

Assignment 4: Generative Text

Concept

The demo for generative text we saw in class piqued my interest, and I knew I wanted to try my hand at it. After reviewing the code and how it all worked (it took a little bit of time, but I think I got it!), I decided to write a generative poem of my own.

Highlights from the Process

I started off by writing a short poem, then deciding which words would be interchangeable. After settling on seven such words, I used Google Sheets to type up a CSV file containing five possible options for each word. It was on to the coding from then.

The first order of business was to create constant variables for the seven words, which I convenient named WORD0 ~ WORD6, and assigned them the corresponding values of 0~6. This looked like const WORD0 = 0; const WORD1 = 1; and so on. These values are to be used as index numbers later on.

I then created an array named wordArray[] for the interchangeable words, then loaded the CSV file into the array using this block of code:

//Create Array for Words
let wordArray = [];

//Load CSV File; The file is named thoughts.csv
function preload() {
  wordArray = loadStrings("thoughts.csv");
}

After creating the canvas in the setup() function, I moved on to the draw() function. This is where the real challenge lie. I first created an array named lines[] for the 8 lines of the poem (it will later be called for displaying the actual poem) and then created 8 blank values by using the for() loop:

//This is in the draw() function.
  //Create Array for 8 Lines of Poem
  let lines = [];
  //Load Array with 8 Blank Values
  for (let i = 0; i < 8; i++) {
    lines[i] = "";
  }

And now, the following block of code is perhaps the most important:

//This is in the draw() function.
  //Create Array for Retrieving Words from CSV File Array
  let singleRow = [];
  //Retrieve Random Word from First Column of File Array
  singleRow = split(wordArray[int(random(0, wordArray.length))], ',');
  //Using Constant as Index Value, Load Array with Line 1 of Poem
  lines[0] = "There we sat in the " + singleRow[WORD0] + ",";
  //Repeat Process for Each Word and Line

As explained in the comments, this code block  1) creates an array named singleRow[] that will be used as the designated container for words chosen from the aforementioned wordArray[]; 2) retrieves a random word from the first column of wordArray[]; 3) loads lines[] with the first line of the poem. 2) and 3) are then repeated for each word and line to fill lines[] with the rest of the lines of the poem with randomly chosen words.

After all 8 lines of the poem are loaded in lines[], a for() loop is used to display the poem as text in the canvas:

//This is in the draw() function. 
  //Display Poem
  for (let i = 0; i < 8; i++) {
    let xPos = 40;
    let yPos = 95;
    textSize(16);
    textFont('Georgia');
    text(lines[i], xPos, yPos + 30 * i);
  }
  //Stop Loop Until Mouse is Clicked
  noLoop();
  }

As seen at the bottom, noLoop() is used to stop the draw() function from looping. And finally, using mouseClicked(), a condition for generating a new poem is created.

//New Poem is Generated When Mouse is Clicked
function mouseClicked() {
  loop();
}

The final product:

Click on the canvas to generate a new poem.

Reflections

I initially had a little trouble wrapping my head around the mechanics of generative text, but figuring out how the code worked was an exciting journey in itself. It was gratifying to be able to make my own little piece and prove to myself that I had really understood everything.

It’s undoubtedly a very simple piece, but I’m not sure if embellishing it would really add to it. There’s certainly more I could have done with it, like making the background flashier or adding music—but I do rather like the silent atmosphere in which it basks. Such complexities will be plentiful in the midterm.

There we sat.
Midterm Progress Check

Concept: 

The idea of creating a snowball fight game for my midterm project actually was totally out of the blue; I was listening to Christmas carol playlist as usual (yes, I’m that person who puts Christmas songs on repeat since September till the actual holiday), and was thinking about how it’s such a shame that I won’t be able to have a snowball fight with my friends in the UAE this winter, when I realized that I actually can have one…via game! 🙂

Process/Coding:

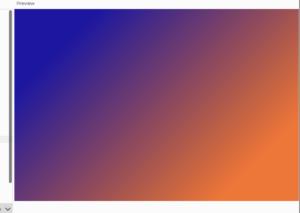
Once I had this idea in mind, I immediately jumped to work. The first thing I did was creating the background canvas, which I envisioned as a gradient background of black – navy – orange in order to make it obvious that the game is set during the nightfall. This is the link to the code video by Kazuki Umeda that I used to get help in learning how to create gradients in p5.js, and here’s the link to the actual code.

One interesting thing I learned from this tutorial was how to create gradients by using a function called linearGradient, which was simpler than I thought it would be! The result ended up being like this:
It ended up being the perfect background color for my snowball fight game. 🙂

So far this is all I have, but I’ve brainstormed some ideas on how this game should work:

  • Involve two characters
  • The goal of this game is to reach exactly 30 points by throwing either small, medium, or large sized snowball. Whoever reaches exactly 30 points first wins the game.
  • Each character will have the choice to choose which snowball size they’d like to throw (I’ve yet to decide the points for the different snowballs) each round.
  • Both players will take turns (player A throws, then player B throws).
  • They will have “battery” shown above their heads to indicate just how much points they have fulfilled so far.

To be completely honest, I’m not sure how much of this vision I’ll be able to fulfill with my limited skills, but I hope I’ll be able to make at least most of this idea come true on screen. I’m so excited to see the progress I’ll make throughout this next week on this project!

Aisha Assignment 4 – Data Visualisation

Initially, I wanted to create some sort of data visualization surrounding the 2021/2022 season of the premier league. I ended up creating one showing the amount of points each team got that is indicated by the size of the circle allocated to them.

This is it:


However, I didn’t like the idea so I did more research as to what I could do for this assignment. I stumbled upon weidi youtube video on visualization  (https://www.youtube.com/watch?v=u-RiEAQsXlw&t=1536s) and decided to replicate her idea with my own data. I chose to display google trends of the football club Chelsea that occurred in the past 12 months. Through mouse pressed the user is able to switch between a circular graph to a bar graph each showing the trends.

This is the result:

The code I’m most proud of is the function to allow the graphs to switch.

//global variable
let graph = true;

// included in the draw function

if (graph) {
    CircularGraph();
  } else {
    BarGraph();
  }

  Button(buttonX, buttonY, buttonW, buttonH, "SWITCH GRAPH", 10);
}


function mousePressed() {
  if (dist(mouseX, mouseY, buttonX, buttonY) < 15) {
    graph = !graph;
  }
}


Improvements for the future:

  • I’d like to create my own group bar graph from scratch
  • I’d also like to use my own coding rather than rely on someone else (hopefully I manage this through practice)
  • Include a cool background
  • Include more data.

Aisha Response – Computer Vision

In this reading, Golan Levin talks about the computer vision (the broad class of algorithmic so that allow computers to make intelligent assertions about digital images and video) for artists and designers in particular, through a survey of the new applicants in the arts, system design consideration, and contemporary tool. In 1966, Marvin Minksy decided to try to solve “the problem of computer vision”. Many years later, we still use this discipline to confront ideas such as pattern recognition and feature recognition. Between 1969 and 1975, Myron Krueger was working on the first interactive artwork, ‘Videoplace’, which displayed the user’s silhouette on screen as well as movements. Furthermore, it allowed users to paint lines with both their fingers and body. There have (obviously) been many interactive media designs that followed from the videoplace such as the suicide box. The suicide box was placed in front of the Golden Gate Bridge (a known suicide spot) and recorded the suicides through motion-detection. This was a very controversial project as it was morally and ethically wrong for obvious reasons.


There were numerous kinds of problems that vision algorithms have been developed to address. For example, a ‘Digital video is computationally “opaque” – it doesn’t contain any intrinsic semantic or symbolic information. Thus, a computer with no additional programming is unable to answer basic questions such as whether a video stream constrains a person or objects or whether it shows daytime or nighttime. There are three elementary techniques that can solve these problems. 1) frame differencing (attempts to locate features by detecting their movements). 2) background subtraction (locates visitor pixels according to their differences from a known background scene). 3) brightness thresholding (hoped-for-differences in luminosity between foreground people and their background environment). There are algorithms to help achieve this: detecting motion, detecting prescience, detection through brightness thresholding, simple object tracking, and basic interactions. However, we should solely rely on this as it can fail. We should also focus on computer vision in the physical world. These techniques include low light conditions, the use of retroflex time marking materials, and perhaps not intervening in the environment at all. To implement machine vision techniques directly from the first principles, all that is required is that It should provide direct read access to the array of video pixels obtained by the computer frame-grabber. To conclude, quality is determined by the specific algorithms which are used to analyze it. Furthermore, people new to computer vision should focus on the physical scenarios as well as the code.

Generative Text

For this assignment, I wanted to explore more of generative text. After 3 different project ideas, I worked with a mirror image that displays motivational words in random order.

var adjectives = [
  "INDEPENDENT",
  "HUMBLE",
  "HAPPY",
  "AMBITIOUS",
  "DETERMINED",
  "DILIGENT",
  "RESILIENT",
  "CREATIVE",
  "PROGRESSIVE",
  "INNOVATIVE",
  "HARDWORKING",
  "SUCCESSFUL",
];

function preload() {
  photo = loadImage("mirror.jpg");
}

function setup() {
  createCanvas(360, 480);
  frameRate(1);
}

function draw() {
  background(220);
  image(photo, 0, 0);
  textFont("Magnolia", 18);
  fill("black");
  text("I AM", 165, 100);
  textFont("Magnolia", 14);
  fill("white");
  text(random(adjectives), 140, 340);
}

Reflection: it was relatively simple working with generative text. For future improvements, I would love to experiment generative art with text.

Midterm Project Current Progress

Concept

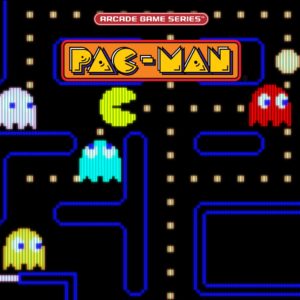
For the midterm project, we must create a game on p5.js so I tried looking up some inspirations. Then I decided to come up with a game that looks like one of my best childhood games, Pacman. This game is based on a character that looks like a yellow arc who tries to run away from monsters and eat circles, the more circles the character eats the more points he gets. However, if a monster catches Pacman you will lose the game. You can see this game below

Current Progress

I started by creating a main menu screen for the game. This main menu consists mainly of a title for the game, which I currently decided to name Circle Eater but I might change it later. Moreover it contains some instructions for the game as well as the controls to move the main character. This screen also contains a red button (START GAME) that will move the user to a different screen and will start my game.

Hence when the user presses start game button a screen with the main player and the map of the game will appear. Currently I only implemented the movement of the player but I will still have to do much more work to complete the mechanics of the game in which the player will earn points by eating the circles and will lose the game by hitting the triangles. To create the main player I used object oriented programming, where I set some of the boundary conditions that will restrict the movement of the player. Furthermore, I was able to define the movement of this arc player using move function in the class. You can find my current progress attached below.


As you can see the game still needs much more progress to be completed. Some of the main things it should include are sounds. I plan to add some sounds whenever the player eats a circle. To add to this, I will add some winning and losing conditions to the game and add a button that will allow the player to restart the game in case of winning or losing. I should also implement the enemy players using object oriented programming and try to connect everything together so that the user would enjoy playing my game. I am so excited to complete this project and see how it goes.

Midterm Documentation Part 1 – Idea

Inspiration

This midterm project involves making a game, and though I love playing games and find a lot of them to be very impressive, the idea of creating one myself is very scary. To play it safe, I knew I wanted to make something simple yet fun enough for other people  to at least play when they’re really really bored. At first, it was hard to think of games that didn’t involve various elements that I was not familiar with or would require a lot of time that I do not have right this moment. I started thinking of online games I used to play on the computer when I was little. I then remembered coolmathgames.com. It gave me flashbacks to when I would be in my computer class and we would go on coolmathgames.com whenever we would get “free time” and had nothing else to do. I started exploring the games.

I found these relatively simple games:

  • https://www.coolmathgames.com/0-curve-ball-3d?utm_content=CTA_Top_Picks#immersiveModal
  • https://www.coolmathgames.com/0-run-3

I also remembered I used to play a lot of dress-up games, but I thought it would be too complicated to use or create a lot of the objects needed to dress up a figure so I abandoned that idea. I was favoring the idea of run 3 and wanted to look at more examples. A friend actually reminded me of the Google dinosaur game that pops up whenever a user attempts to navigate the google browser  offline. I inserted it below.

In order to add my own twist to it, I decided to go with a Halloween theme since we are in October and I am going to miss celebrating Halloween at home.  Below is a more detailed thought process related to the project requirements in terms of my own dino game.

  • Can be one or more players
    • One player; Jack O’ Lantern character
  • Must include
    • At least one shape
      • Obstacles for Jack to jump over or go under (or both?)
      • Background: dark, full moon, clouds
    • At least one image
      • Jack
    • At least one sound
      • Sound whenever he jumps or crashes into something. Game over sound? Background music?
    • At least one on-screen text
      • Instructions in the beginning
      • “GAME OVER”
    • Object Oriented Programming
  • The game must start with a screen giving instructions, and must wait there until a button or key (your choice) is pressed
    • “Jack is trying to escape pumpkin carving season. Press space to start running! Don’t get caught or else RIP Jack :(“
  • After the game is won or lost, there must be a way to restart the game without closing and restarting the program
    • button? automatic restart to the instruction page?

Future Improvements

I have not started my code yet, but that is for part II, which will then lead to the final part. I look forward to creating my own version of this game and learning along the way.

Assignment 4: Data Visualization

Concept

For this assignment, I chose to try and do either a line or bar graph based on a set of data. I retrieved a data set from datahub.io, it was a data set showing the mean global temperate yearly from 1880 to 2016. I referenced the class example, The Coding Train, and various other YouTube videos to help me.

Code Highlight

let dataMin, dataMax = 0;

function minMax() {
  for (let i = 0; i < numRows; i++) {
    if (table.getNum(i, 1) > dataMax) {
      dataMax = table.getNum(i, 1);
    }
  }
  dataMin = dataMax;
  for (let i = 0; i < numRows; i++) {
    if (table.getNum(i, 1) < dataMin) {
      dataMin = table.getNum(i, 1);
    }
  }

  print("max value " + dataMax + "min value " + dataMin); // checks if finding the min and max value works
  
}

This part of my code finds the maximum and minimum average global temperature. To make sure it worked, I printed the max and min value.

Image

No image 🙁

// IIM Michael Shiloh
// October 4, 2022 Assignment 4 Data Visualization
// Abigail Mata-Hernandez

// Description: This code attempts to create a data visualization about annual global temperature means in celcius from 1880 to the present. My goal is to create either a line or bar graph showing the how the global temperature changes over time.

// I chose this data set randomly from https://datahub.io/core/global-temp

// Inspiration: Class, The Coding Train,

let table;
let numRows, numCols;
let date = [];
mean = [];
let diagramX, diagramY; // x and y coordinates

function preload() {
  table = loadTable("annual_csv.csv", "csv", "header");
}

function setup() {
  createCanvas(400, 400);
  background(220);

// print(table); // check if loads table

  numRows = table.getRowCount();
  numCols = table.getColumnCount();

//print("rows:" + numRows + "cols;"+ numCols) check number of rows and columns

// load data

  for (let r = 0; r < table.getRowCount(); r++) {
    date[r] = table.getString(r, 0);
    mean[r] = table.getNum(r, 1);

// print(date[r] + " " + mean[r]) check if I get the date and mean, the date  points needed on the graph
    
  }

  // const name = table.getString(r, "Source");
  // const year = table.getNum(r, "Year");
  // const x = random(0, width);
  // const y = random(0, height);
  // text(name, x, y);
  // console.log(name);
  // the above code was a different attempt at drawing the graph using a different way but I did not understand it and stopped
  
  minMax(); //minMax function found below
}

function draw() {
  background(240);
  
  diagramX = width/2;
  diagramY = height/2;
  
 // When I tried to actually use the points to visualize the data is when I got stuck. I tried to follow videos such as https://www.youtube.com/watch?v=hokTcLVtZs8 but it was very different than what I was doing
  
}


let dataMin, dataMax = 0;

function minMax() {
  for (let i = 0; i < numRows; i++) {
    if (table.getNum(i, 1) > dataMax) {
      dataMax = table.getNum(i, 1);
    }
  }
  dataMin = dataMax;
  for (let i = 0; i < numRows; i++) {
    if (table.getNum(i, 1) < dataMin) {
      dataMin = table.getNum(i, 1);
    }
  }

  print("max value " + dataMax + "min value " + dataMin); // checks if finding the min and max value works
  
}

It wasn’t until I got to the actual data visualization part where I had trouble. The code before attempting to draw the line or bar chart had already taken me quite some time, more than I would have liked. I thought however that because I already loaded and figured out how to get some values, it would be easier to get the rest of the values I needed and plot them on a line graph. I know there is a solution which is why I kept trying, but I kept failing.

Reflection

I don’t think looking at just examples or videos is helping me. I tend to try and do almost the exact same thing as the examples, but the code that I had made on my own from what I understand is obviously too different to fit into what the examples do. I plan on taking more time to practice coding outside of the assignments assigned.