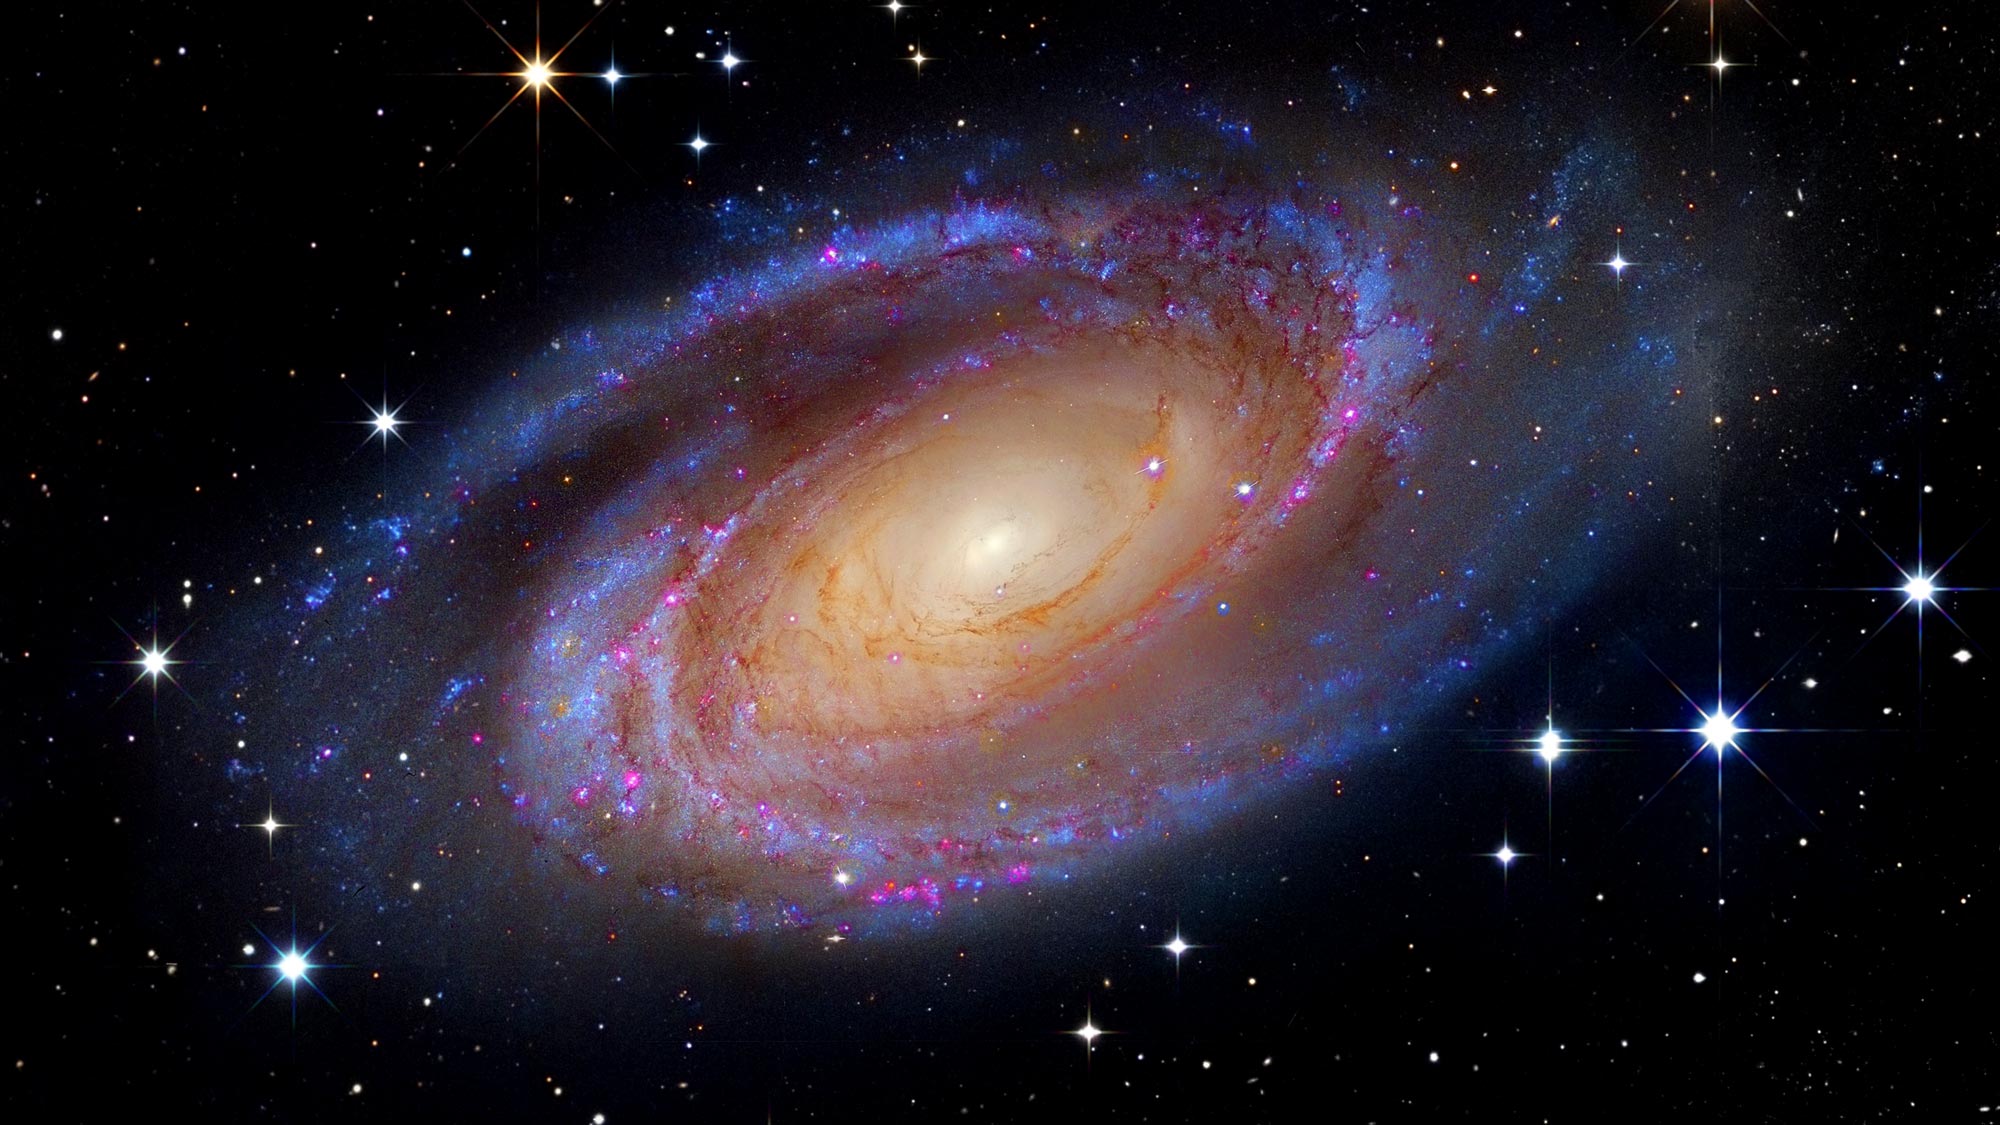
My idea was to create a spiraling pattern of mini-circles that change color when the user moves the mouse. This idea was motivated by the milky way galaxy that appears in a spiral form.
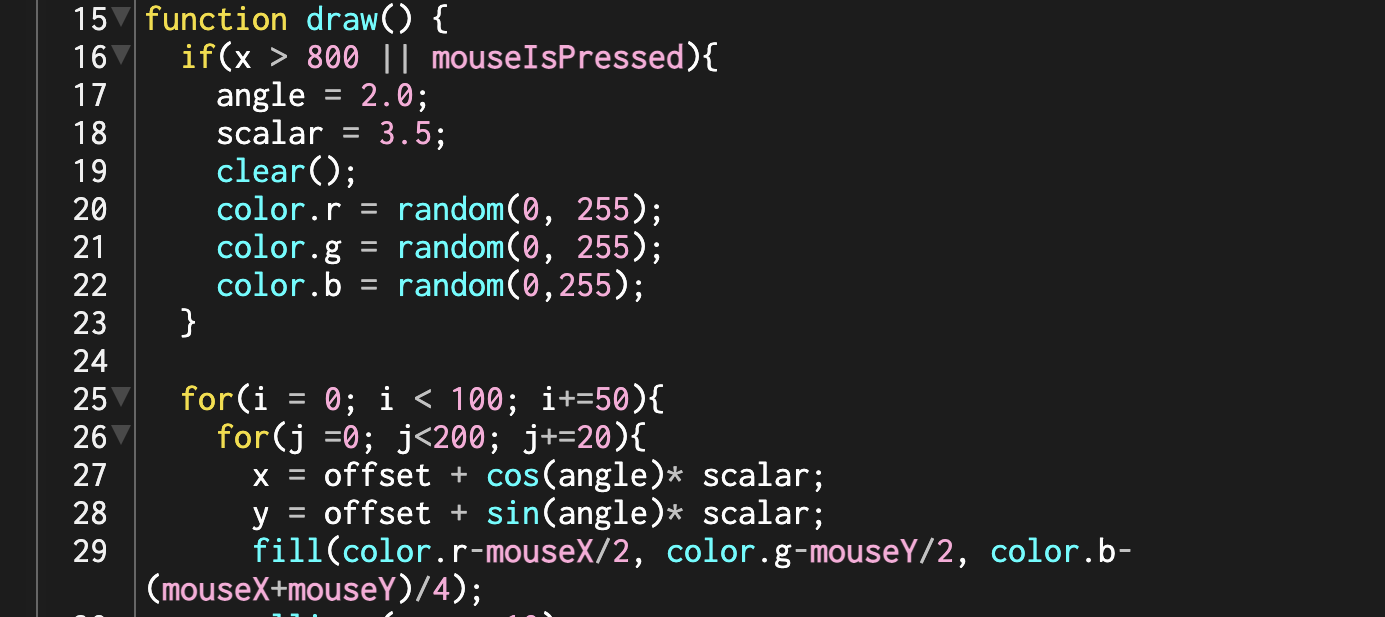
After thinking through several ways to color the patterns, I ended up changing the colors by random and at the same time with the movement of the mouse pointer. The code for the coloring is shown below:
The embedded sketch of the assignment:
Reflections:
It’s interesting how the frame rate changes the perception of the art. I will explore the different frame rates and how they affect my perception of the design. Also by changing the angle of the circles and the speed at which they change, the design changes in many different ways. I will most likely explore the different designs by changing the angle and speed.
I was inspired by Case Reas’ talk and his showing of Jared Tarbell’s Invader Fractal. The concept that the contrast in a group of squares could trick the brain into perceiving different shapes was intriguing to me. I wondered if increasing the complexity of artwork such as Fractal invaders could trick our perception into making more complicated constructions out of random arrangements. What if I changed the colors used? Or the frame rate? I tried to answer these questions through the assignment.
Implementation
//Fucntion to draw a quadrat of fractals
function drawfractals_1(c1, c2){
  //Nested for loops used to create rectangles for each row
  for (let j=0; j<4; j++){
    for (let i=0; i<4; i++){
      //array to select integers from
      let bin_array = [0,1];
      //selects randomly from 0 or 1
      let r_num= random(bin_array);
      //fills with black if random number returned is 0
      if (r_num == 0){
        fill(c1);
        rect(i+(50*i), j+(50*j), sq_width, sq_height);
      }
      //fills with white if random number returned is 1
      else {
        fill(c2);
        rect(i+(50*i), j+(50*j), sq_width, sq_height);
      }
    }
  }
}
This part of the code is the function that generates one section of the random squares. It creates a random pattern by choosing whether the color will be dark or light through an binary array passed through the random() function.
Embedded sketch
Here the fractals or images are created by splitting the sketch into 4 quadrants which generate on their own a random pattern. Every iteration also has a random chance of possessing a different complimentary color combination.
I also thought that making the sketch go blank when clicked on would help someone refocus and find shapes in the patterns formed.
Reflection and ideas for future work or improvements
After staring at the patterns generated for hours, I have realized that it is probably the greater simplicity in the original fractal invaders artwork, which mirrors the pattern generated on half of the sketch to the other half, that creates some sort of meaning in our minds. I am slightly disappointed by the bulkiness and inefficiency of the code as it has multiple functions carrying out the the same process, on the same type of object. Here I can overcome the issue by using a class for the square. This would have allowed me to manipulate the randomness and animation of the squares and overall artwork much easier.
Since the assignment needed us to use loop – I thought of creating a simple pattern so that I can update the x and y variables with each iteration. I created two if conditions under the loop using random(1) function. If the random() function picks a number more than 0.5, the code creates a line from the top left to bottom right. Else – it creates a line from bottom left to top right.
let x = 0;
let y = 0;
function drawLines(){
  stroke(255);
  delta=10;
  stroke(random(255),random(255),random(255));
  strokeWeight(5);
  if(random(1)>0.5){
   line(x,y,x+10,y+delta);
  }
  else{
   line(x,y+delta,x+delta,y);
  }
  x = x+delta;

  if(x>width){
    x=0;
    y=y+delta;
  }


  if(y>height/2){
    delta = 0;
  }
}
Since there is simple probability at play here – it created a maze-like pattern. I simply added colour to it. Furthermore, I wrote another function which uses the same algorithm, but from bottom right corner and it works its way up – to add a little more life to it.
Reflections
This was relatively simple yet fun to make. I would, however, have liked to add some element of interactivity. Possibly something that affects colours and speed based on the movement of mouse. I tried incorporating other visuals after this pattern finishes – but faced some issues. I would definitely love to incorporate that in this sketch.
The sleep TV mode inspired this assignment. When I was a kid, my friends and I used to watch the TV when it was not even turned on but on sleeping mode, closely observing that rectangular white box on the TV hitting all edges of the black TV box till it perfectly hit the corners of the black TV screen. While I was brainstorming ideas for the art piece, I figured that this is what I want to do. However, later I figured that I should add more properties to that animation.
Code highlights:
I would say I spent most of time debugging this part of the code
What this code basically does is that it has a function that takes in a rectangle parameter and manipulates a rectangle to move around a certain border.
The first if condition continuously checks if the borders of the designated rectangle do not bypass the edge of the border and the function makes sure that what is being called is the “if” not the “else” by not changing the status of the rectangle. However, when the rectangle bypasses the border’s edge it goes to the “else” part. In the else part it changes the status into false and that makes the function when called not go to the “if” part, as there is a condition that checks if the status is true. Moreover, to not make the function not stuck in the “else” part, I made an if condition that checks if the rectangle hit the other border and when it does, it changes the status to true.
The second part of the function is basically the same thing, but instead of manipulating the x-coordinates, I manipulated the y-coordinates.
The draw function is basically making rectangles and changing their colors.
let a = random(255);
let b = random(255);
let c = random(255);

let aa = 255 - a;
let bb = 255 - b;
let cc = 255 - c;


fill(a,b,c);
I made the inverse of the color to each other by assigning a random color to some variables and then assigned the inverse colors to other variables then call the variables and their inverse in an order of that each square has a square with an inverse color in it.
Sketch & reflections:
I think what this art piece made me realize is that coding is not about the actual act of coding but about debugging as I spent more than 70% of the time making this piece checking what is wrong with the code rather than writing the actual code. Moreover, when I saw a previous classmate’s art pieces I thought it would be easy to make. However, when I made my piece it made me realize that they are much harder to make than seems, which made me respect their work even more.
This work of art was inspired by maximschoemaker based on the golden spiral. The Golden Spiral is a derived from a special ratio called the Golden Ratio. It is very common even within nature as can be seen in the arrangement of sunflower seeds. Now while my vision was more inclined to produce a work like the one in the picture below, I found myself exploring and learning cool stuff up to the point I reached my final piece.
Code Highlight
The most challenging and interesting part of the process was the logic required to draw the circles in a spiral form. It took quite some time to figure out the mechanics behind the movement, but upon figuring it out I came to realize I could do a lot of cool stuff with the logic developed.
for (let i = 0; i < 10; i++){
   let x = cos(angle) * scalar;
   let y = sin (angle) * scalar;
   let dist = 200 * i/2;
   ellipse(x + dist , y + dist, 3, 3);
   scalar += 0.04;
   angle += i;
Reflection / Future improvements
This assignment pushed me to learn new concepts, apply them, and realize that there is still much room for growth in general. Some of the things I would have liked to better in this work is having animations, more user-interactivity, and more efficiency by having less hard-coding. Overall it was a fun experience.
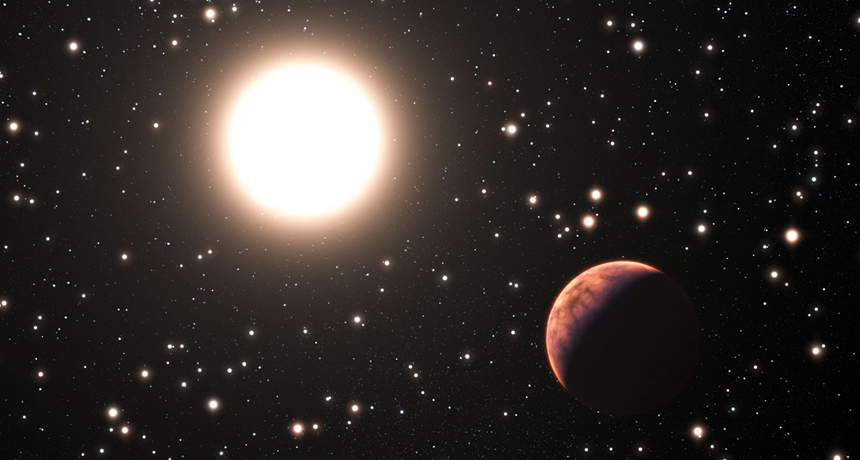
The idea for this assignment originally was to make flashing lights in a dark background, however I couldn’t figure out how to make it work as intended. Because of that I decided to change the idea based on the sun and space, similar to this:
Based on that I decided to make a big orange ball that would flash with small motionless circles to look like stars.
Code
Creating the code was the most difficult part of making the image. In my attempt to make the first concept, I stumbled into a video of making circles (https://www.youtube.com/watch?v=XATr_jdh-44) and to() functions.
for(i=0; i<20; i++){
   let x = random(width);
   let y= random(height);
   let r = random(1,5)
   fill(255,255,255) // had to fill it white because they took the color of the sun//
   ellipse(x,y,r,r)
}
After this I used a code similar to the one seen in class of making the triangle loose color and make it bright again. At the end my code looked like this:
function setup() {
  createCanvas(400, 400);
}
let greenValue = 255;
function draw() {
    background(0)
  for(i=0; i<20; i++){
   let x = random(width);
   let y= random(height);
   let r = random(1,5)
   fill(255,255,255)
   ellipse(x,y,r,r)

  }
  greenValue = greenValue - 5;
    if (greenValue === 105) {
    greenValue = 255;
    }
  fill(greenValue, greenValue - 111, greenValue - 200);
  ellipse(200,200, 300,300);

}
Completed Art-Work
Reflection/Future Work
Personally, I wish the code did not take as much time as it did, as well as reduce the amount of mistakes made, as my computer crashed a few times while writing the code.
Alongside that, I would have liked the color to dim down and slowly dim up repeatedly, but could not find a way to do it.
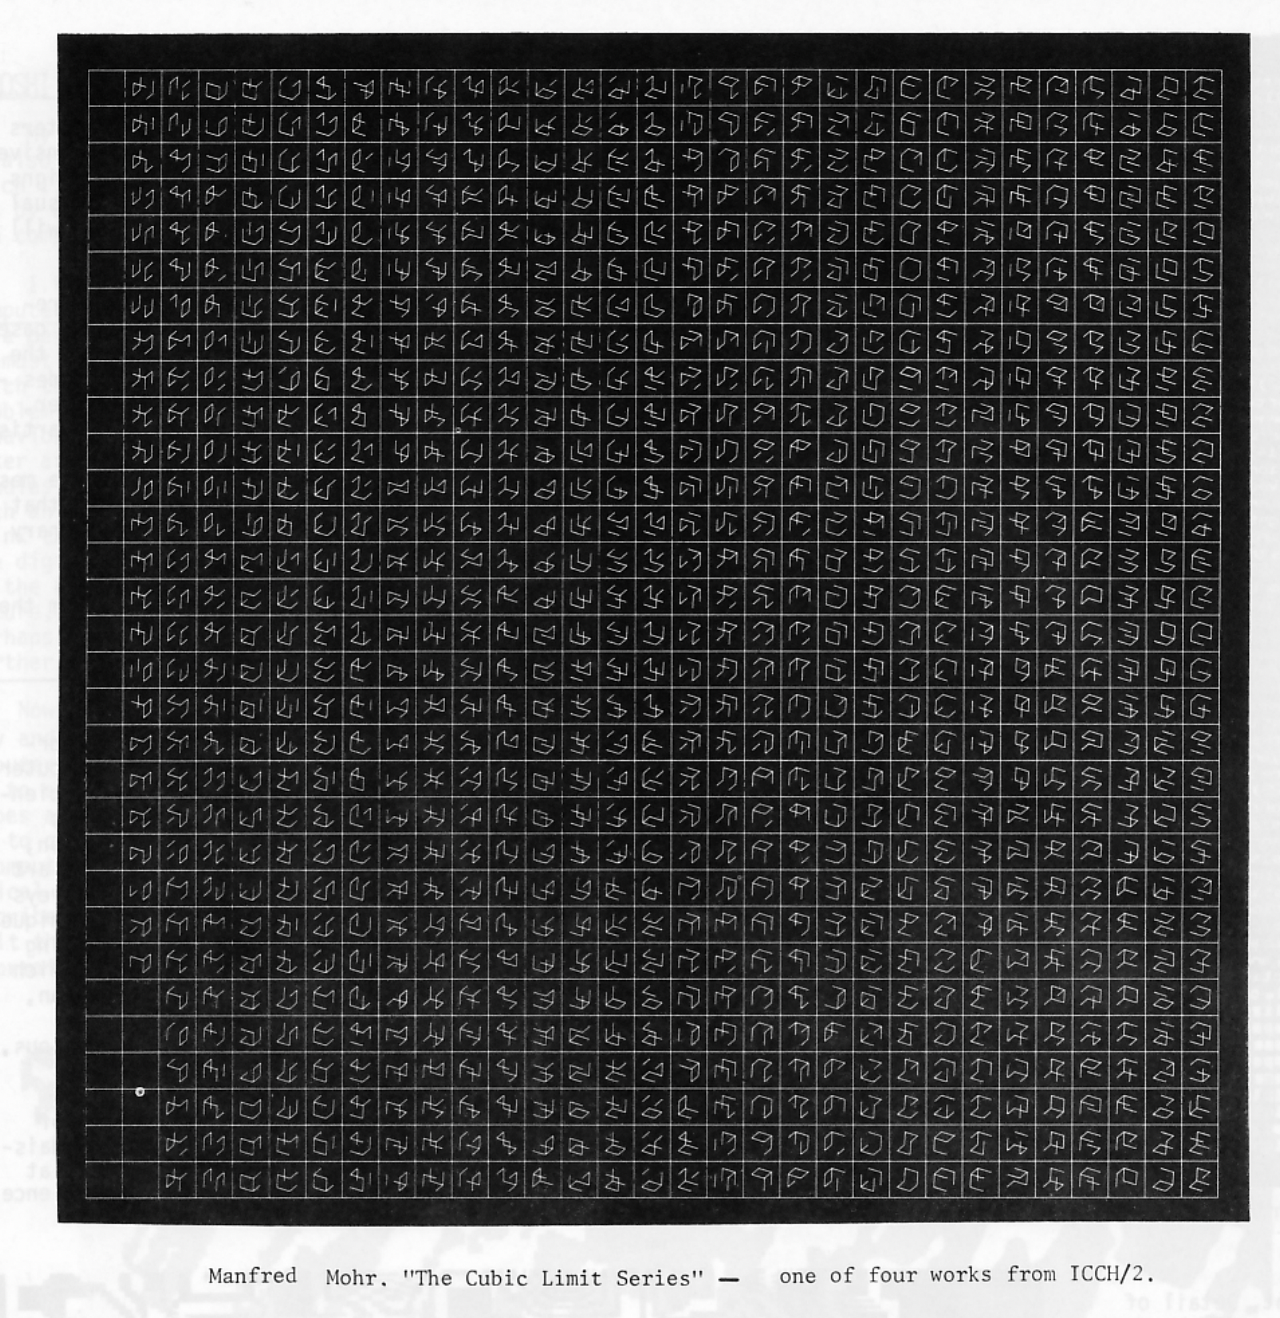
This assignment was inspired by the piece from ‘The Cubic Limit Series’ by Manfred Mohr. Coded in FORTRAN IV, the short film depicts a ‘catastrophe point’ when a rotating cube is dissolved into a set of abstract lines. Thus, I was awestruck by the idea of re-creating art that builds on abstract design but focuses on objects related to me.
Just like Mr. Mohr found his Eureka moment in the form of a ‘cube’, I found mine to be ‘Pac-Man’ — a popular video game as well as the character of the game. Here, I focused on creating a range of shapes – including but not limited to circles, ellipses, arcs, rectangles, spirals and so on. For this, I divided the entire project into five parts:
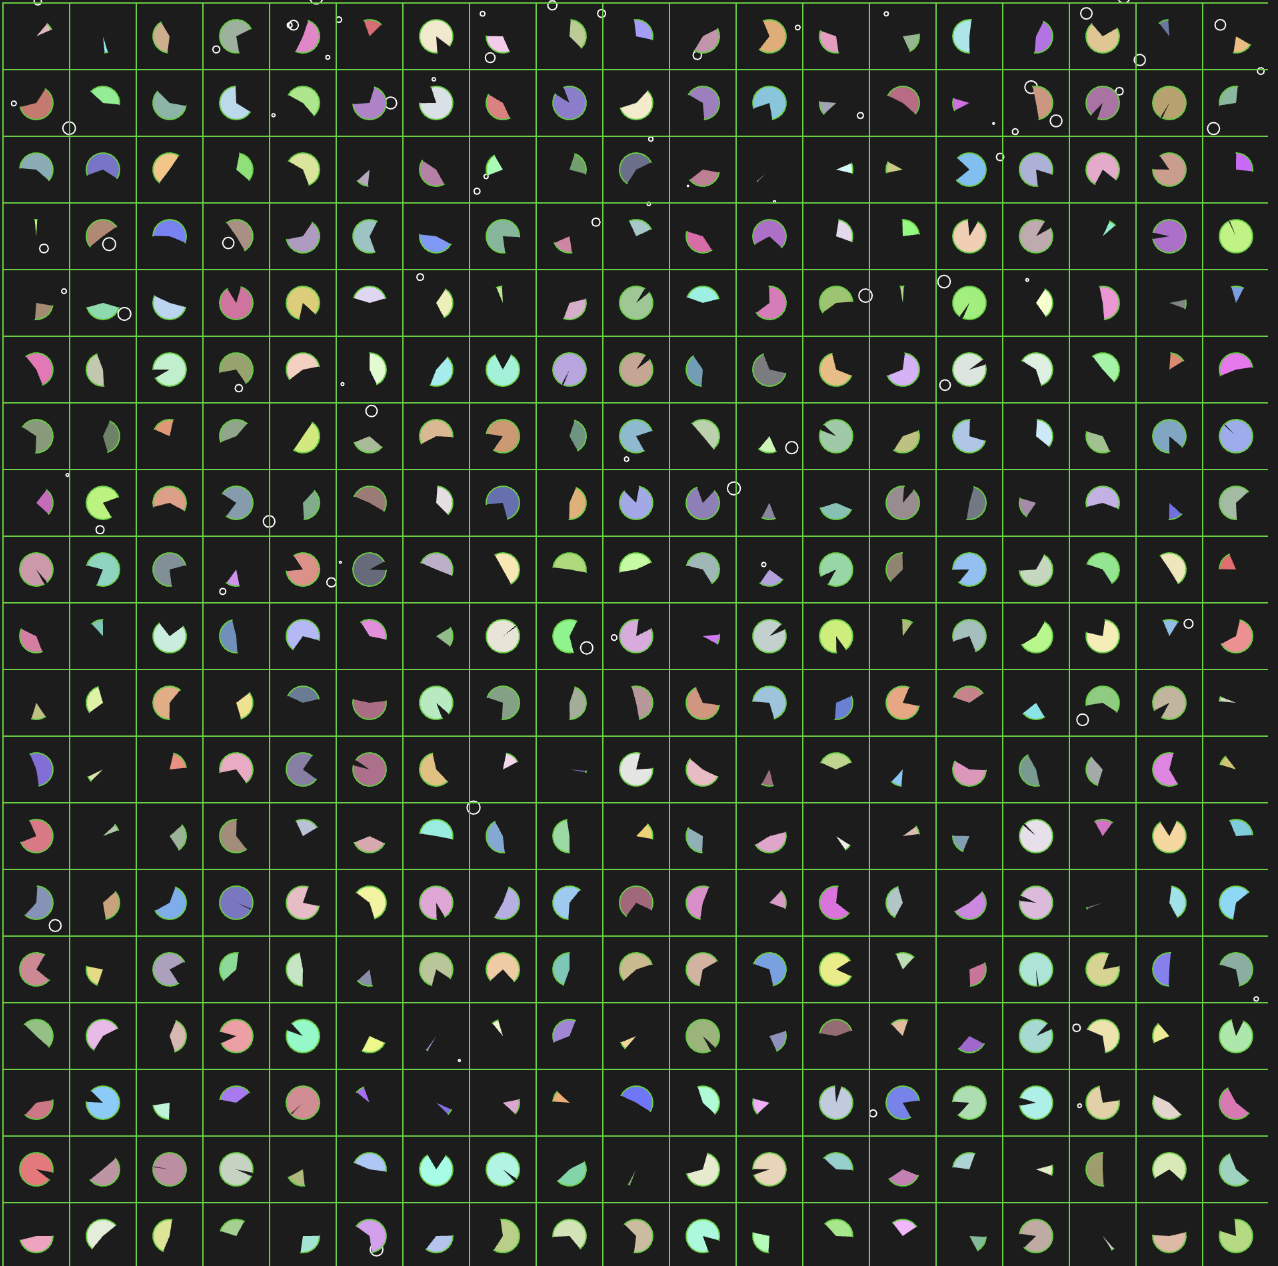
Part 1: Grid Lines [function draw_grid()]
The first and foremost step was to create a grid. To do this, my initial plan was to use two nested loops and use a combination of the line() function, but it was non-uniform, more tedious and its dimensions were not adjustable dynamically. Instead, I opted for the rect() function to draw a single cell.
Thus, the canvas size of 1000 pixels by 1000 pixels was divided into tiny square-shaped cells of 50 pixels (in length) each. Using two for loops (in the nested form), the aforementioned square cells were drawn on the canvas. As a final touch, random red, green and blue (RGB) values were picked for the stroke color. Since the draw() function is called recursively on p5.js, the stroke color changes after each frame.
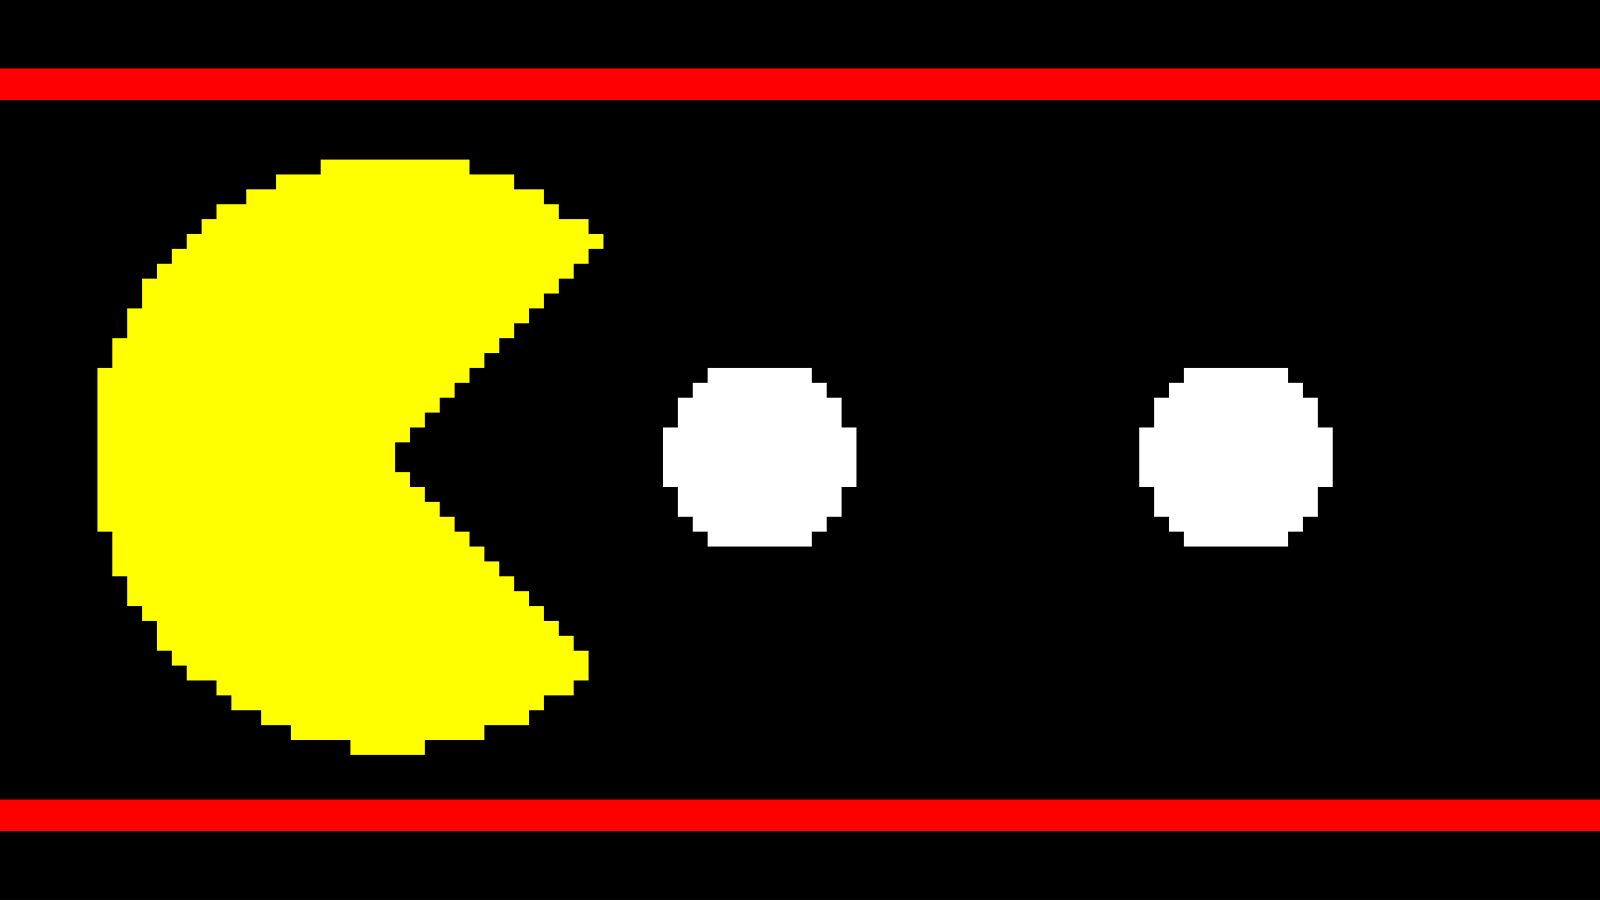
Part 2: Pac-Man [function fill_pacman(arguments)]
Pac-Man Theme – Courtesy of Pixabay [British Libary]Now, the task was to create the shape of Pac-Man, which was relatively easy as it is basically a “circular sector”. However, making it dynamic (for analogy, compare it to the rotating cube from Mohr’s experiment) was time-consuming as the shape had to remain recognizable at all times. After a few rounds of experimentation, a changing, yet identifiable, Pac-Man was created using the ‘arc’ function of p5.js. The initial and the final angles of each arc were randomized that could range between 0 and 360, and with a re-adjusted frame rate, a non-static Pac-Man shape was drawn. Each Pac-Man was filled with random RGB values — for all R, G and B values, the random() function was employed that took a total of two parameters. Finally, all the Pacman’s are placed into their respective grid positions using nested “for” loops.
The entire code was wrapped in the fill_pacman() function with its dependency on six arguments – which were the initial and the final value for random() function used to determine the R, G and B values. This function is called in two places — one in the draw function and the other in the draw_circles() function (which will be discussed later).
Part 3: Snowfall like effect [function draw_background() and class fallingFlake()]
I used to play the original Pac-Man game all the time, but during the winter break, it used to be intense. Thus, I wanted to add the snowfall effect to the background of the project. Also, the functionality is handled by the draw_background() function, which depends on the class ‘fallingFlake’. Based on my previous experience, the project becomes more manageable with the help of Object Oriented Programming, thus the use of a class.
The class consists of four arguments taken as input while object instantiation (or creation): x and y coordinates of each snowball, its radius and speed (gravity) and three methods: constructor, update() and display(). The update() method simply updates the y-coordinate of each snowball, while the display() method displays each snow pellet in the form of a circle.
Similarly, the draw_background() function creates and stores a list of randomly instantiated 100 (adjustable) snow pellets using a single “for” loop — in doing so, the x-position and the radius of each snowball are assigned randomly while the gravity is set to be 5. The count of snow pellets keeps on adding after each frame. Then, using another “for” loop, the program iterates through the list of snow pellets to display and update them consecutively.
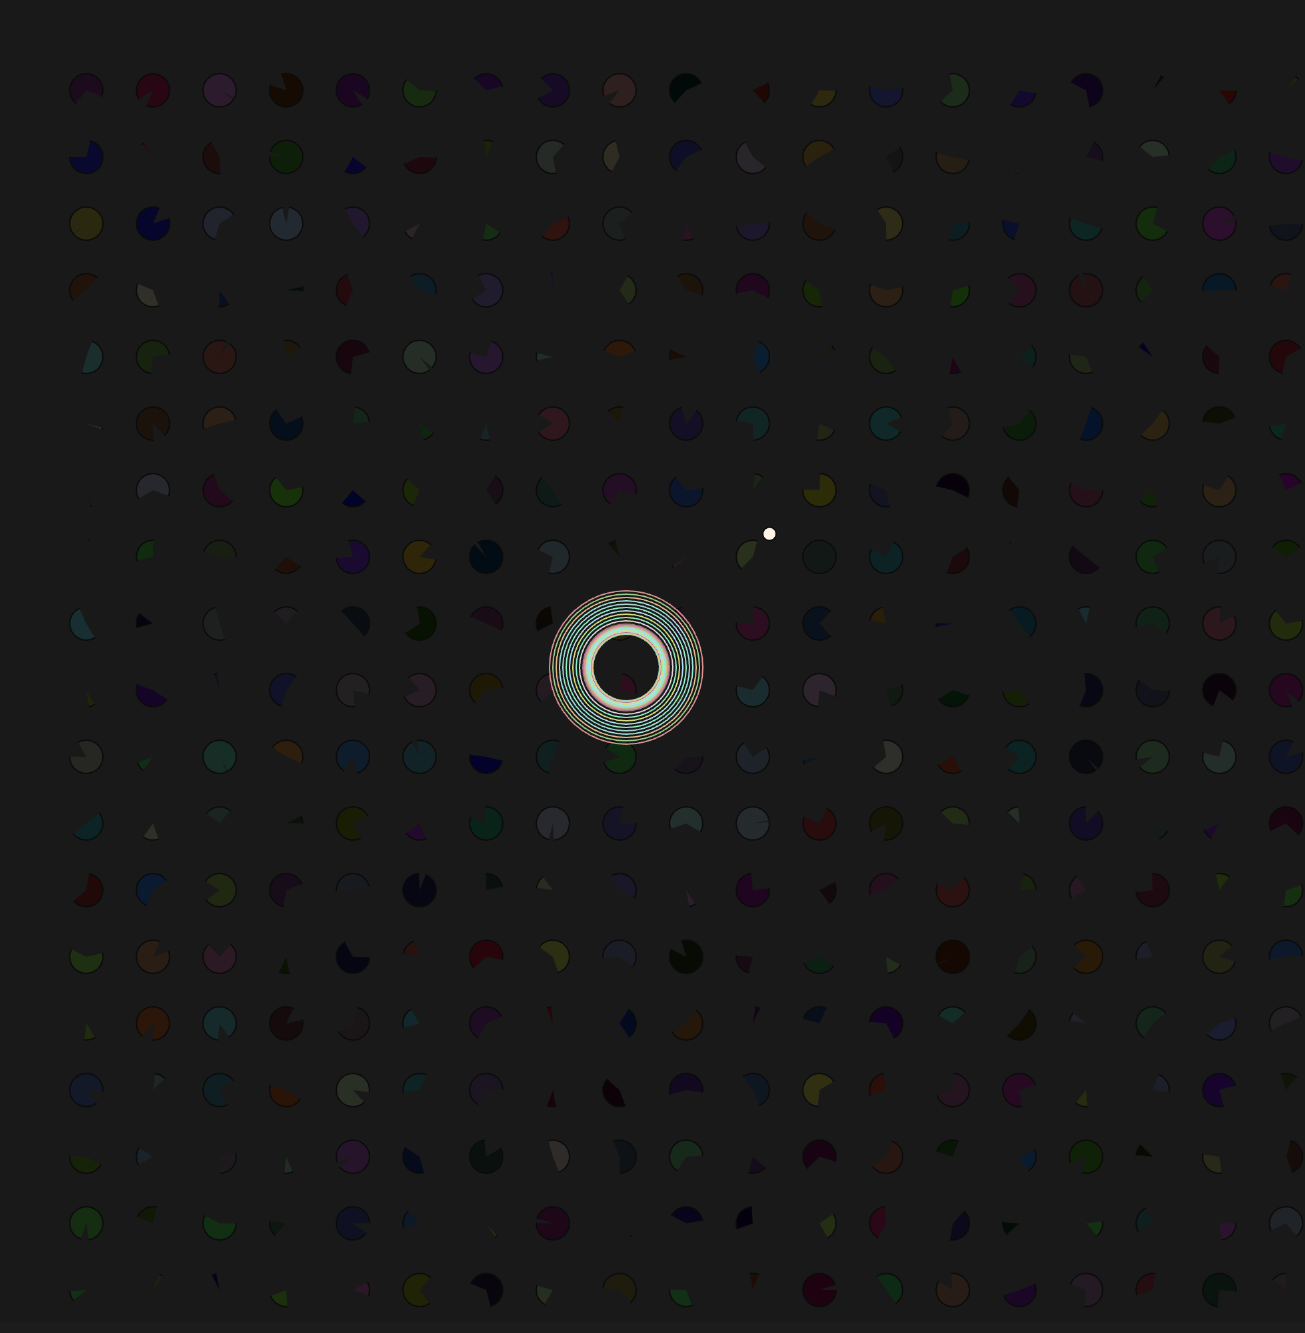
Part 4: Draw concentric circles [function draw_circles(argument)]
One of the ways to integrate user interaction in the project was by using mouse-click-functionality. Thus, when the mouse is not pressed, grid and Pac-Man are displayed, but as long as the mouse is pressed, a change of screen is visible (which is handled by Parts 4 and 5).
Here, two sets of concentric circles (centered at the cursor’s position and increasing in radii) are created, and these circles change color as the frame is refreshed. The function takes frameRate from the draw() function as an argument, which in return determines the number of iterations of the “for” loop used to draw the circles. In addition, function fill_pacman() is called here, but with parameters such that the RGB value of the screen is different than that of the screen when the mouse is not clicked.
Screen when the mouse is not pressedScreen when the mouse is pressed
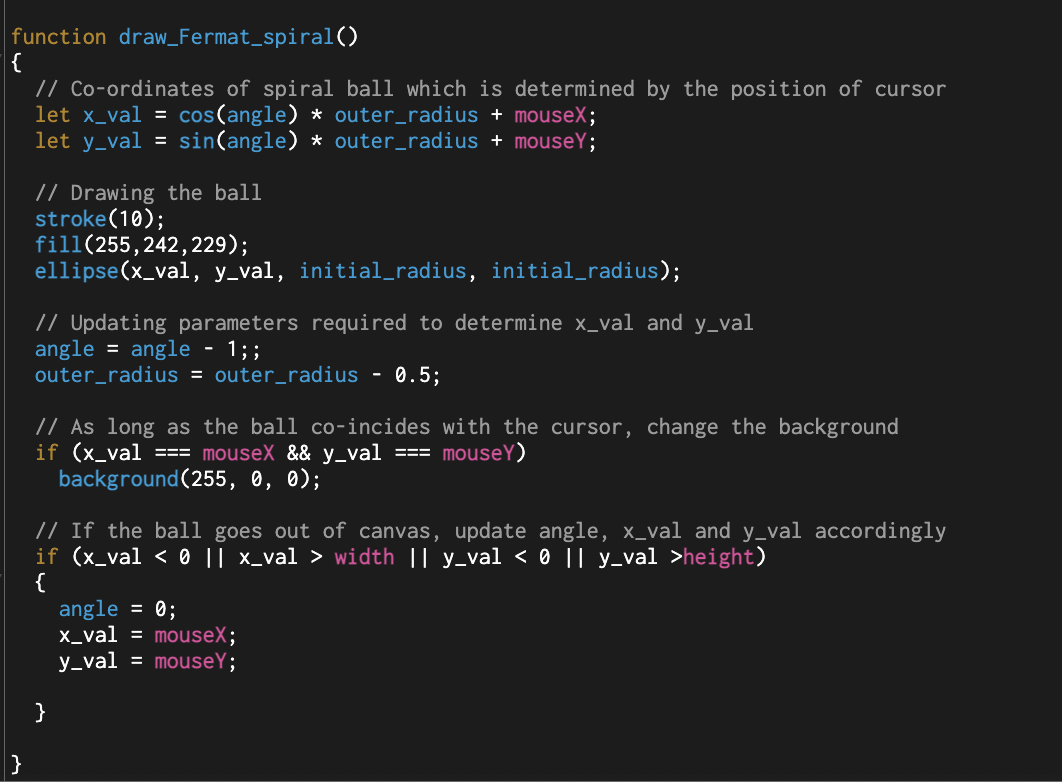
Part 5: Drawing a Fermat’s spiral [function draw_Fermat_spiral()]
The final part and the highlight of the project is creating a spiral. The basic idea was to create a Fermat’s spiral that traces its path as it moves along.
But, to make the overall functionality more interesting as well as to preserve other background components of the project, the code has been modified so that just the leading point of the spiral is visible. The function itself is a short one, but it’s a highlight because of all the Mathematical brainstorming that went behind it.
Determining the x and y coordinates of the leading point of the spiral and updating it while displaying the trace was a major task. After repeated trials, this was done with the help of two Mathematical values (angle of curvature and the main radius of curvature), while the inner_radius sets the radius of the leading circle. Initially, I was using lines to trace the path, but the use of an ellipse combined with two trigonometric ratios simplified the overall spiral creation.
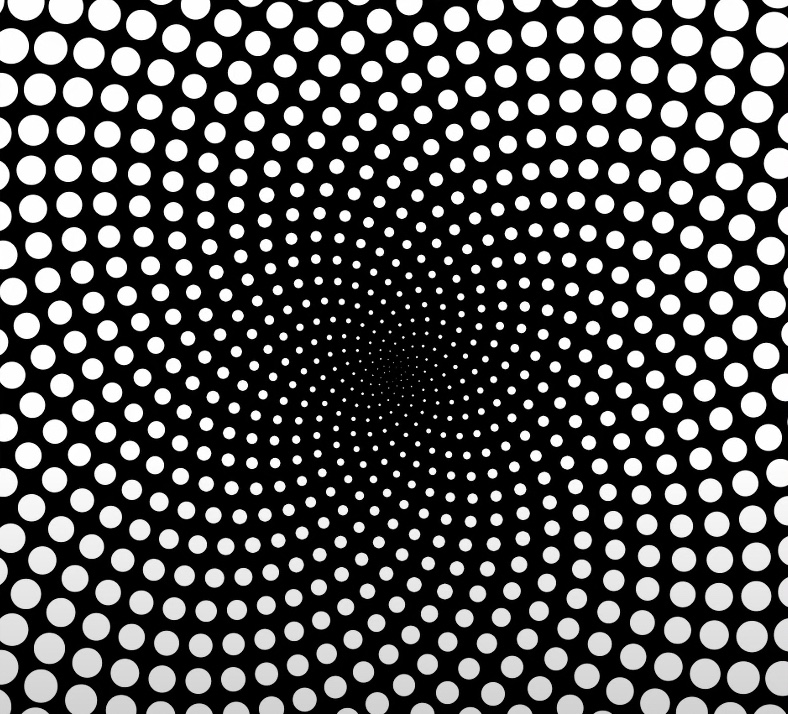
The video shows the pattern the code shown above generates on a plain background:
As mentioned earlier, for this project, the function has been modified so that the user can keep on clicking on the screen, and the spiral will build around the cursor; however, just the head of the spiral is visible to the user, which keeps revolving around the cursor.
Reflection
In short, I am pleased with the final piece. As I spent more time brainstorming than coding, I was dubious about the project, but in retrospect, it proved to be interesting, entertaining as well as rewarding.
There are a few things that I will work on in the future:
When the mouse is clicked, I originally intended to create a visual music effect. It has been partially done in terms of graphics. Now, adding sound files and maybe synchronizing the expansion of concentric circles with musical beats will be my next target.
The code is somewhat streamlined in terms of modularity. Nonetheless, it is laggy as the list that stores all the snowball objects keeps on growing in size. Thus, it can be cleared at the end of the program in future versions.
Incorporating more user interactions into the project.
With these improvements, the code will be more responsive. Plus, the addition of a range of effects as deemed necessary will further enhance the project.
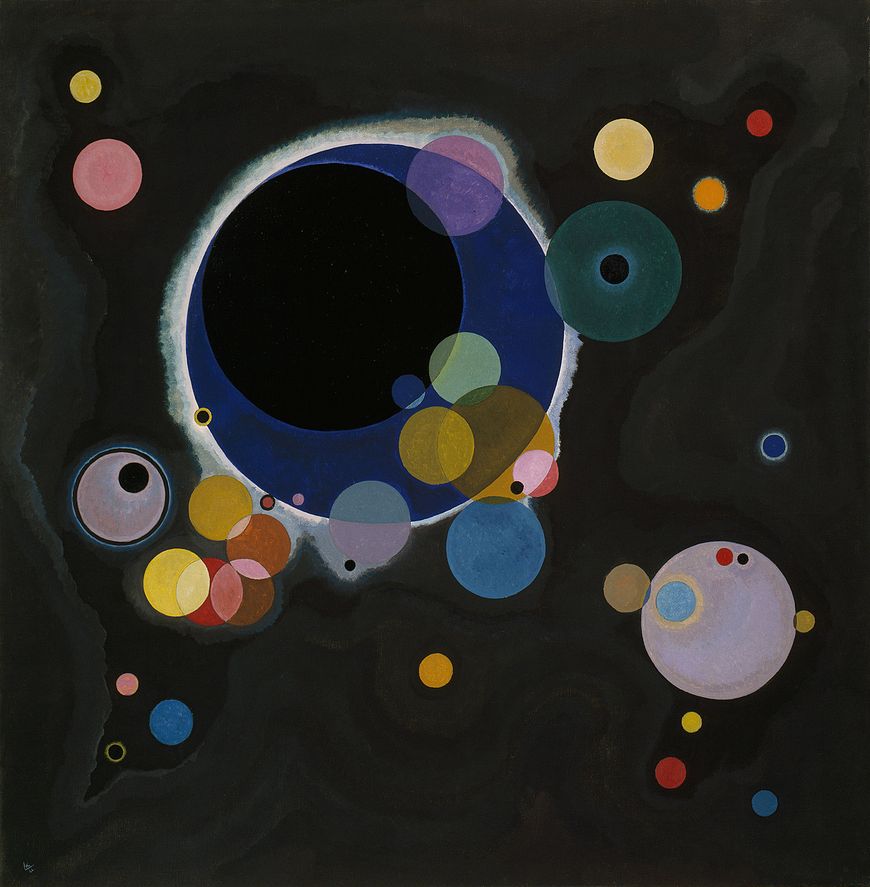
Projecting Kandinsky’s (1866-1944) idea of “Everything starts from a dot,” based on his famous Several Circles (1926) abstract painting, was my main inspiration behind this assignment.
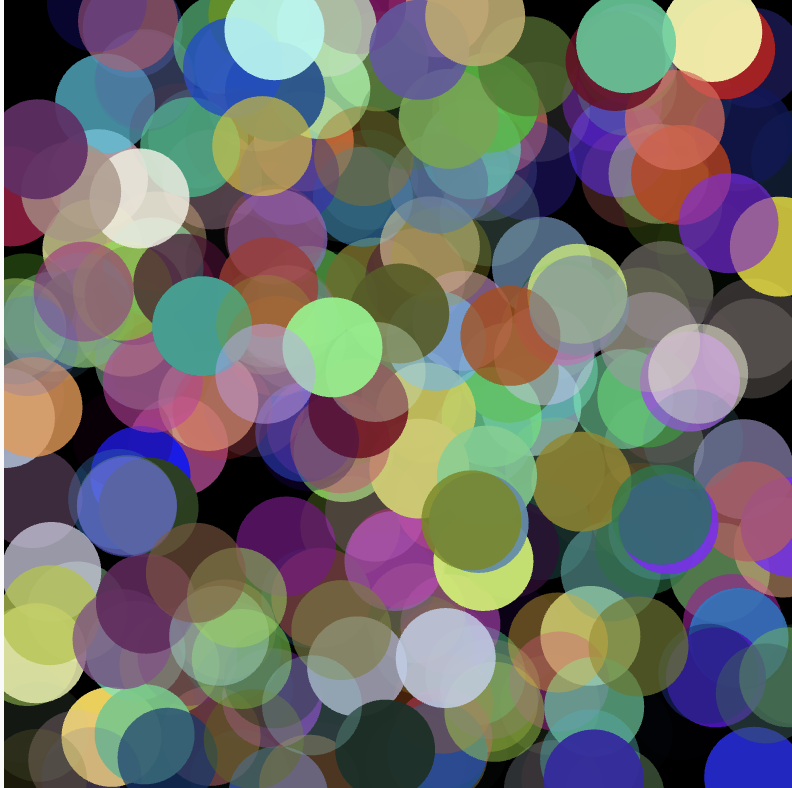
I started with the while loop to create an arrangement of pixels array but the system refused to run smoothly and kept on crashing and deleting my program. This pushed me into another direction wherein I restarted with the most basic designation of variables. The code that I ran drew circles on the screen, placed them randomly, and filled them with random colours.
Sketch 1- Random placement of circles
While the code ran smoothly, it kept on filling the screen with random circles till it became nothing but a resemblance of a big patchy ink blot. A certain level of symmetry became crucial at this point to prevent multiple circles from just randomly overlapping each-other to fill the screen.
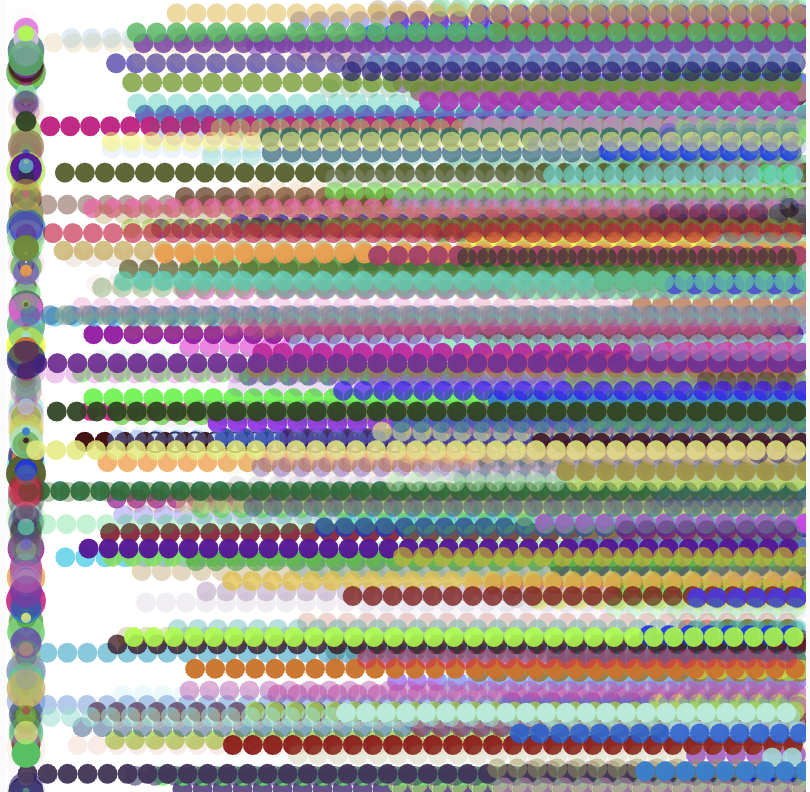
At this point I introduced the For loop in my code. The pre-assigned variables started creating a grid- like structure. Since the random overlapping sequence kept on running within the code while the grid was running through the program, a very confused composition of circles developed on the canvas.
Sketch 2- Introduction of grids
In the code, I adjusted the x and y variables within the for loops so that the grid like structure could become uniform. It was a prolonged trial and error method but lastly the circles got adjusted within the height and the width of the canvas accurately.
Sketch 3- Uniform Grid
Later, I also added another loop to introduce rectangles and overlapped them over the circles to make the grid a bit more interactive and playful in terms of shapes and colours. The stroke as well as the random colours of the rectangles had to be adjusted so that the rectangles did not completely overshadow the circles. The final pattern came out as a surprise.
I also found the customisation of our own functions quite interesting. Not only did they allow me to organise my code into smaller chunks but also acted as uniform steps of a complicated task.
Here is the final playful product of the program,
In the future assignments I hope to include more interactivity with the usage of mouse, such as the movement of shapes across the screen. I also hope that I can include i.e place the graphic design within a certain boundary of a bigger shape or image that is on the screen. I also saw certain theorems that were projected through circles drawn on the screen in The Coding Train videos (9.8) and hope to initiate them through loops and functions as well. And last but not the least, I want to practice the functioning of loops more to create and manage designs that do not crash upon running.
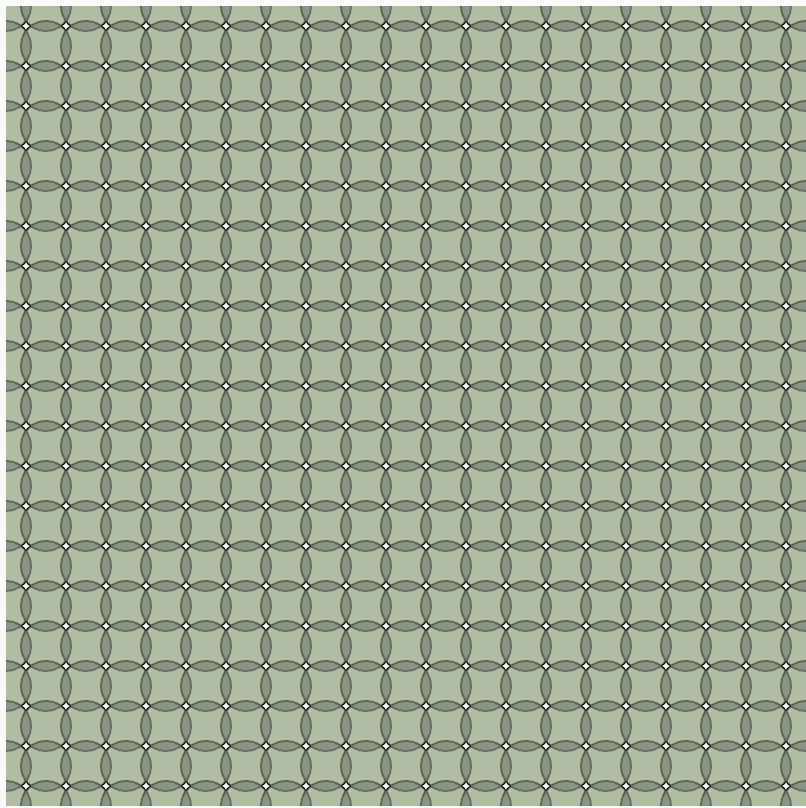
I really love the randomizing feature on p5js, just because it means I don’t have to tediously designate a color for each shape when I make a creative piece and I enjoy the unpredictable aspect of it. I decided to create a repetitive grid-like piece with randomized colors that change every frame; no frame is similar to the last because the colors are randomly generated every time. I called my piece Aquatic Disco Ball because of the repetitive square shapes that are only colored with hues generated from the blue and green values, with the red value being on 0 the entire time.
Code highlight
Big shoutout to The Coding Train on YouTube. If you’re seeing this, I wouldn’t have been able to code loops without your tutorials :’)
// restrictions of the bigger squares -- loops
// horizontal: X1
for (var X1 = 8; X1 <= width; X1 += 32){ // variable X1 starts at point 8 (out of 400) on the x-axis; it cannot get exceed the width of the canvas; it adds 32 to the space between each square
// vertical: Y1
for (var Y1 = 8; Y1 <= height; Y1 += 32){ // variable Y1 starts at point 8 (out of 400) on the y-axis; it cannot get exceed the height of the canvas; it adds 32 to the space between each square

// restrictions of the smaller squares
// horizontal: X2
for (var X2 = 8; X2 <= width; X2 += 32){ // variable X1 starts at point 8 (out of 400) on the x-axis; it cannot get exceed the width of the canvas; it adds 32 to the space between each square
// vertical: Y2
for (var Y2 = 8; Y2 <= height; Y2 += 32){ // variable Y1 starts at point 8 (out of 400) on the y-axis; it cannot get exceed the height of the canvas; it adds 32 to the space between each square
Embedded Sketch
Reflection and ideas for future work or improvements
When I was designing my pattern, the overlaying smaller squares made my browser lag trying to process all the newly added information. This is because I had to input more ‘for’ and ‘var’ codes for the smaller squares to achieve this design— but that meant it would take up more of my browser’s energy even if it was a relatively simple code and there weren’t too many lines overall.
I also struggled with trying to figure out how to use ‘for’ loops and ‘var’ but The Coding Train videos helped me out. Don’t be fooled though, I’m still not fully competent…
I feel that in order for me to improve, I need to familiarize myself with the ‘for’ and ‘var’ features more, just because I’m still not confident in my ability to execute my intended design using loops in my code.
I also feel that I need to branch out and try generating different shapes other than squares, circles, and triangles, but that of course requires more practice.
For this assignment, I was inspired by the patterns I saw in Casey Reas’ Eyeo talk and some of the repeating patterns in the Computer Graphics and Art magazines. I thought that it would be really cool to generate my own pieces of “interactive modern art” focused on simple shapes and patterns, and I loved the idea that every bit of user interaction would change the outcome of the resulting pattern.
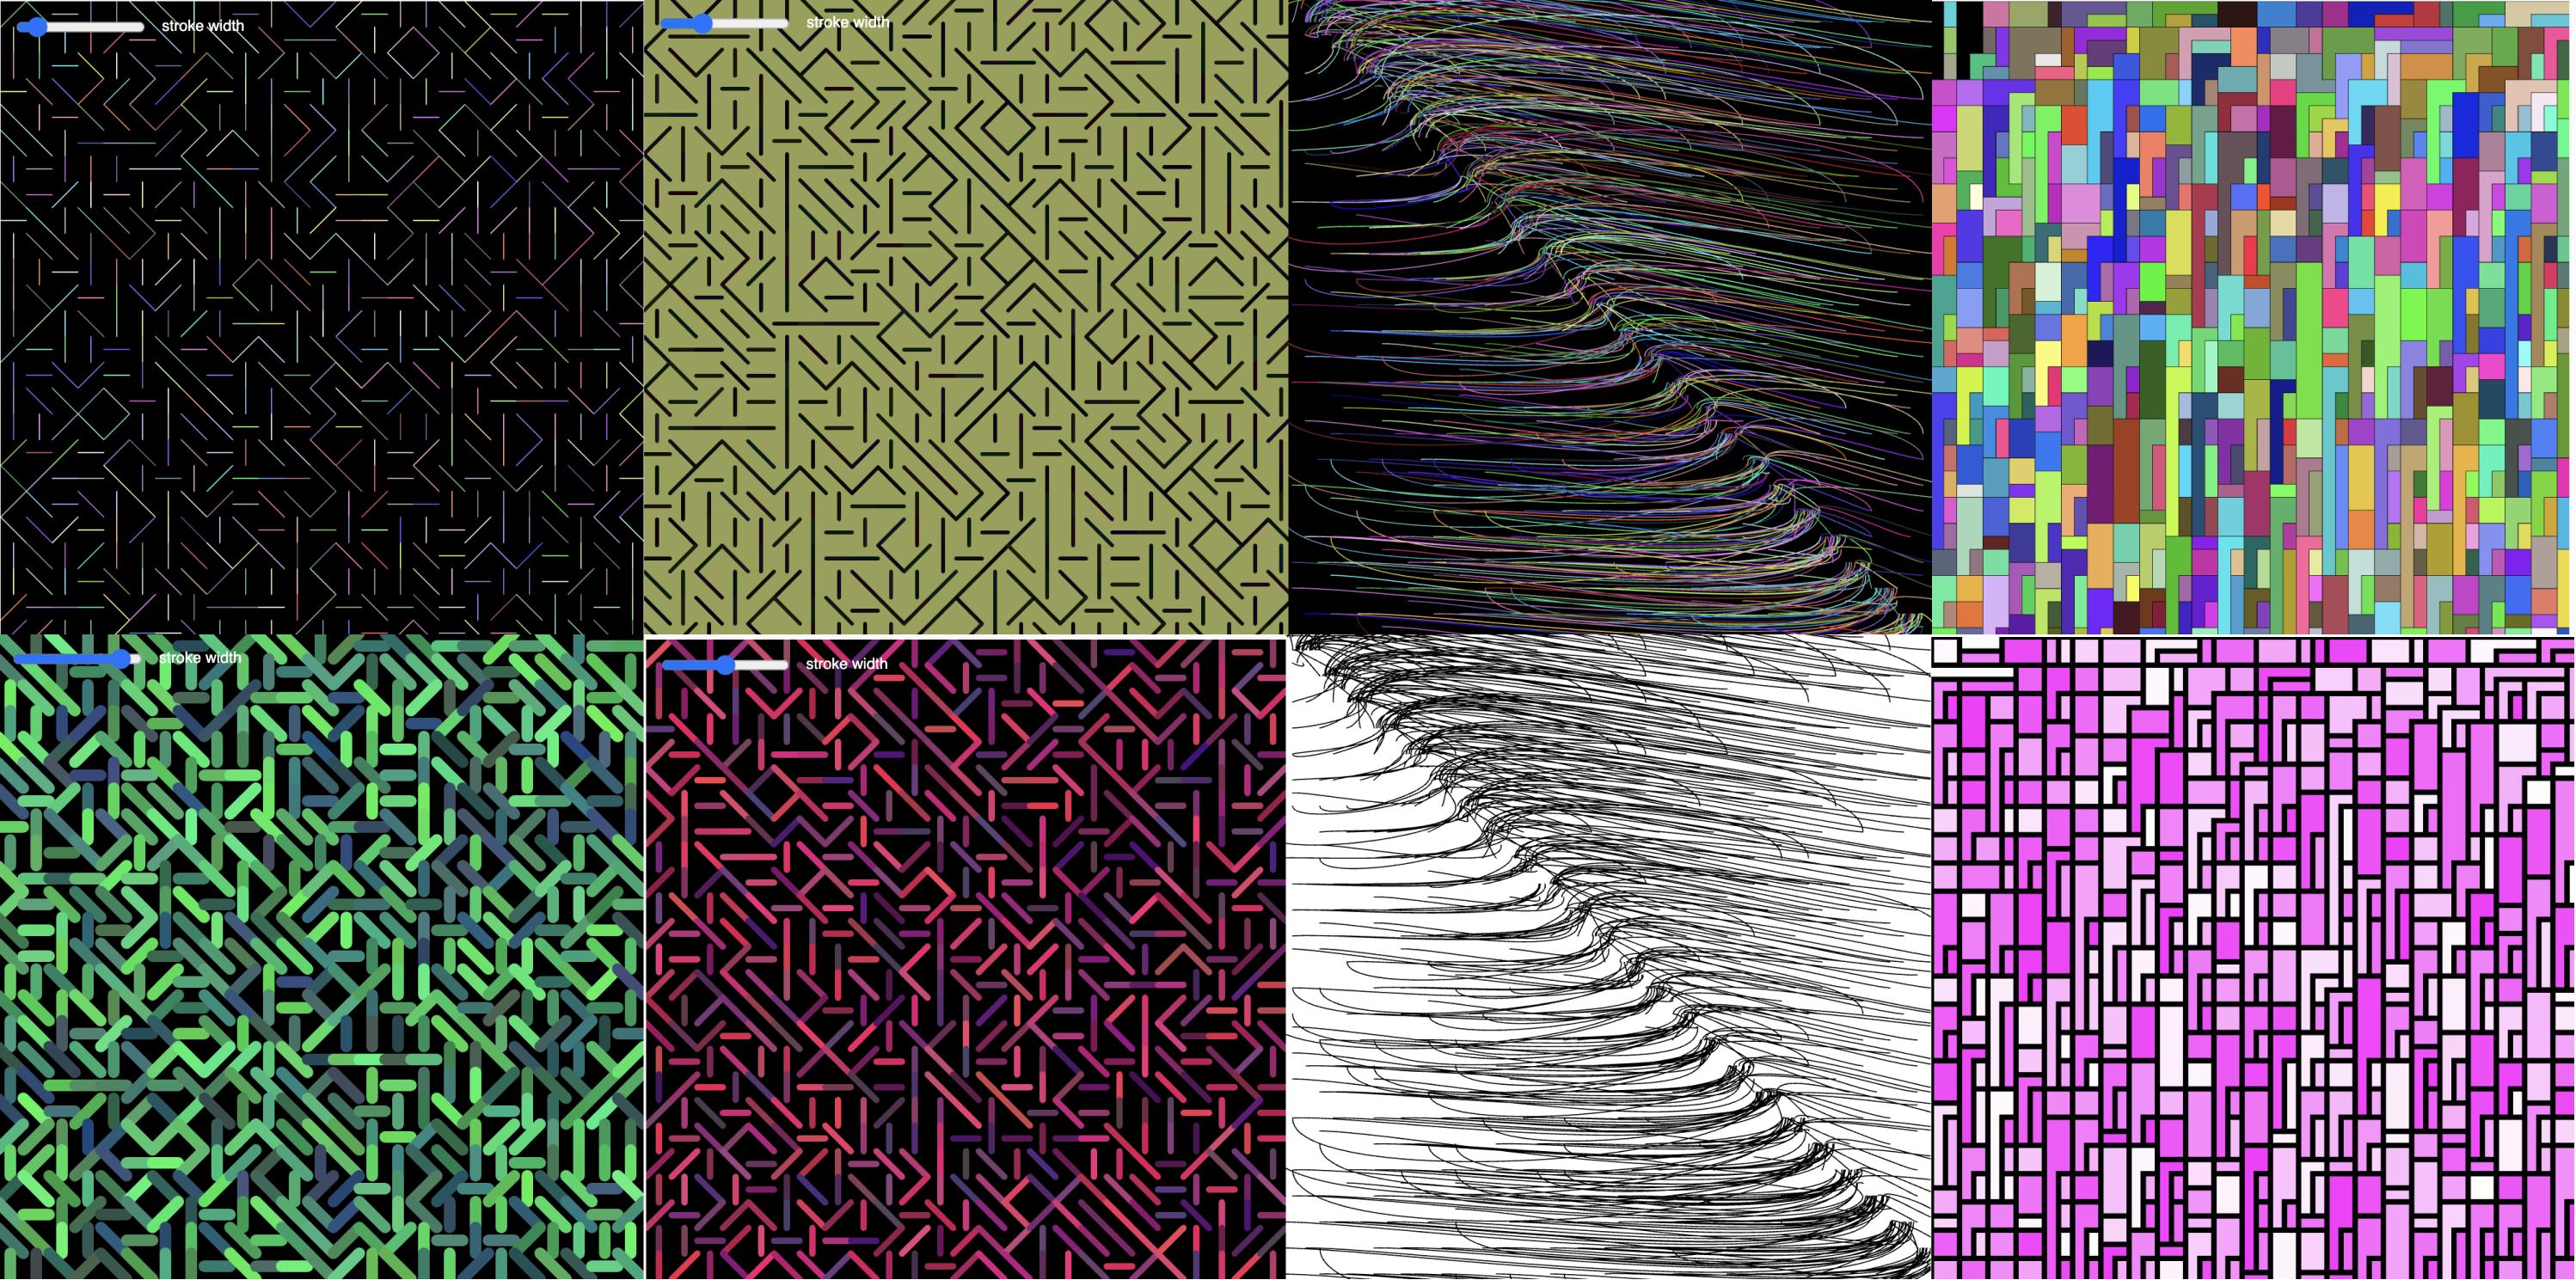
I focused on the for loop because of previous bad experiences with the while loop crashing and deleting my programs. I customized it so that it works with any width and height. I ended up making three experiments: Space Lines, Waves, and Multi Grid, which are all different takes on the same core concept.
The core technical concept for all three pieces is that the program is given four random structures to choose from, the user’s actions influence factors like color and stroke width, and clicking reveals a simpler view of the piece that focuses on the structures involved.
First is Galactic Lines. Galactic Lines is very similar to one of Casey Reas’ works. It reminded me of the “Galactic Chaos” carpet pattern of movie theaters from when I was young, hence the name.
Galactic Chaos, the movie carpet pattern itself
Here, the program chooses between four kinds of lines: vertical, horizontal, diagonally up, and diagonally down. The user’s mouse movement determines the possible colors from the RGB scale that can be displayed. It then provides a slider that users can change stroke width with. Clicking reveals the bare bones of the structure in black while the background continues to change color.
The second piece is Waves, which resulted from an experiment with Bezier curves. It reminded me of waves rolling in at the beach, hence the name. Moving the mouse changes the color of the strokes, which almost made me feel like I could see the waves under different kinds of lighting at different times of day. Clicking once again reduces the piece to its more structural elements.
The last piece is Multi Grid, which plays with the same grid structures that artists have played with for centuries using rect and random coordinate points. I made this piece the most interactive; it also changes the stroke width as you hover around, leading to stills that look extremely different from each other. In the upper left corner, it’s a colorful puzzle that could be a crowd of brightly-dressed people; at upper right corner it’s hot pink and thick-stroked. Clicking makes it as minimalist as you might expect.
Making these pieces was very fun. I tried to focus more on making interesting, responsive, and generative concepts rather than an overly technical piece. I also wanted each still to look like a piece of its own, so that someone playing with the pieces could come up with stills that look cool enough to use as wallpapers or shirt patterns or a piece of modern art. Here are some select stills I liked:
I would improve these in the future by trying to have the structures themselves respond to mouse movement (like leaving a circle of empty space around the mouse, or allowing the mouse to push and pull the structures with dragging). I would also try smoother animations since the rapidly shifting colors can come off a bit jarring. Lastly, I would try and make more complicated shapes and structures, not just grids, lines, and shapes.
For example, an extension of this project would probably be some kind of generated village, where houses, streets, lamps, cars, and people are randomly placed throughout the map, and colors of roofs/cars or the heights of buildings change with user input.