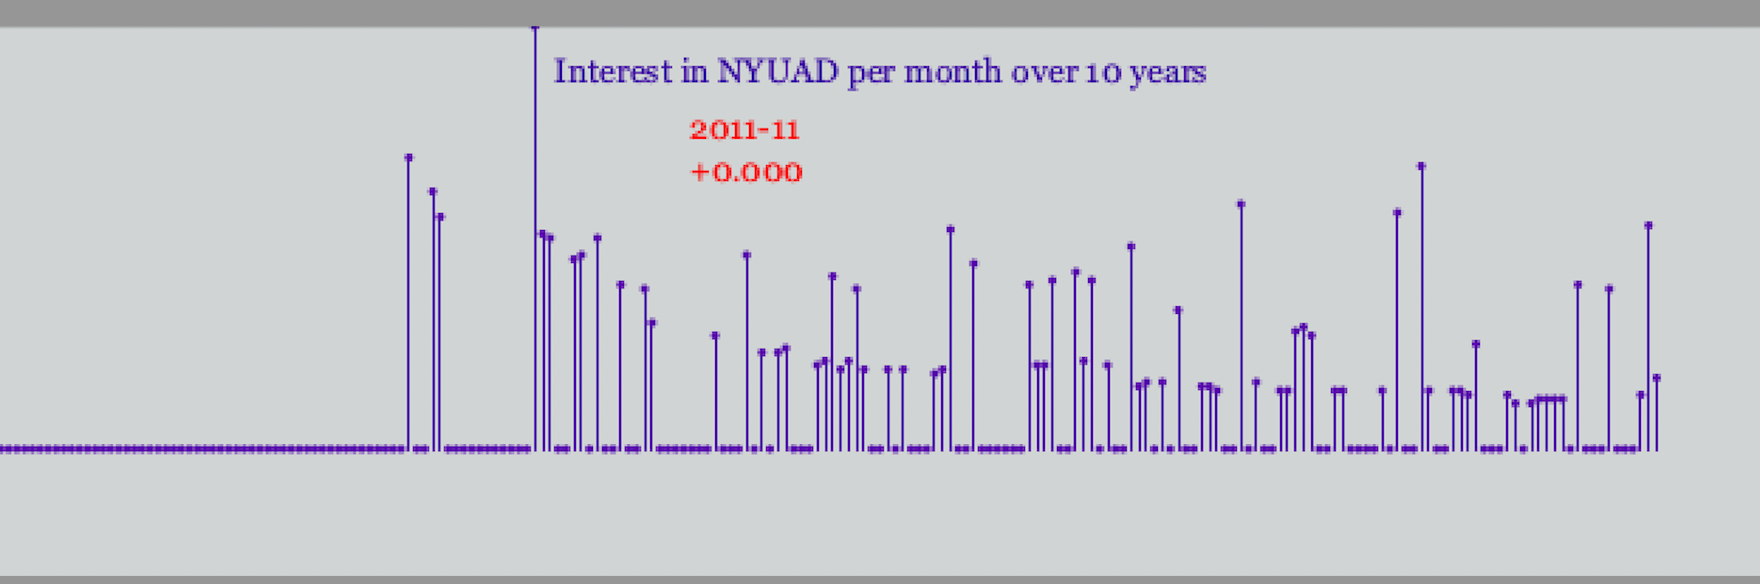
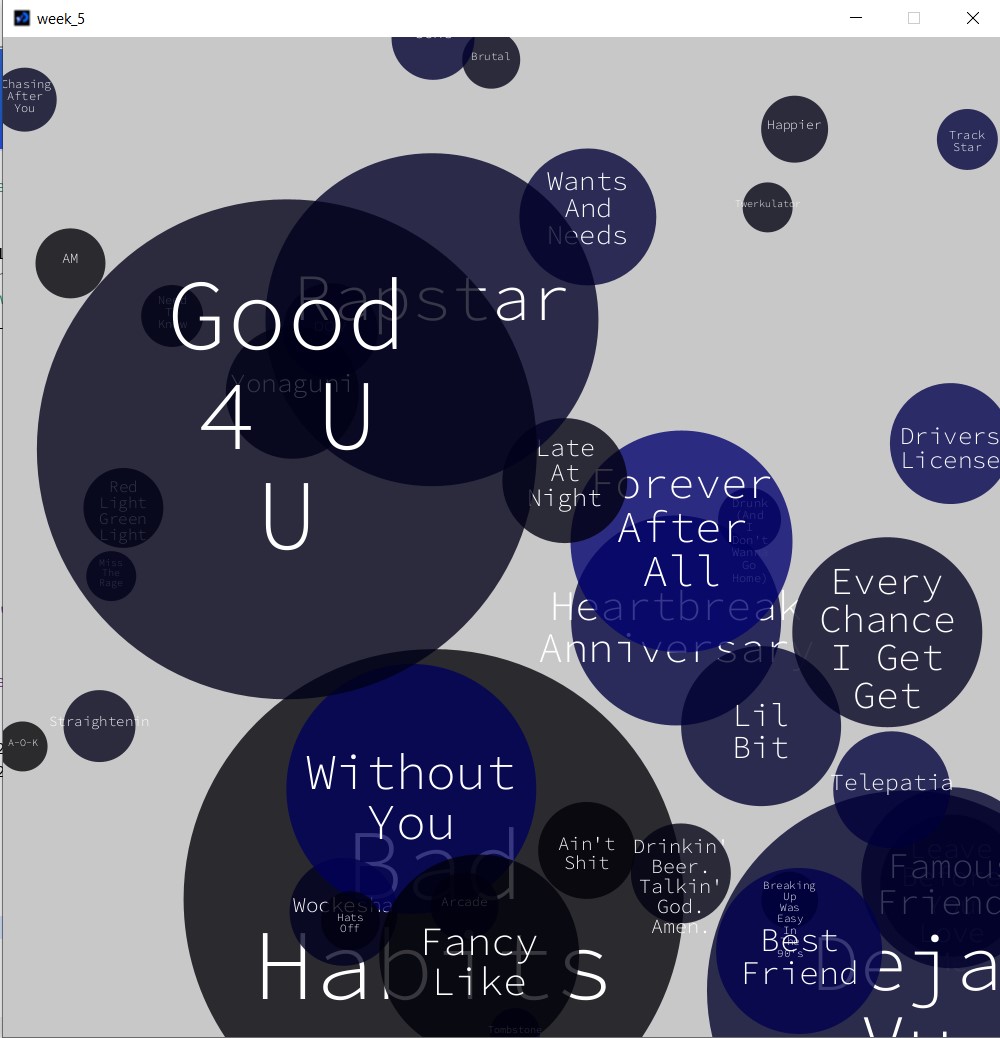
This data visualization was done in celebration of NYU Abu Dhabi’s 10th anniversary. What has been the interest in NYU Abu Dhabi overtime for the past ten years based on google searches?
Process
Using Google Trends, I got the data of searches for NYUAD from 2004 to the present grouped by months.
After loading the data, I went through each column mapping the rows to a wider range of values. For the second column, I mapped from 150 to 0 as opposed to the other way round to avoid drawing the lines upside-down.
After cleaning my data through the map function, I drew lines with a little circle on top. The little circle on top was drawn using ellipses with small diameters. I used smooth() to draw lines with anti-aliased edges.
To make things more interesting, I added a new line with red color that shows the date and increment in searches when the mouse pointer is moved. I achieved this using the nfp () function which formats a number to a string and shows ” + ” when positive and ” – ” when negative.
Final Work
DataViz
Video
Challenges
Cleaning the data was the biggest challenge. Did a lot of trial and error to find the right scale for mapping. I had trouble making the lines a bit bigger. I wanted to deepen the line representing the start of each year but it looked horrible. I wanted to add labels below the line graph but it appeared to be clustered.
Code
// Line plot of NYUAD search per month

color [] Pride = {  #ffffff, #560BAD , #480CA8,#3A0CA3, #FF0000};
color [] palette = Pride;

Table table;

PFont titleFont;

int mx = 30; // mouseX position


void setup() {
 size(640, 200);

 // set fonts
 titleFont =  createFont("Georgia", 12);


 // load Data
 table = loadTable("NYUADTimeline.csv", "header");

 // draw with smooth anti-aliased edges
 smooth(2);

}


void draw() {
  background(palette[0]);
  textFont(titleFont);
  stroke(palette[4]);
  fill(palette[3]);
  textAlign(CENTER);
  text("Interest in NYUAD per month over 10 years", width/2, 20);


  for (int row = 0; row < table.getRowCount(); row++) {

    String dates = table.getString(row, 0);
    float searches = table.getFloat(row, 1);
    float x = map(row, 0, 216, 0, 600);
    float y = map(searches, 0, 100, 150, 0);


    // SLIDER
    if((mx > 30) && (mx < 640)) {
      line(mx, 30, mx, 150);
      if(abs(mx - x) < 2) {
        fill(palette[4]);

       // show the dates and search count
        text(dates, mx + 6, 40);

        // format numbers into strings with 1 decimal to left and 3 to right
        text(nfp(searches, 1, 3), mx + 6, 55);
      }
    }


    // DRAW Lines and dots on top

    // thickness of each line
    strokeWeight(1);

    stroke(palette[1]);
    line(x, y, x, 150);
    noStroke();
    fill(palette[1]);
    int d = 3;
    ellipse(x, y, d, d);

  }


}


void mouseMoved() {
  mx = mouseX;
}
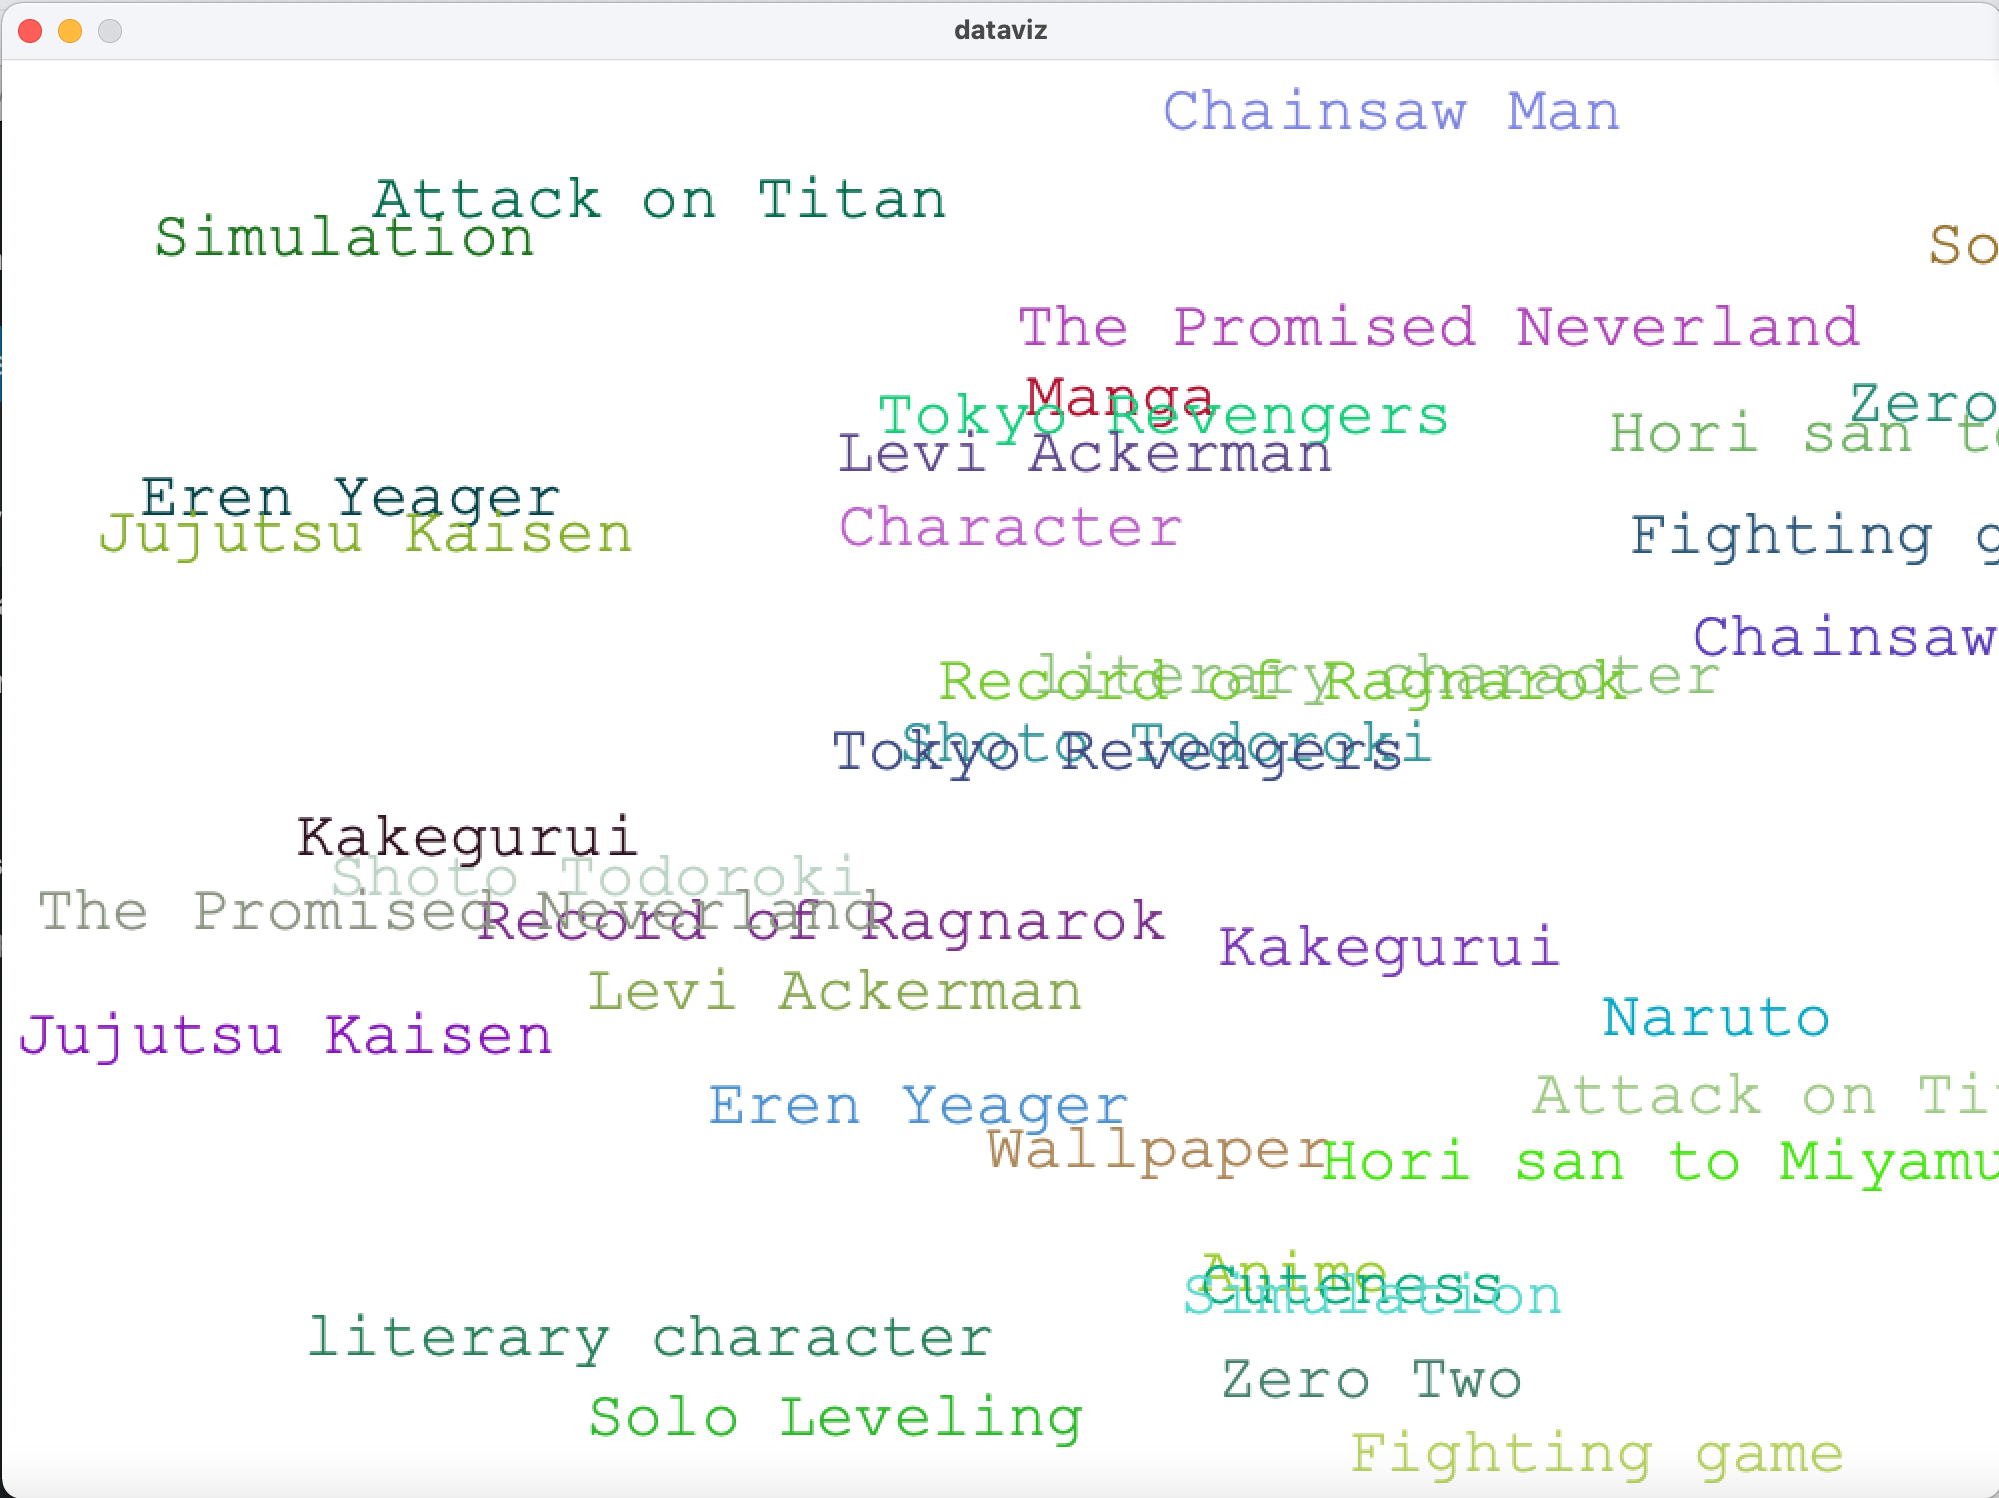
This week’s assignment was to either make a data visualization or generative text art. I decided to make a data visualization that involves text.
I went to Google Trends and found the most popular searches relating to anime, so I downloaded the csv file and added it to my sketch folder. I deleted the blank rows for my own convenience.
I made a for loop to display the searches in random places with random colors. It looked like this:
As you can see, the texts overlap and they continue on the right side outside of the sketch.
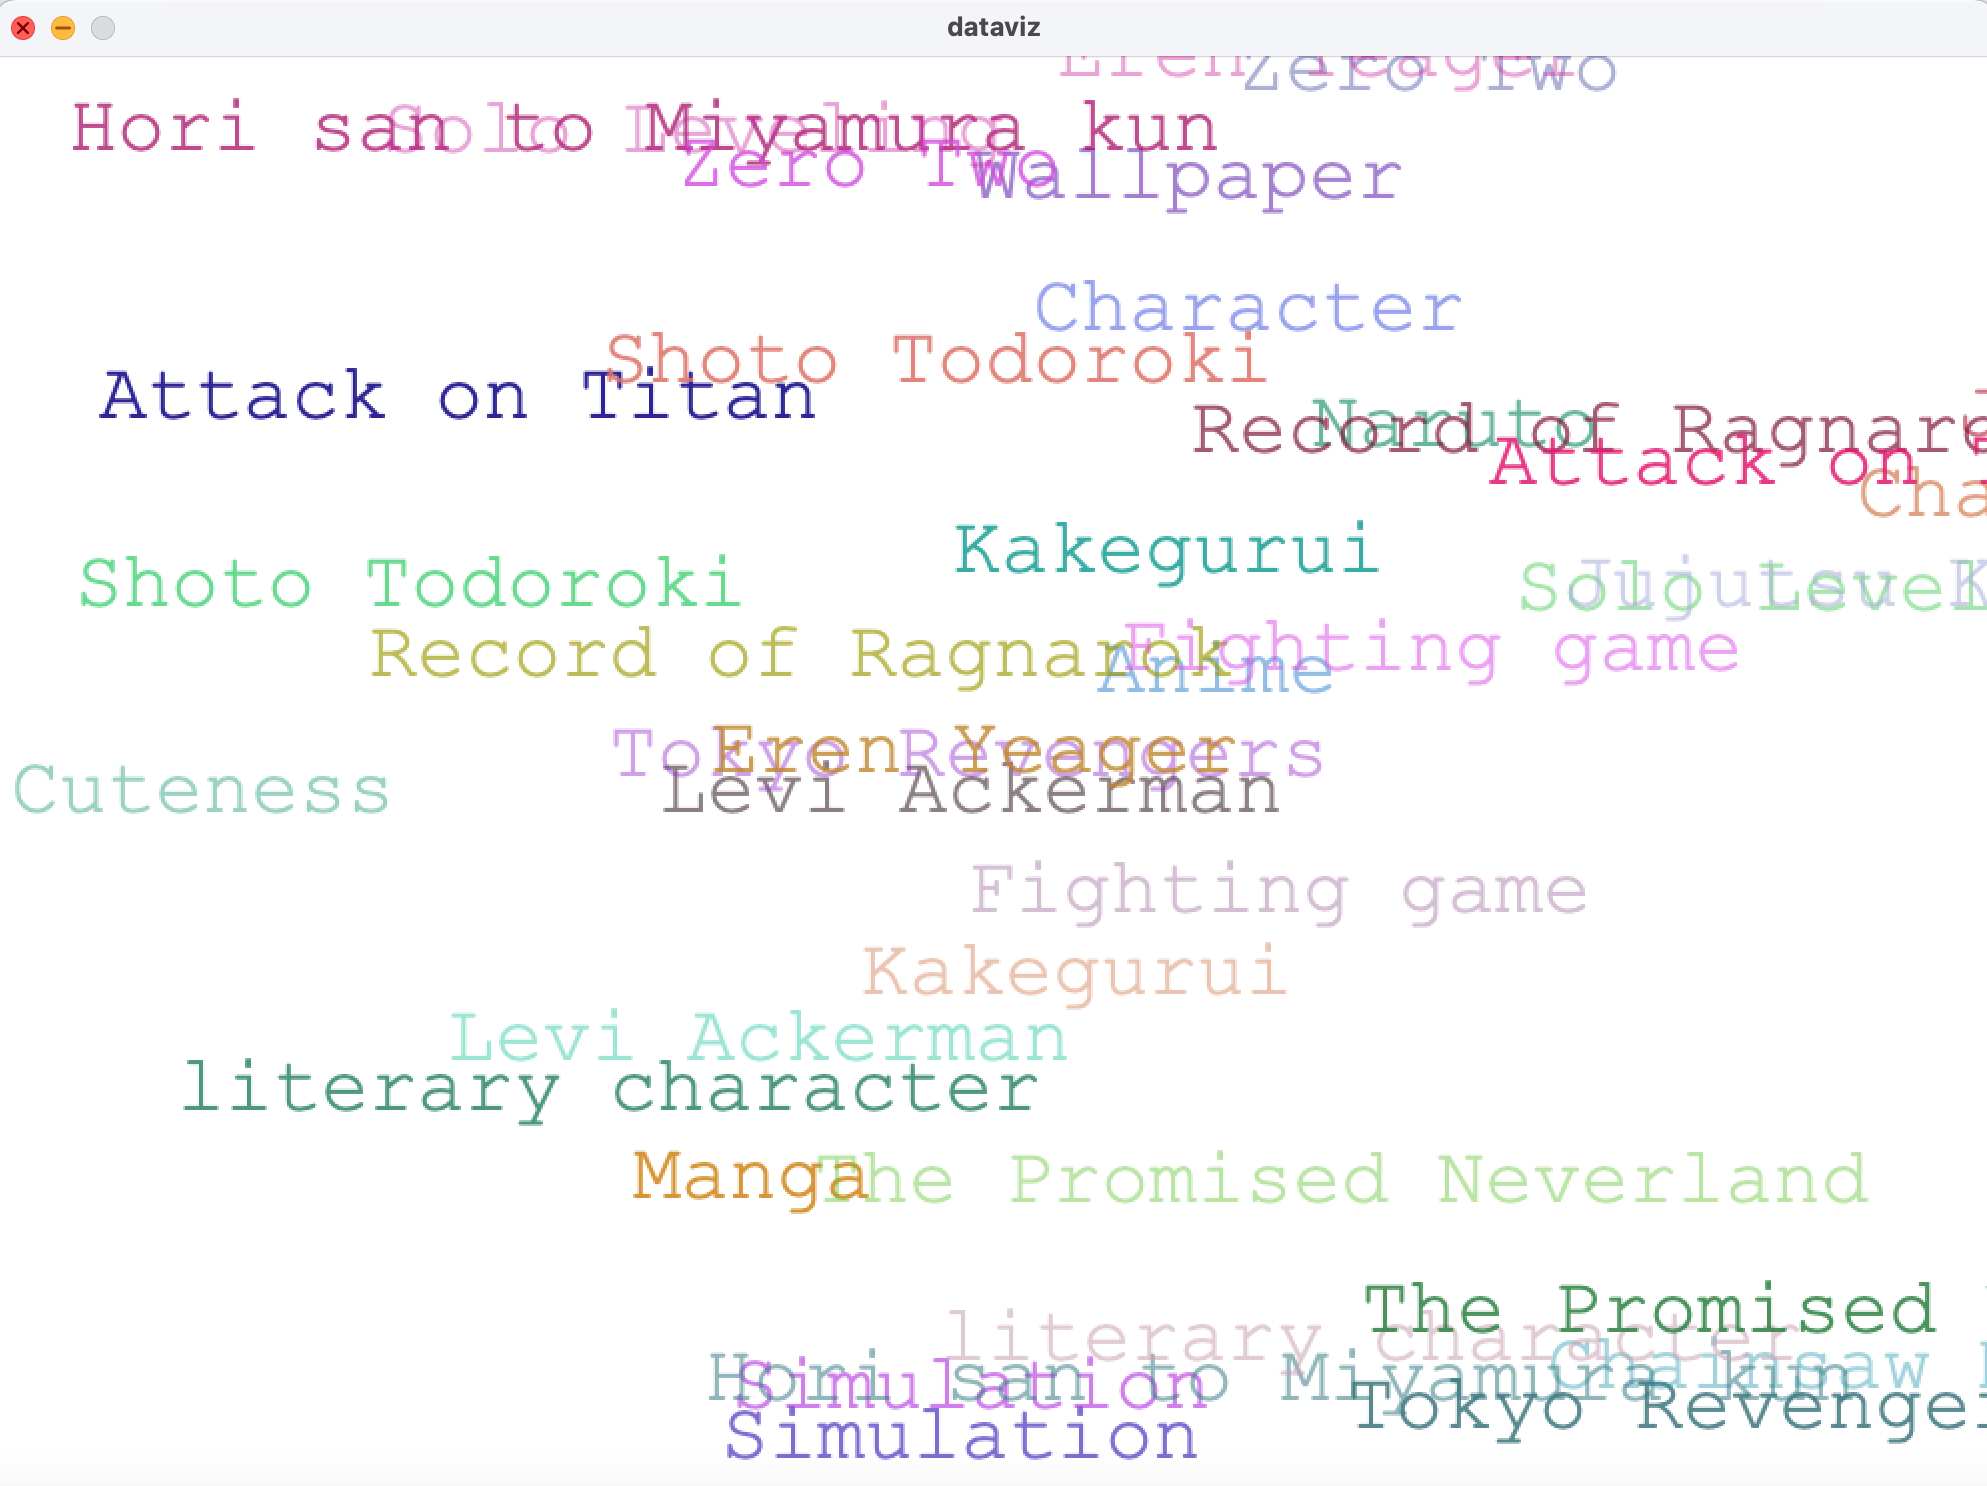
I wasn’t sure how to fix this from happening, so I just ended up adding transparency to the fill and it looks like this now: (I’d like to add that the positions are random so it changes every time you run it)
Here’s the code!
Table table;
float spacing;
PFont f;
String searches;
int tw;

void setup() {
  size(1000, 720);
  loadData();
  //f= createFont("Franklin Goth Ext Condensed.ttf", 75);
  // didnt work^
  f = createFont("Courier New", 32);
textFont(f);
textSize(40);
}

void loadData() {
  table = loadTable("anime.csv", "csv");
  spacing = float(width)/(table.getRowCount());

}

void draw() {
  background(255);
  frameRate(0); //so it doesnt keep changing
  for (int i = 0; i < table.getRowCount(); i++) {
    TableRow row = table.getRow(i);
    searches = row.getString(0);
    fill(random(230),random(230), random(230), random(100,240));
    text(searches, random(width), random(height));
  } //this for loop is going to loop through the table contents
}
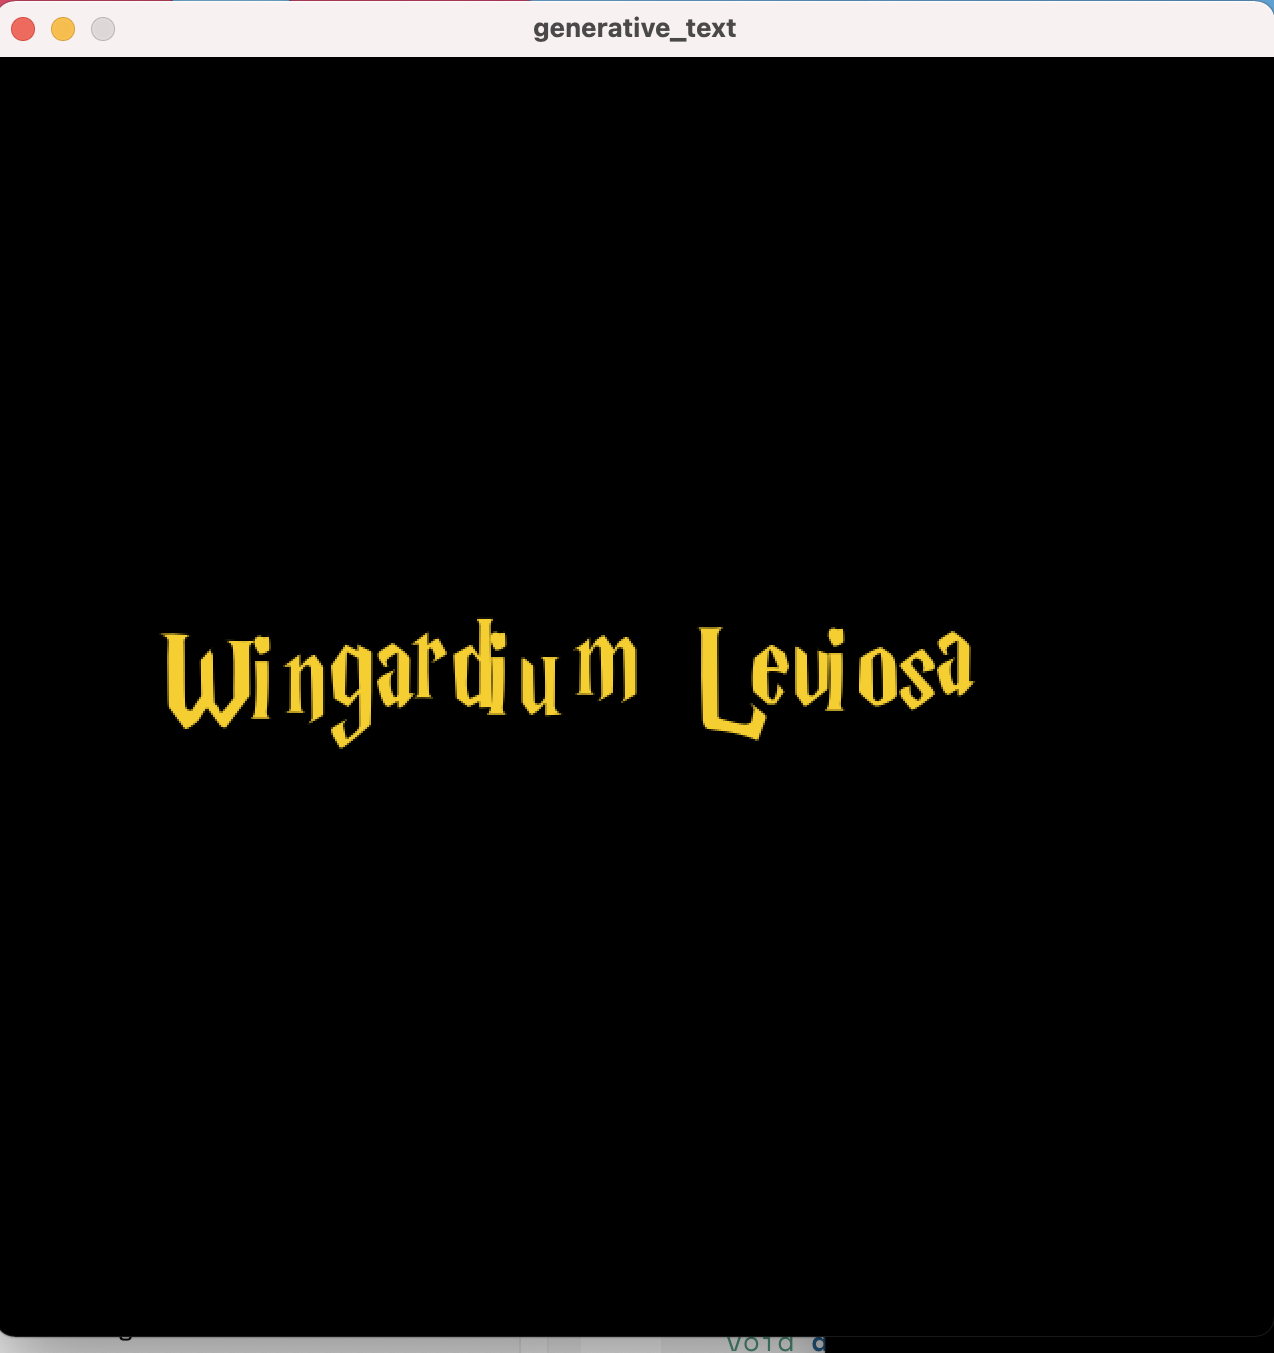
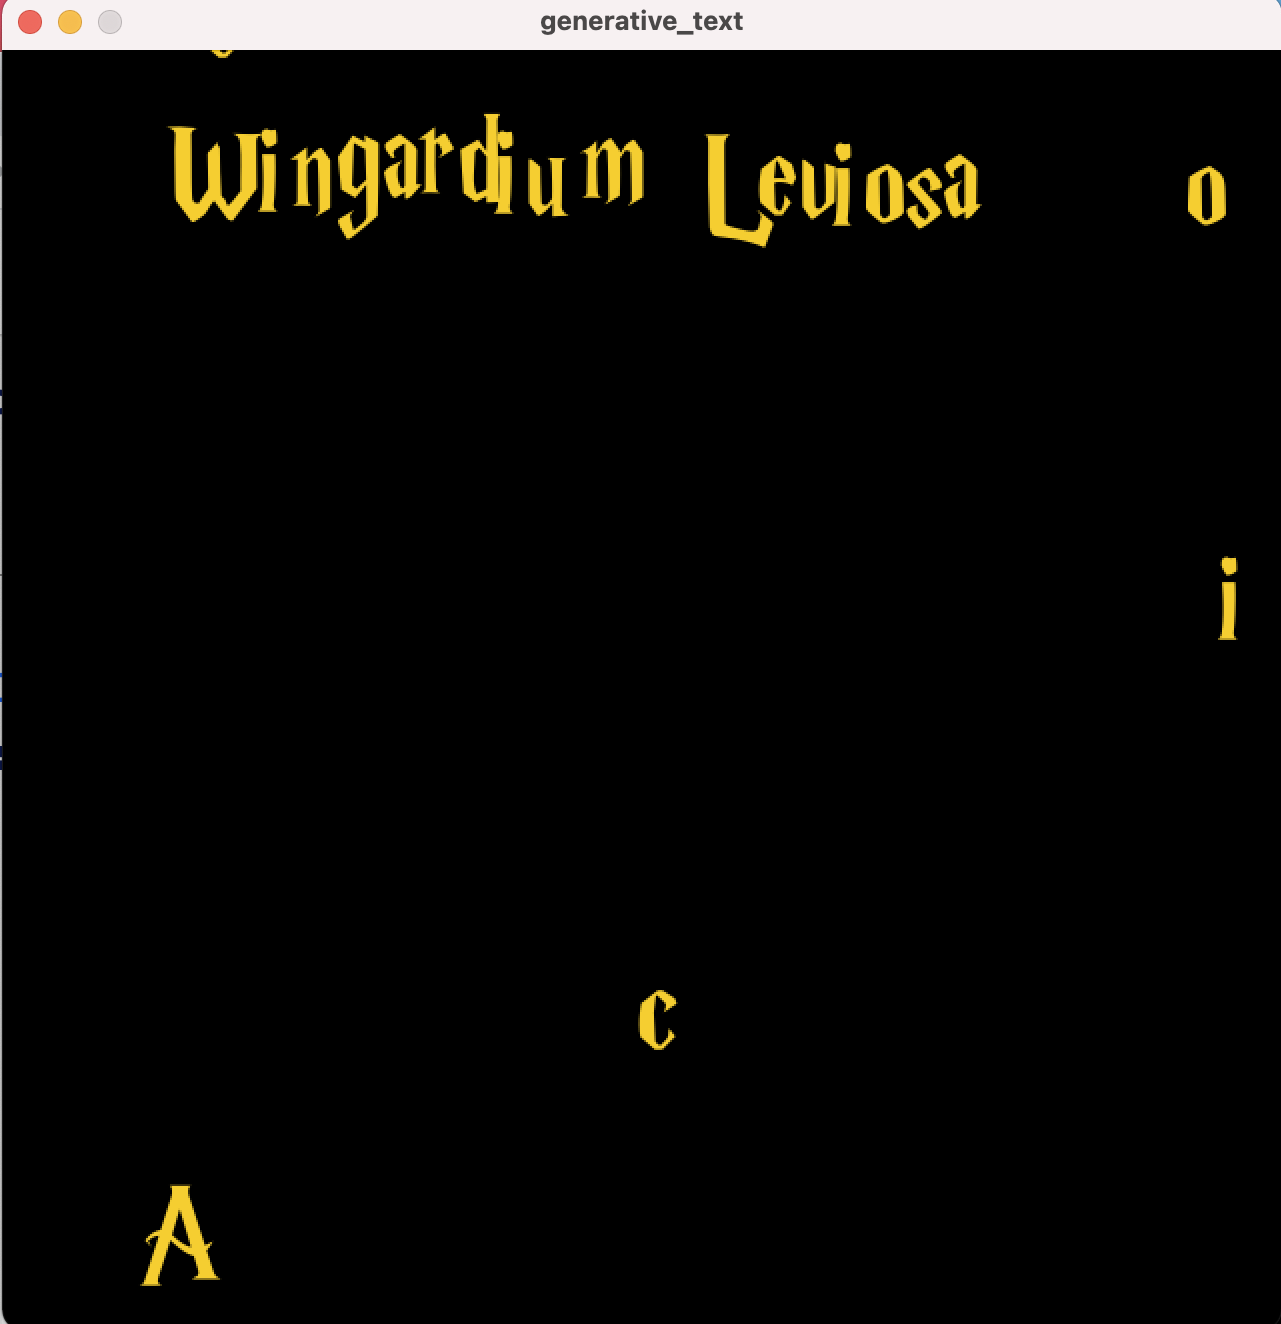
I solemnly swear I was up to no good with this assignment.
I have been back into a Harry Potter phase of sorts so of course I had to project that agenda onto this assignment. My urge for this week had always been to make text representative of its meaning, because I love when that is done in media. And when I thought of linking it to Harry Potter, I thought that spells would be the perfect way to achieve this effect.
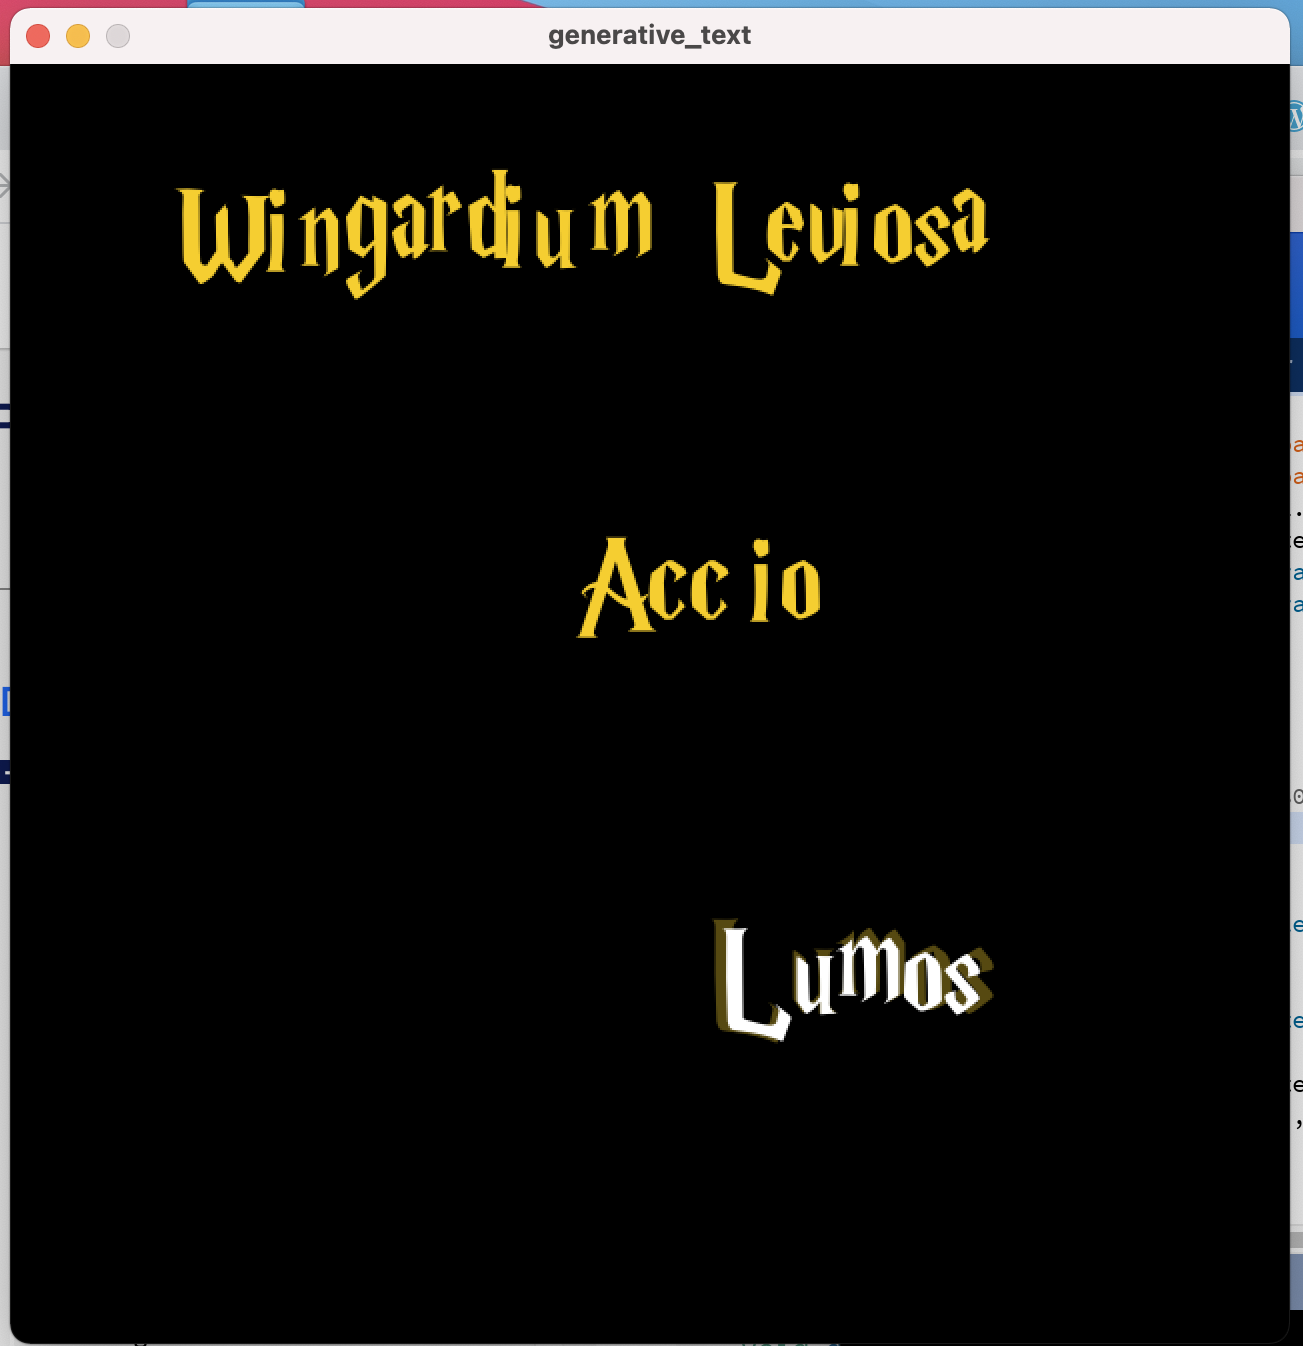
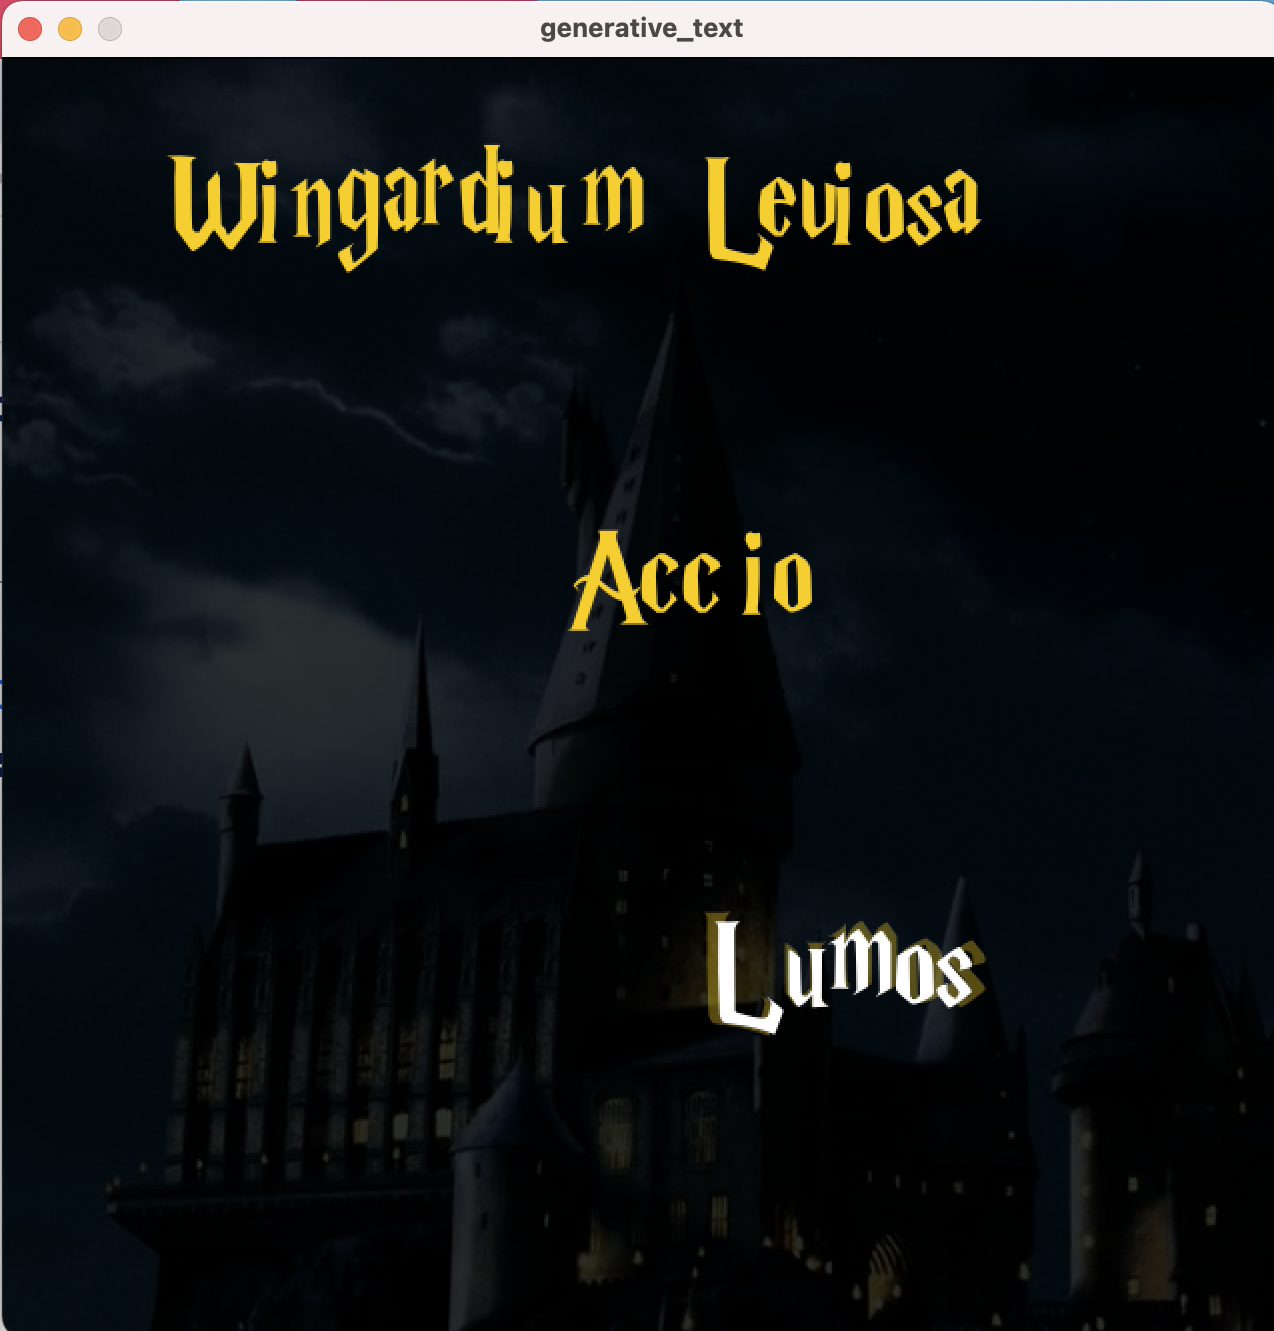
I ran through a lot of ideas and settled on three relatively well-known spells: Wingardium Leviosa, Accio, and Lumos. Wingardium Leviosa (LeviOsa not LeviosAR) is the levitating charm many people might remember from the first movie, which does exactly what you would expect a levitating charm to do. So, I wanted this text to float up from the bottom and then once it had reached around the top, keep hovering over there. This was simple enough with a function to change the y value according to a particular speed.
In the process of floating up (pay attention, Ron)
The Accio spell can summon any object you take the name of (unless of course it has some anti-summoning protection). To put this effect in text I wanted to have the letters floating around the screen randomly, and then have them abruptly come to their final location. For this, I re-used the Letter class we had done in class, and some of the code from the circular orbit example, because I basically wanted to achieve the opposite flow of it. I made some minor changes to the Letter class, which is here:
class Letter { //copied from in-class code with very slight changes
  float x, y;
  float xSpeed, ySpeed;
  char letter;

  Letter(float _x, float _y, char _c) {
    x = _x;
    y = _y;
    xSpeed = ySpeed = 0;
    letter = _c;
  }

  void update() {
    x += xSpeed;
    y += ySpeed;
  }

  void display() {
    text(letter,x,y);
  }

  void checkEdges() {
    if (y>height) {
      y=0;
    }
    if (y<0) {
      y=height;
    }
    if (x>width) {
      x=0;
    }
    if (x<0) {
      x=width;
    }
  }
}
Here’s a random screenshot of the moving letters:
Accio a coherent blog post :’)
And finally, Lumos would produce a small glowing white light at the tip of your wand, useful for seeing in the darkness. This was pretty simple to achieve, by drawing white text instead of the yellow when a certain time had passed, but also having some yellow transparent bigger text in the background. The idea was that the colour change from yellow to white would give the lighting up effect.
The Golden Trio
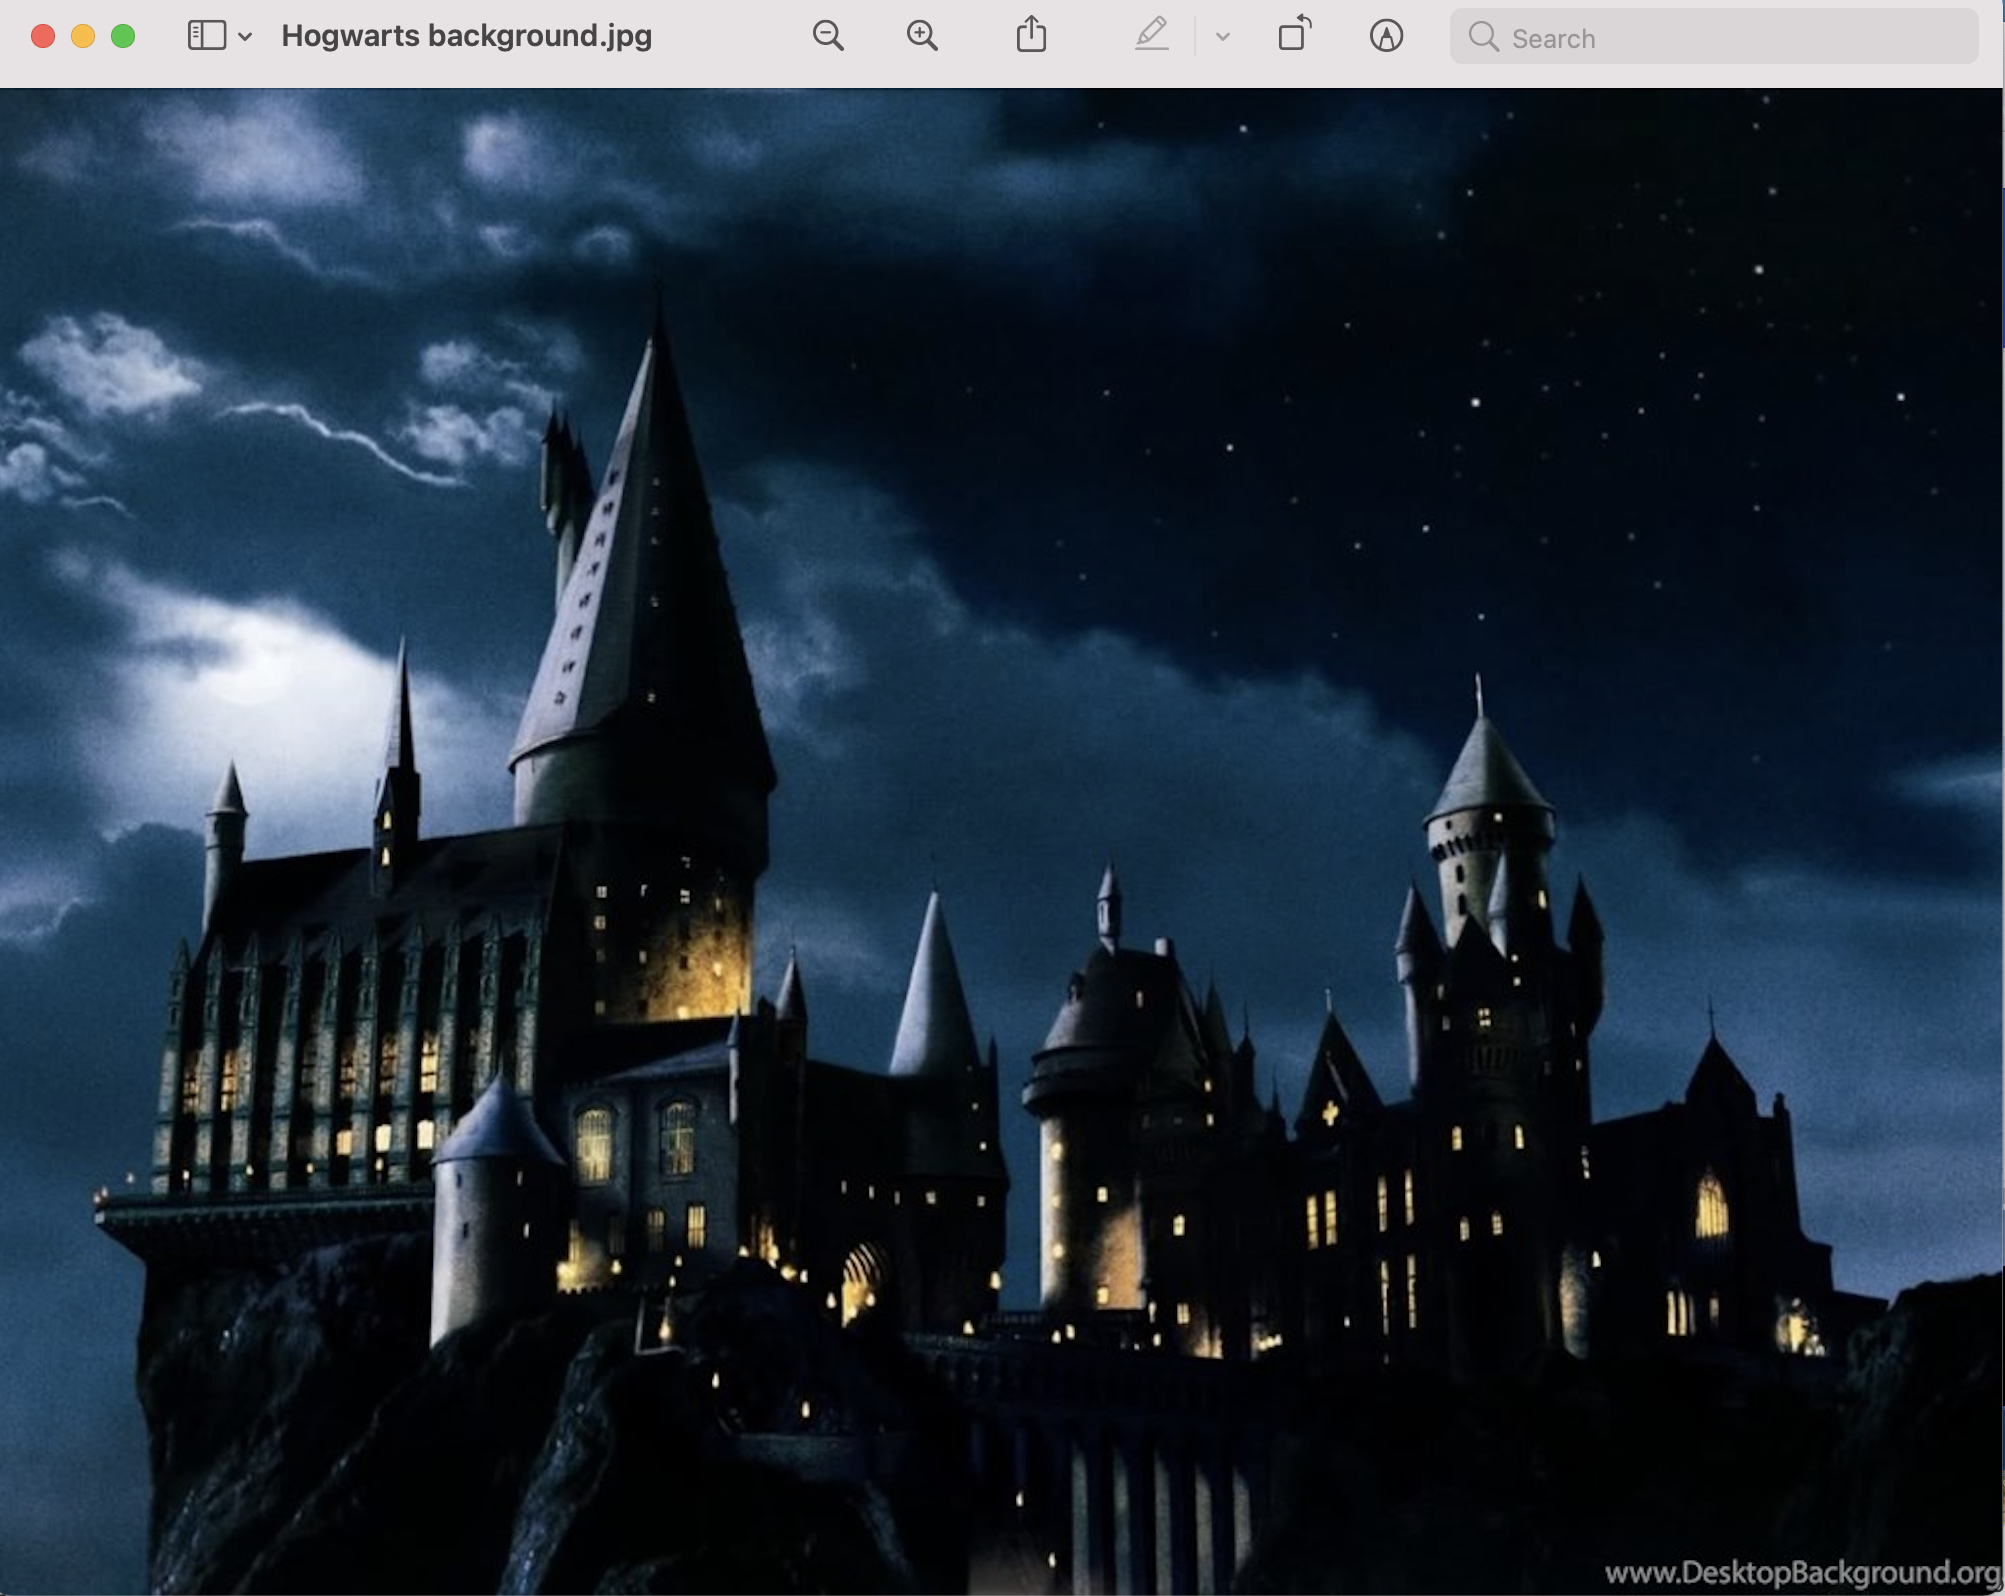
Having decided the overall placement and executing the spells, I thought of inserting a background for a more Harry Potter-esque experience, and decided there could be nothing better than the Hogwarts castle itself.
Hoggy hoggy Hogwarts in the background
And then I added a darker tint and added an alpha value to make it faded, and I was done!
Final Still
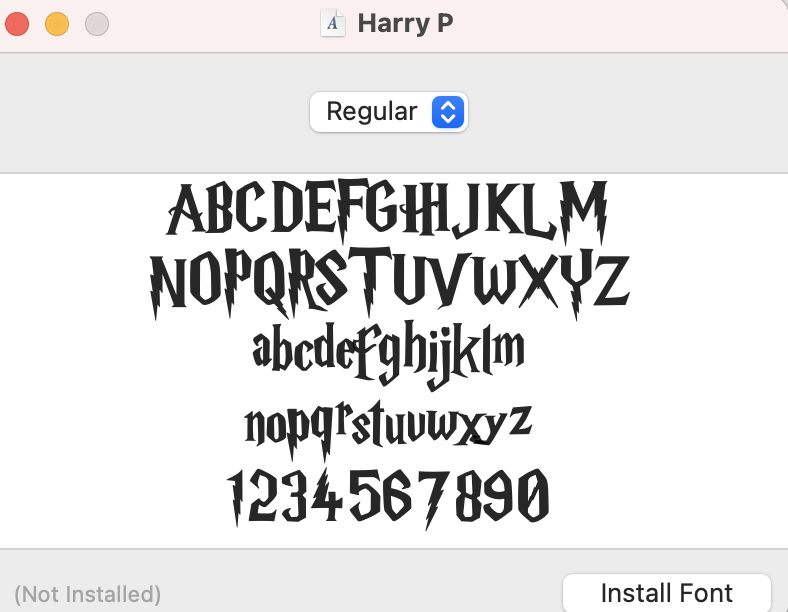
I haven’t talked a lot about my process so I’ll mention the highlights here. First of all, I had to download the font and it was not a monospaced one, as I realised in my very first test. So I had to figure out a way to make them it look regularly spaced in the spells where I was separating characters, and for this I used arrays. Every element of the two text_width arrays stored the length of the string uptil the current character, and I updated that alongside in the displaying loop. For the Wingardium Leviosa levitation, I also added the noise code from class to make it look more natural.
Iconic Harry Potter Font
For each spell, I made a function which carried out their meaning, and timed them using frameCount. I also included the functionality that on clicking the mouse, frameCount would be reset to -1, hence essentially restarting the sketch. I was thinking of adding Hedwig’s theme as an audio file to run in the background, but then I thought it wouldn’t run long enough and would sound weird. I do plan to check out if I can keep the audio running without it resetting with the mouse click. And of course, the background image and font file had to be included in the sketch folder in Processing.
This was the main sketch’s code:
PFont f;
PImage img;
String spell1 = "Wingardium Leviosa"; //spell for levitation
String spell2 = "Accio"; //spell for summoning something
String spell3 = "Lumos"; //spell for lighting the tip of the wand
int posx1;
int posy1;
float posx2;
int posy2;
int speed = 2;
float[] text_widths1; //will help in determining the width of substrings
float[] text_widths2;
int x_offset = 250;
Letter letters[] = new Letter[spell2.length()];

void setup(){
  size(640, 640);
  img = loadImage("Hogwarts background.jpg");
  f = createFont("HARRYP__.TTF", 72); //Harry Potter font used in the movies
  textFont(f);
  textAlign(CENTER);
  posx1 = width/2 - x_offset;
  posy1 = height - 72;
  posx2 = width/2 - textWidth(spell2)/2;
  posy2 = height/2 - 36;
  text_widths1 =  new float[spell1.length()];
  text_widths2 =  new float[spell2.length()];
  for(int i = 0; i<spell2.length(); i++){ //initialising the moving letters for Accio
    letters[i] = new Letter(random(640), random(640), spell2.charAt(i));
    letters[i].xSpeed = random(-5,5);
    letters[i].ySpeed = random(-5,5);
  }
}

void draw(){
  background(0);
  tint(136, 152, 155, 80); //dark, faded effect
  image(img, 0, 0);

  fill(245, 206, 49);
  for(int i=0; i<spell1.length(); i++)
  {
    //as it is not a monospaced font, text_widths arrays help in storing the width of the string upto
    // that character. Here I calculate this by adding the previous element of the array to the width of the current letter
    if(i==0)
      text_widths1[i] = textWidth(spell1.charAt(i));
    else
      text_widths1[i] = text_widths1[i-1] + textWidth(spell1.charAt(i));

    text(spell1.charAt(i), posx1 + (i==0? text_widths1[0]-13: text_widths1[i]), posy1 + noise(frameCount*.01+i*0.01)*100 - 50);

  }
  levitate(); //starts the levitating effect

  if(frameCount > 250 && frameCount < 400) //for the passage of time
  {
    for(int i = 0; i<spell2.length(); i++){ //random movement
      letters[i].update();
      letters[i].display();
      letters[i].checkEdges();
    }
  }

  if(frameCount >= 400)
    summon(); //to bring the letters into place

  if(frameCount >= 450 && frameCount < 525){
    //fill(181, 192, 193); - discarded idea for turning grey to yellow
    fill(245, 206, 49);
    text(spell3, width/2 + 100, height-height/4);
  }

  if(frameCount >= 525){
    lightItUp(); //to give the effect of the yellow being lit up into white
  }

}

void levitate(){
  if(posy1 - speed > 120) //to levitate upwards uptil a certain point below the border is reached
    posy1 -= speed;
}

void summon(){
  for(int i = 0; i<spell2.length(); i++){ //stops the random movement by fixing x and y values
    if(i==0)
      text_widths2[i] = textWidth(spell1.charAt(i));
    else
      text_widths2[i] = text_widths2[i-1] + textWidth(spell1.charAt(i));

    letters[i].x = posx2 + (i==0? text_widths2[0]-13: text_widths2[i]); //same logic for character widths
    letters[i].y = posy2;
    letters[i].display();
  }
}

void lightItUp(){
  fill(245, 206, 49, 90); //to give a faint yellow glow from behind
  textSize(79);
  text(spell3, width/2 + 100, height-height/4);
  fill(255);
  textSize(72);
  text(spell3, width/2 + 100, height-height/4);
}

void mouseClicked(){
  frameCount = -1; //resets everything because setup() is called at frameCount = 0
}
And with all that said, here is the video with all the animations I have been talking about:
I hope this was able to achieve even a little bit of a magical effect. And there’s nothing more to add from my side, so I’ll just say:
In the beginning, I just wanted to play with letters and characters. I thought I would use noise to make a pattern as I did in my previous assignment, but randomness in this assignment suited better. So I started by writing a simple text message in the center of the screen, then I split the message into characters by using an array. Then I played around to make the characters randomly move around the screen, so it looked like the letter was flying in the air. This is what it looked like.
Then, this looked boring, so I decided to add the key pressed function into it. So every time I would press the key pressed, my name would appear. The name would change its color and randomly disappear making it look nice and interactive. This is what it looked like.
Overall, I would say I wanted to try some other things as well, but I did not know the process for some things, so in the end, I ended up experimenting and made this.
The final video looks like this:
This is the entire code:
// Intro to IM - Assignment #4
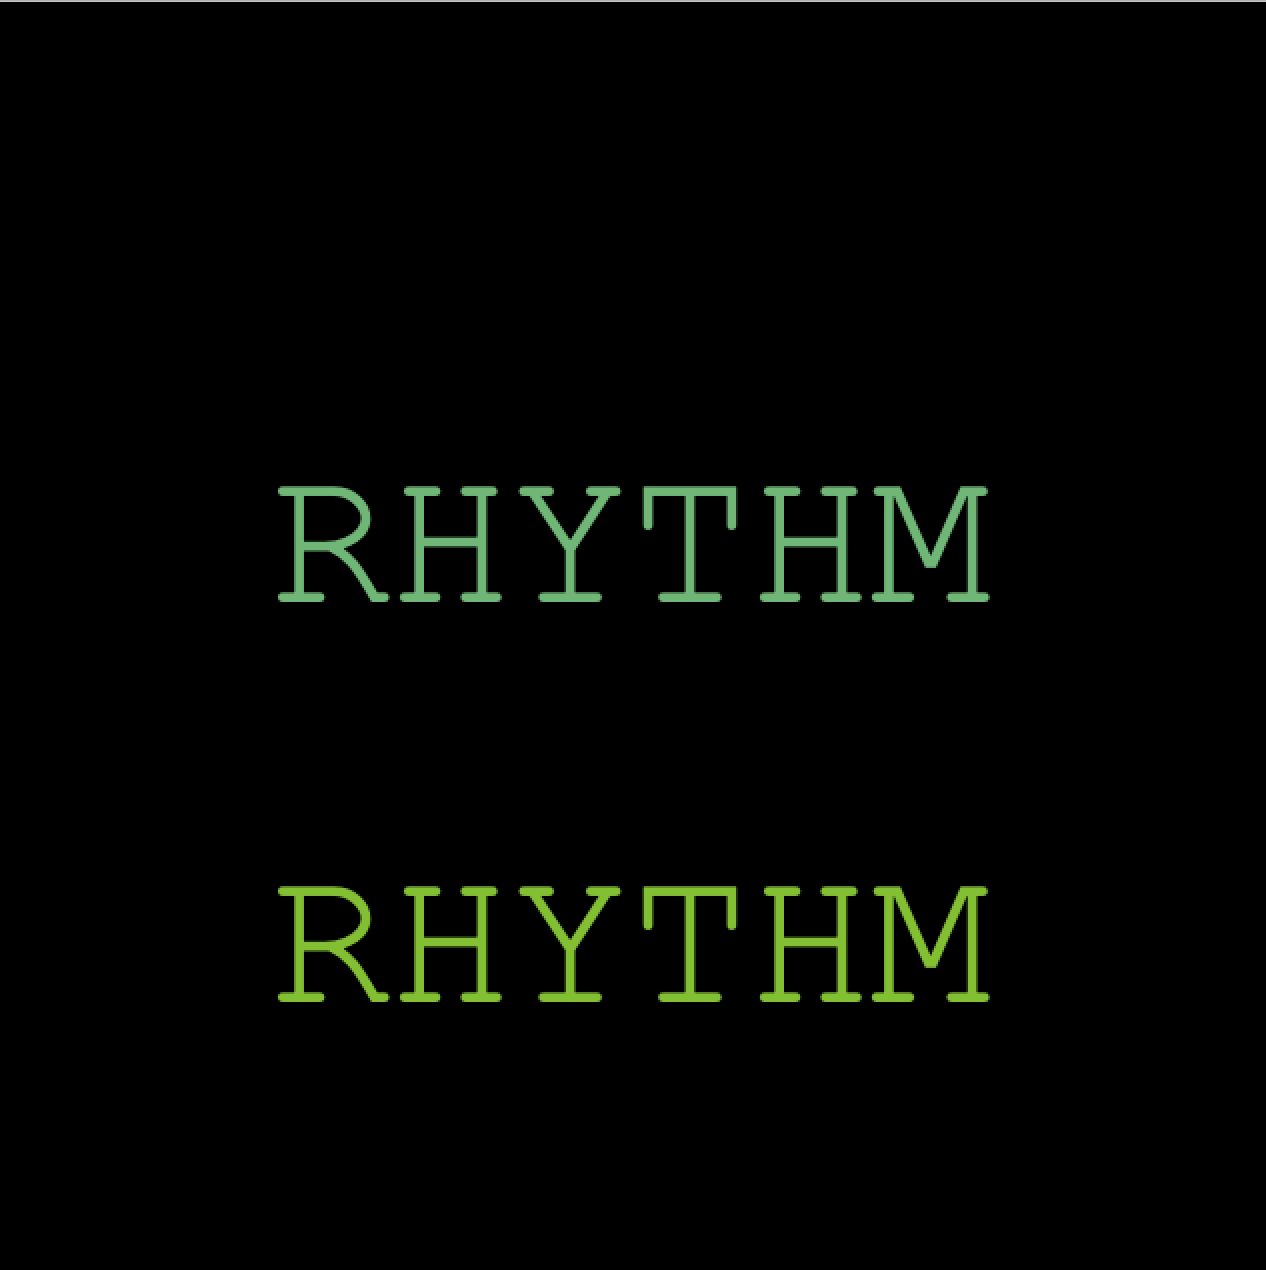
// Rhythm Kukreja (rk3781@nyu.edu)
//setting the variables below
String letter = "rhythmrhythmrhythm";
String letter2 = "RHYTHM";
PFont font;
float x,y;
float hr, vr;
float w = 40;
float h = 40;
float r = 100;
char[] charArray;
void setup(){
frameRate(10);//reducing the framerate for the random effect in the beginning
size(640, 640);
charArray = new char[letter.length()];//to separate the words by character
for(int i=0; i<letter.length(); i++){
charArray[i] = letter.charAt(i);
}
background(255);
hr = textWidth(letter) / 2;
vr = (textAscent() + textDescent()) / 2;
font = createFont("Courier New", 100, true);
textFont(font);
textAlign(CENTER);
x = height/2;
y = width/2;
}
void draw(){
fill(0);
rect(0, 0, width, height);
float xpos=0; float ypos=0;
if (keyPressed){// the key is pressed we see the text that changes color and disappers
for (int i = 0; i < letter2.length(); i++) {
int flag = int(random(0,100));
if(flag%2==1){
fill(random(0,200), random(180,200), random(50,180));
} else {
fill(0);
}
text(letter2, width/2, ((i*100)+100));
}
} else { //if key is not pressed, then we see characters flying around randomly
fill(random(0,200), random(180,200), random(50,180));
for(int i=0; i<letter.length(); i++){
xpos = random(10,width-10); ypos = random(10,height-10);
text(charArray[i], xpos, ypos);
}
}
}
For this week’s assignment, I wanted to start working on something that was related to honeybees. Since we learned about typography in class, I had this concept of a bee moving in the shape of the word “BEE” leaving behind a trail usually shown in animations/pictures depicting bees.
Based on an example from the last class which used the geomerative library to make the word “circle” from circles, I made the word “BEE” with a bunch of points and had the points showing up in such a way that it looked like a bee-like object traced the word. I made a class for the bee and a function to display the bee moving. The bee was made from a circle and two triangles to make wings. Here’s how this turned out.
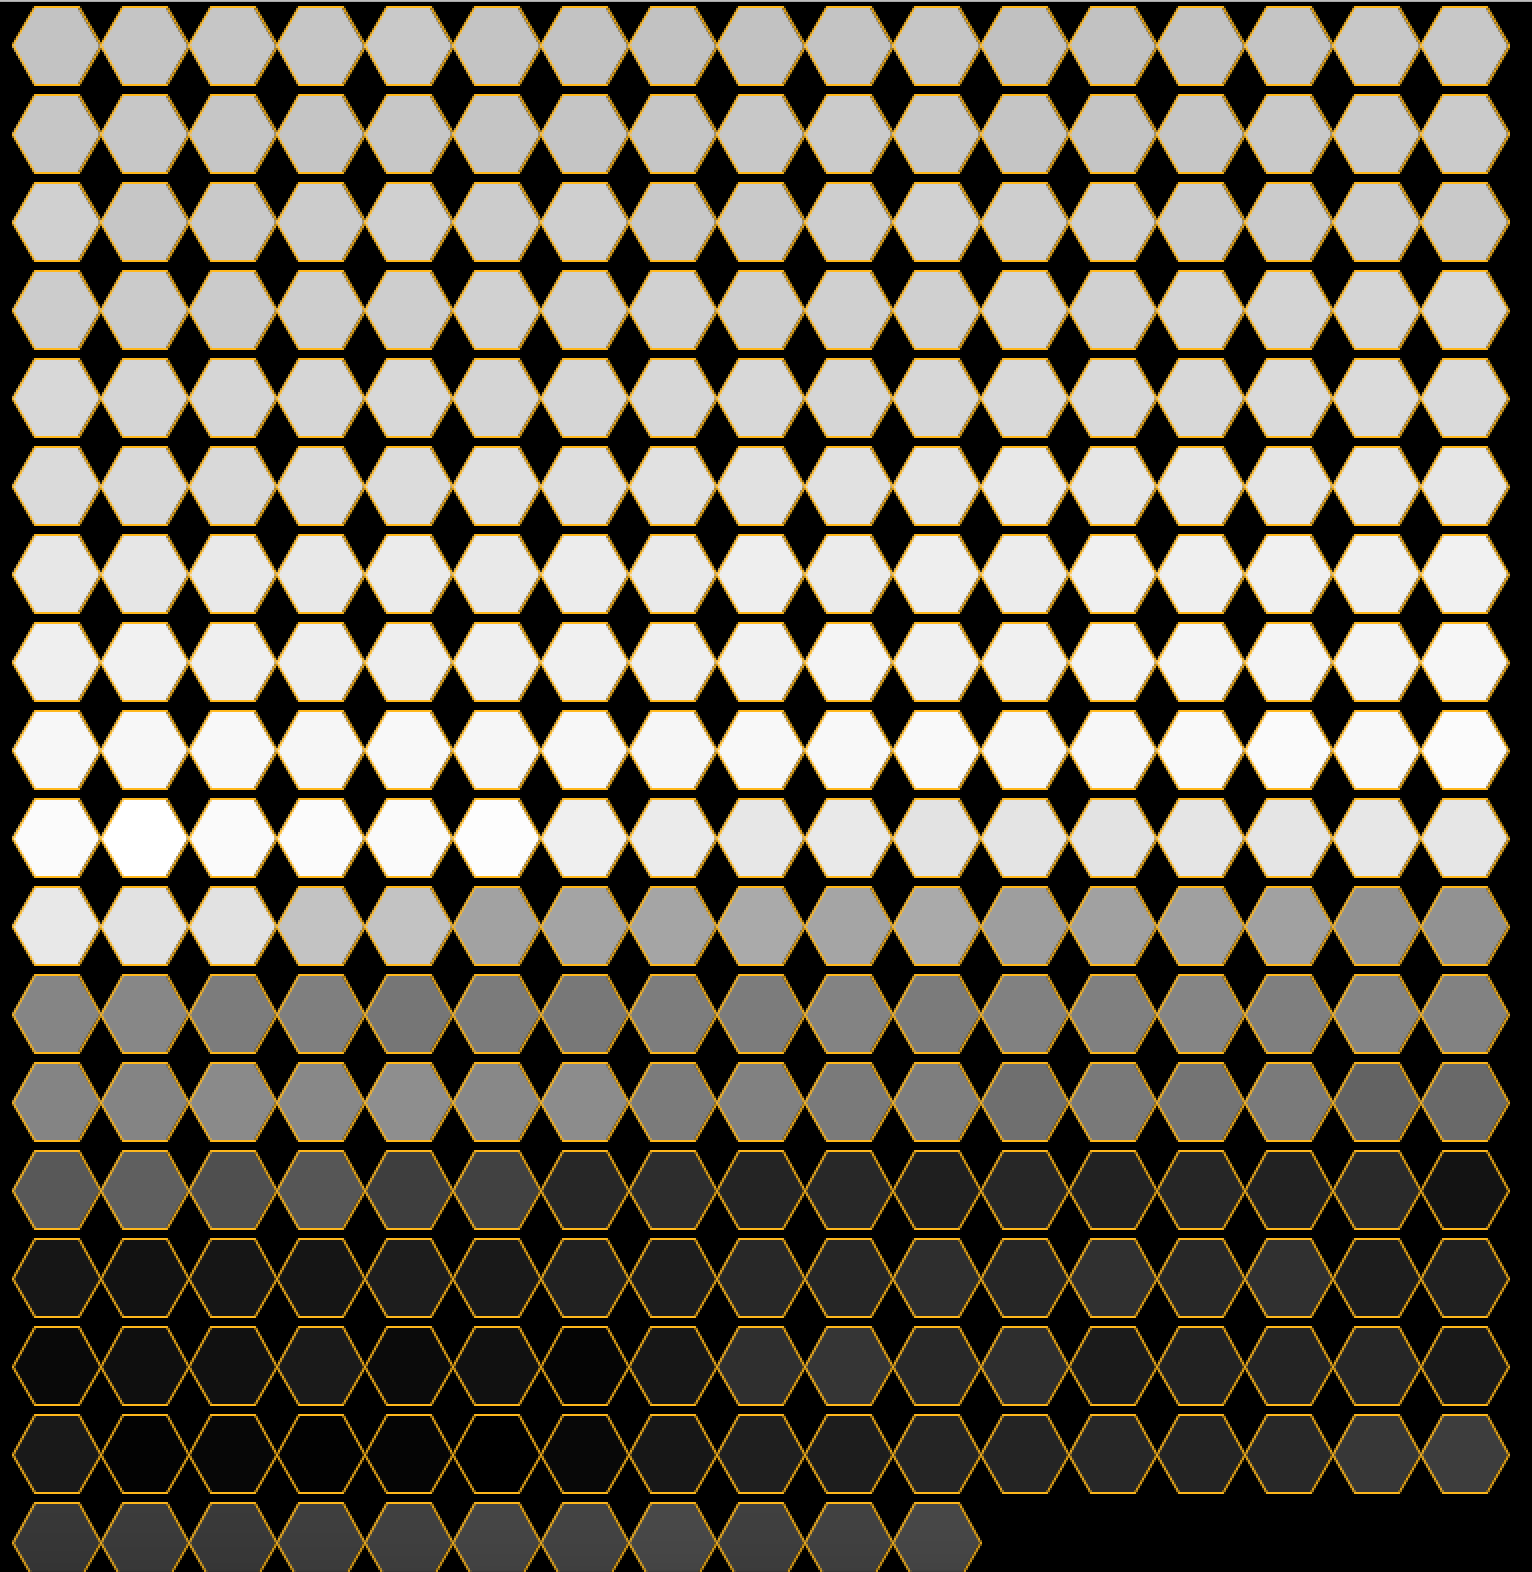
I wanted to add more things to this and so, I decided to look up some datasets related to honey and bees. That’s when I came across a Kaggle page with beehive metrics (https://www.kaggle.com/se18m502/bee-hive-metrics). I used the values from the CSV file from 2019 which measured the weight of a beehive named schwartau and I used the data over the first 5 months of 2019. I used hexagons to show the data to resemble a honeycomb. To achieve this shape, the processing documentation helped a lot. The code was kind of similar to the idea of translating polar to cartesian coordinates for a circle and so, I understood it after experimenting with it for some time. I looked at different ways of visualizing these hexagons in terms of sizes and colors and ended up with the following visual where the color represented how heavy the beehive was. I worked on this on a separate processing program.
Weight of Honeycomb over time
Finally, I combined both the programs wherein the beehive weight visualization formed the background and the word “BEE” was written on the screen. I changed the color palette and transparency of the colors. The beehive visualization had shades of yellow representing honey and it looked really cool against a black background so, I decided to finalize that palette. But the problem was that the animation of the word “Bee” wasn’t clear on-screen and so I decided to change the shape that the bee traced from a point to another hexagon and gave it a very clear shade of honey. This made it stand out.
Since the data and the hexagons were not proportional to the size of the screen, there was some empty space below. So I decided to fill it with another word and I chose the word “Happee” (rhymes with bee, bee is happy that the beehive is heavy, “be happy”). And I put this when the bee is done writing the word “BEE” on screen.
Here’s the final output –
Here’s the code –
import geomerative.*;
RFont font;
String phrase = "BEE";

RPoint[] pnts;
PFont f;
String phrase_1="HAPPEEE";

float xOffset =0;
float yOffset = 150;

int endX; //ending points of hex visual - x coordinate
int endY; //ending points of hex visual - y coordinate
int rad =22; //radius of hexagons


void setup() {
  size(800, 800);
  background(0);

  f=createFont("Courier New",64); //for text "HAPPEEE"
  textSize(32);
  textFont(f);


  RG.init(this);
  font = new RFont("OpenSansCondensed-Light.ttf", 500, RFont.LEFT);

  //setting segment length according to radius of hexagon
  RCommand.setSegmentLength(8);
  RCommand.setSegmentator(RCommand.UNIFORMLENGTH);
  RGroup grp;
  grp = font.toGroup(phrase);
  grp = grp.toPolygonGroup();
  pnts = grp.getPoints();


  xOffset = width - grp.getBottomRight().x - grp.getBottomLeft().x;
  xOffset = xOffset/2;

  //beehive weight visualization
  beeVis();

  noFill();
  stroke(255, 0, 0, 75);
}


//beehive weight visualization
void beeVis()
{
  //beehive weight over 5 months in 2019
  Table table = loadTable("weight.csv","header");

  //minimum value from table of data
  float OldMin = 61188.87528 ;

  //initial height and width of hexagon - rad is added as it is centered, otherwise a half of the hexagon would be hidden
  int h=rad;
  int w=rad+10;


  // iterate over all the rows in a table
  for (int i = 0; i < table.getRowCount(); i++) {
    TableRow row = table.getRow(i);
    float Value = row.getFloat("x");

    //getting the x values to a new range and between 0 to 255 to use for colors
    float x= ((Value -OldMin ) * (255 - 0)) / (80000 - OldMin);

    //fill color is proportional to weight of honeycomb at a given time
    fill(255,255-x,0,100);
    //hexagon has stroke color of honey
    stroke(255,184,28);
    //hexagon
    polygon(w, h,rad);
    //update width
    w+=rad*2;


   //if width is out of range, update height and width
     if((w+rad)>=800)
    {
     h+=rad*2;
     w=rad+10;
    }

  }


 //final coordinates of w and h are recorded to put the phrase "happy"
 endX=w;
 endY=h;

}

void draw() {

  background(0);
  beeVis();
  Bee bee;

  if(frameCount<pnts.length)
  {
    //bee moving
    float x = pnts[frameCount%pnts.length].x + xOffset;
    float y=pnts[frameCount%pnts.length].y + height/2 + yOffset;
    PVector p = new PVector(x, y);
    bee = new Bee(p);
    bee.display();

 //bee leaving trails of hexagons
  for (int j=0; j<frameCount%pnts.length; j++)
  {
    float x_ = pnts[j].x+ xOffset;
    float y_ = pnts[j].y+ height/2+ yOffset;
    stroke(0);
    fill(255,184,28);
    polygon(x_, y_,8);
  }
}

//once "bee" is written, "happy" will be shown and the word "bee" has a swarm like effect
else
{
  fill(255,184,28);
  text(phrase_1,endX,endY+10);


  for (int i=0; i< pnts.length; i++) {
      float swarm = (noise(frameCount*.01+i*.02)-.5)*10;
      float x = pnts[i].x + swarm + xOffset;
      float y = pnts[i].y + swarm + height/2 + yOffset;
      stroke(0);
      polygon(x, y,8);
    }

  }
}


//polygon function to make hexagon
void polygon(float x, float y, float radius) {
  float angle = TWO_PI / 6;
  beginShape();
  for (float a = 0; a < TWO_PI; a += angle) {
    float sx = x + cos(a) * radius;
    float sy = y + sin(a) * radius;
    vertex(sx, sy);
  }
  endShape(CLOSE);
}
I originally started with making a speedometer, but found this idea more fun and interactive so went along with it.
It took a lot of maths! I started with a rough circle/ellipse for a path for my text to go about. Then I created the variable “arclength” to trace the text on the the circular path. Then I iterated the arclength with each letter of the string and divided it by 2 to make it monospaced on an average.
I then created a variable theta for every angle of the letter of the string. Then through push and pop, I copied the translate and rotate coordinates of the text and pasted it again. Through mouseX function, the arc moved sideways along with the mouse.
Challenges:
There was a little math, which was a bit challenging for me. But once it worked, it was fun to interact with. Initially, I used TWO_ PI as stop 2 value in map in translate, which gave it a 2D effect being the original plan. Then by just switching it to PI, the wheel switched to being 3D and it was fun so I let it be.
Here’s the video link to the assignment:
Code:
String message;
PFont f;
float r = 300;// The radius of a circle


void setup() {
  size(800,800);
  // The message to be displayed
  message = "Steering wheel of the your car  Steering wheel of your car Steering wheel of your car Steering wheel of your car Steering wheel of your car";  //Speed of your wheels  Speed of your wheels  Speed of your wheels ";
  // The text must be centered!
  textAlign(CENTER);
  f = createFont("Serif",32);
  textFont(f);
  textSize(36);
}

void draw() {
  background(#98EAF7);

  // Start in the center and draw the circle
  translate(width / 2, height / 2);
  //noFill();
  //stroke(0);
  //ellipse(0, 0, r*2, r*2);

  // We must keep track of our position along the curve
  int arclength = 0;

  // For every letter
  for (int i = 0; i < message.length(); i++)
  {
    float w = textWidth(message.charAt(i));
    arclength += w/2;

    float theta = PI + arclength / r;

    push();
    translate(r*cos(theta + map(mouseX, 0, width, 0, PI)), r*sin(theta+map(mouseX, 0, width, 0, TWO_PI)));

    rotate(theta+PI/2 +map(mouseX, 0, width, 0, TWO_PI)); // rotation is offset by 90 degrees

    // Display the character
    fill(0);
    text(message.charAt(i),0,0);
    pop();
    // Move halfway again
    arclength += w/2;
  }
}
I wrote a code that reads from the billboard top 100 songs (not the most recent). I edit the .csv file I found online to remove redundant data that I did not need and I used the left data to draw circles at random locations for each of the top 100.
I added a small alpha value to show the layering of circles as they are random.
I had to deal with longer song names and make them wrap around.
Instead of trying to find a library that works, I decided to try to make the wrap work myself to explore and know what I can do to manipulate a string.
key:
Code:
I started with a circle class to draw each circle at a random location and depending on circle details. I added an array to save the circles.
String names[];
int ranks[];
int weeks[];
boolean arrDone[] = new boolean[100];
boolean flag = false;
int counterDone = 0;

PFont myFont;


class Circles {
  //attributes
  PVector pos ;
  int col;
  int diam;

  String text;

  // number of weeks on board gives color shade, and rank determines radius
  Circles(int weeks, int ranks, String _text) {
    pos = new PVector(random(0, width), random(0, height));
    //calculate fraction from 255
    col = int((255*weeks/87));
    text = _text;
    //max diam = 70
    diam =int((width)/ranks);
    diam = constrain(diam, 50, 500);
  }

  void draw_circle() {
    fill(0, 0, col, 200);
    //fill(255,100);
    noStroke();
    ellipse(pos.x, pos.y, diam, diam);

    // split text into lines
    String[] words = split(text, ' ' );

    writetext(words);
  }
The next function is part of the circle class, I put it here separately because it includes the code for the wrap of the text.
Here, I declared the circle’s object array and then loaded and processed the data from the .csv file.
void readData() {
  String stuff[] = loadStrings("charts.csv");
  String data[]= new String[3];
  // Convert String into an array of integers using ',' as a delimiter
  // string array is returned, which we cast to an int array
  names = new String[stuff.length];
  ranks = new int[stuff.length];
  weeks = new int[stuff.length];

  for (int i=1; i<stuff.length; i++) {
    data = split(stuff[i], ',' );

    //fill arrays with data
    ranks[i] = int(data[0]);
    names[i] = data[1];
    weeks[i] = int(data[2]);
  }
}
in the creat function here I added a boolean array to check if the song has been output on the screen or not to avoid repitition.
void create() {
  int num =  int(random(1, 99));
  boolean flag = false;
  if (arrDone[num]) {
    flag= true;
  } else {
    arrDone[num] = true;
  }

  if (!flag && count<=100) {
    // int weeks, int ranks, String _text){
    circle[count] = new Circles(weeks[num], ranks[num], names[num]);
    circle[count].draw_circle();
    count++;
  }
}
I only used the draw function for the text to appear at the beginning of the code running time. I generated the circles with mouse clicks instead to give time for the user to analyze each new circle.
void setup() {
  size(1000, 1000);
  background(200);
  readData();
}

void draw() {
  myFont = createFont("SourceCodePro-Light.ttf", 60);
  textFont(myFont);
  if (frameCount<25) {
    String textt = "Press at a random location";
    textSize(60);

    text(textt, width/2-(textWidth(textt)/2), height/2-32/2);
  }else if(frameCount<30){
    background(200);
  }

}

void mouseClicked() {
  if (frameCount>30){
    create();
  }
}
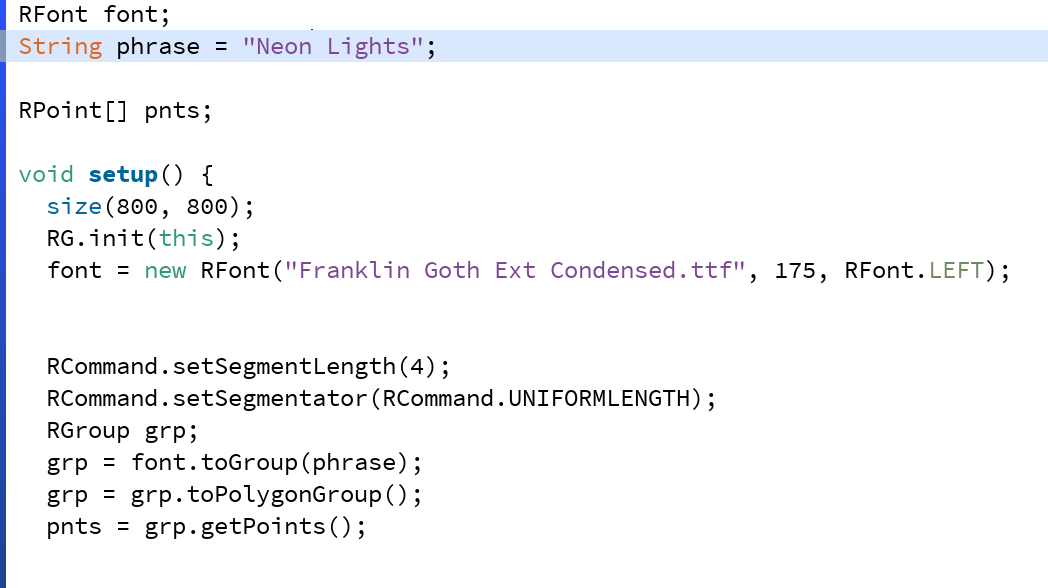
For this, weeks task I decided to try to make some sort of generative typography. My inspiration was trying to make some sort of Neon light sign.
Process:
I used the example given in class of the geomerative basic as reference to this project.And I imported geomerative and used the set code in order to trace the word “Neon Light”.
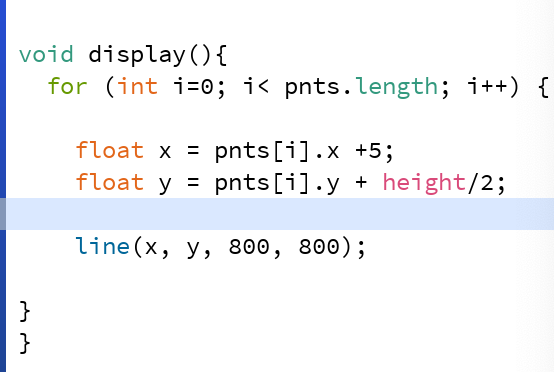
Then I started a class. I started a display function, where I used lines in a for loop in order to mimic light rays that will display the word “Neon Lights” , I added the dimensions 800,800 in order for the rays to start at the bottom of the display board.
Then I created a color change function where the lines start in a grey color as if the sign is not turned on, then used mouse events to change the color to green and pink neon colors as if the sign is turned on.
Lessons learned:
I started out wanting to make very complicated things, but in the end I decided to go with this.I think it is very simple, but is quite satisfying to look at in my opinion.
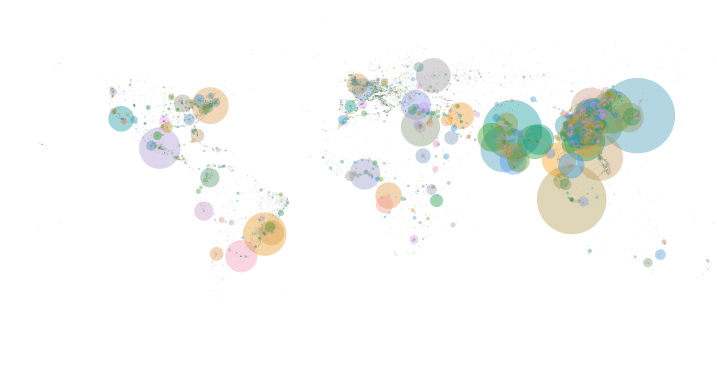
In this technologically and scientifically advanced era, there is no shortage of data of any sort, for most cases. For this production assignment, I used a online available database of the world’s cities and towns. It has been built from the ground up using authoritative sources such as the NGIA, US Geological Survey, US Census Bureau, and NASA. (https://simplemaps.com/data/world-cities)
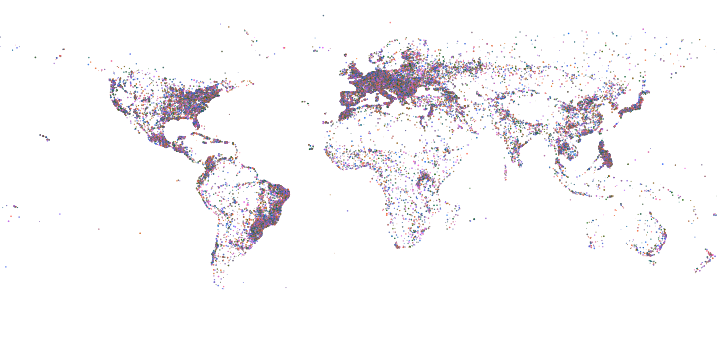
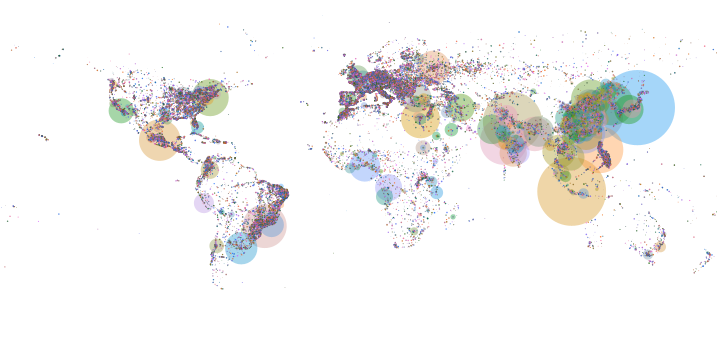
Using the information mentioned in the database about 41001 cities, I created a world map on Processing. It creates two maps: based on total population size and one solely based on location. Initially, when it loads, the user might be able to only understand it as a random placement of randomly sized circles that are a bit wobbly but when the mouse pressed the other map that marks the location of all 41001 cities, an evident world map forms.
Here’s a quick video overview
Production
Initially, I had no clue what sort of data visualization project I want to create. While randomly browsing large datasets available online, I came across this database and thought of using it to create the world map. I used the latitude and longitude values of a city to manipulate their position on the canvas in terms of y and x respectively.
For a long while, I stared at my blank screen wondering what went wrong when only a few locations would appear. It took me a lot of trial and error and maths and geography of course to understand the mapping of longitude and latitude values to cartesian values. After identifying a pattern, I formed pretty simple mathematical equations for this, and there you go, the world map appears.
To add more clarity and interactivity, I allowed the user to hold the mouse and see the whole world map. For this implementation, I created two arrays for city circle objects. Each city circle object has a Pvector to store its x and y values, its randomly decided color and transparency, and its size. The only difference in both arrays is the size of the circles. The first array that displays on canvas has size-dependent on population size (total population / 700000) and the other one has a fixed size of 1px to allow for visibility of all. The wobbly movement is achieved by using random() on the size of the circle. Additionally, the user can see both maps together by pressing the SHIFT key.
Heres the code
//global variables
CityCircle[] cities;
CityCircle[] all;
Table world_cities;
boolean together = false;


void setup(){
  size(720,360);
  frameRate(10);
  noStroke();
  loadData();
}

void draw(){
  background(255);
  for(int i=0; i<cities.length; i++){
    cities[i].display();
  }

  //appear entire world map on mouse press
  if (mousePressed){
    background(255);
    for(int i=0; i<cities.length; i++){
      all[i].display();
    }
  }

  //appear together
  if (together==true){
    for(int i=0; i<cities.length; i++){
      all[i].display();
    }
  }

  if (keyPressed && keyCode==SHIFT){
    together = true;
  }


}

void loadData(){
  //loading csv file and skipping header
  world_cities = loadTable("worldcities.csv", "header");

  //initializing the arrays
  cities = new CityCircle[world_cities.getRowCount()];
  all = new CityCircle[world_cities.getRowCount()];

  //intialize values of each city object
  for (int i = 0; i < world_cities.getRowCount(); i++) {
    TableRow row = world_cities.getRow(i);

    //Acessing the fields via their column name
    String n = row.getString("city");
    float y = row.getFloat("lat");
    float x = row.getFloat("lng");
    float s = row.getFloat("population");

    // Make a Circle object out of the data read
    PVector p = new PVector(360 + x*2,180-y*2);
    //colour for first array
    color c = color(random(255),150,random(255),100);
    cities[i] = new CityCircle(p,n,s/500000,c);
    //color for second array
    color c2= color(random(255),100,random(255),200);
    all[i] = new CityCircle(p,n,1,c2);
  }

}

//Object class
class CityCircle{
  PVector position;
  String name;
  float size;
  color colour;

  CityCircle(PVector p, String n, float s, color c){
    position = p;
    name = n;
    size = s;
    colour = c;
  }

  void display(){
    fill(colour);
    circle(position.x,position.y,random(size-.75,size+.75));
  }

}
For this week’s task, I reused some modified code from the previous week’s task. I tried to make some sort of data visualization that compares the popularity of google searches on some celebrities’ names before their death and on the month of their death. I originally planned to take the mean of all months prior to their death, but I realized that would result in very low values consistently. I decided to consider only the highest month prior to their death and the month of their death. This resulted in some variety in the data. Below is a video of the visualization:
Whenever the mouse cursor hovers over one of the sections, that section displays the data on the month of death. Otherwise, the data prior to death is always displayed.
Challenges:
My PC randomly shut down twice while working on my code. I forgot to save my code on both times. Saving code periodically is a good habit.
Wait, is Wade Boggs dead?
No, interestingly though, the frequency of google searches on his name was highest the month this episode was released.