
Overview:
This week our task was to either make some sort of word art or create a data visualization. Pursing the latter, I decided the most relevant data that is out there right now is information relating to COVID-19. My goal was to create a color valued map, the most intuitive data visualization in my mind.
Process:
The trickiest part in my opinion was creating the map itself. To create shapes which could colored in processing I would have to create a shape through a series of points. At first I considered loading a map and the pixel values of the boarders by hand but I quickly realized how time consuming and inaccurate this would be when considering features such as rivers. I had a look at an SVG picture of the US and realized that to render the vector based image all the coordinates were already stored there by state. I then had to create a reader to take in this SVG path data, and convert this information to processing equivalents. I found what each svg command meant, C, L, M, z, and translated those into Processing shape functions.
With each path stored in a custom State object. I could easily draw a shape with a simple function call, and set the fill of it with a method.
I then had to take in my COVID data from the CDC, and process it to each state. Using the state codes that the data is associated with, I stored the respective data with the respective state in a table. This way when the state is drawn, it could easily find a value for a certain data point such as total cases.
With the data stored, I had to map it to a fill color. To do so I found the max value and min value of each type of data by iterating through the states. I then mapped a HSB saturation value from the min to the max. This gave me a range of colors from white to red, with the darkest red being the highest values.
I then used the min and max values and color mapping to create a scale that displayed is there was null data points, the min color, the max color, and the third and two third colors and their respective values. This gives viewers a sense of severity.
I then made this interactive where the right and left arrow keys allow users to toggle between data types such as deaths, cases, etc.
Results:
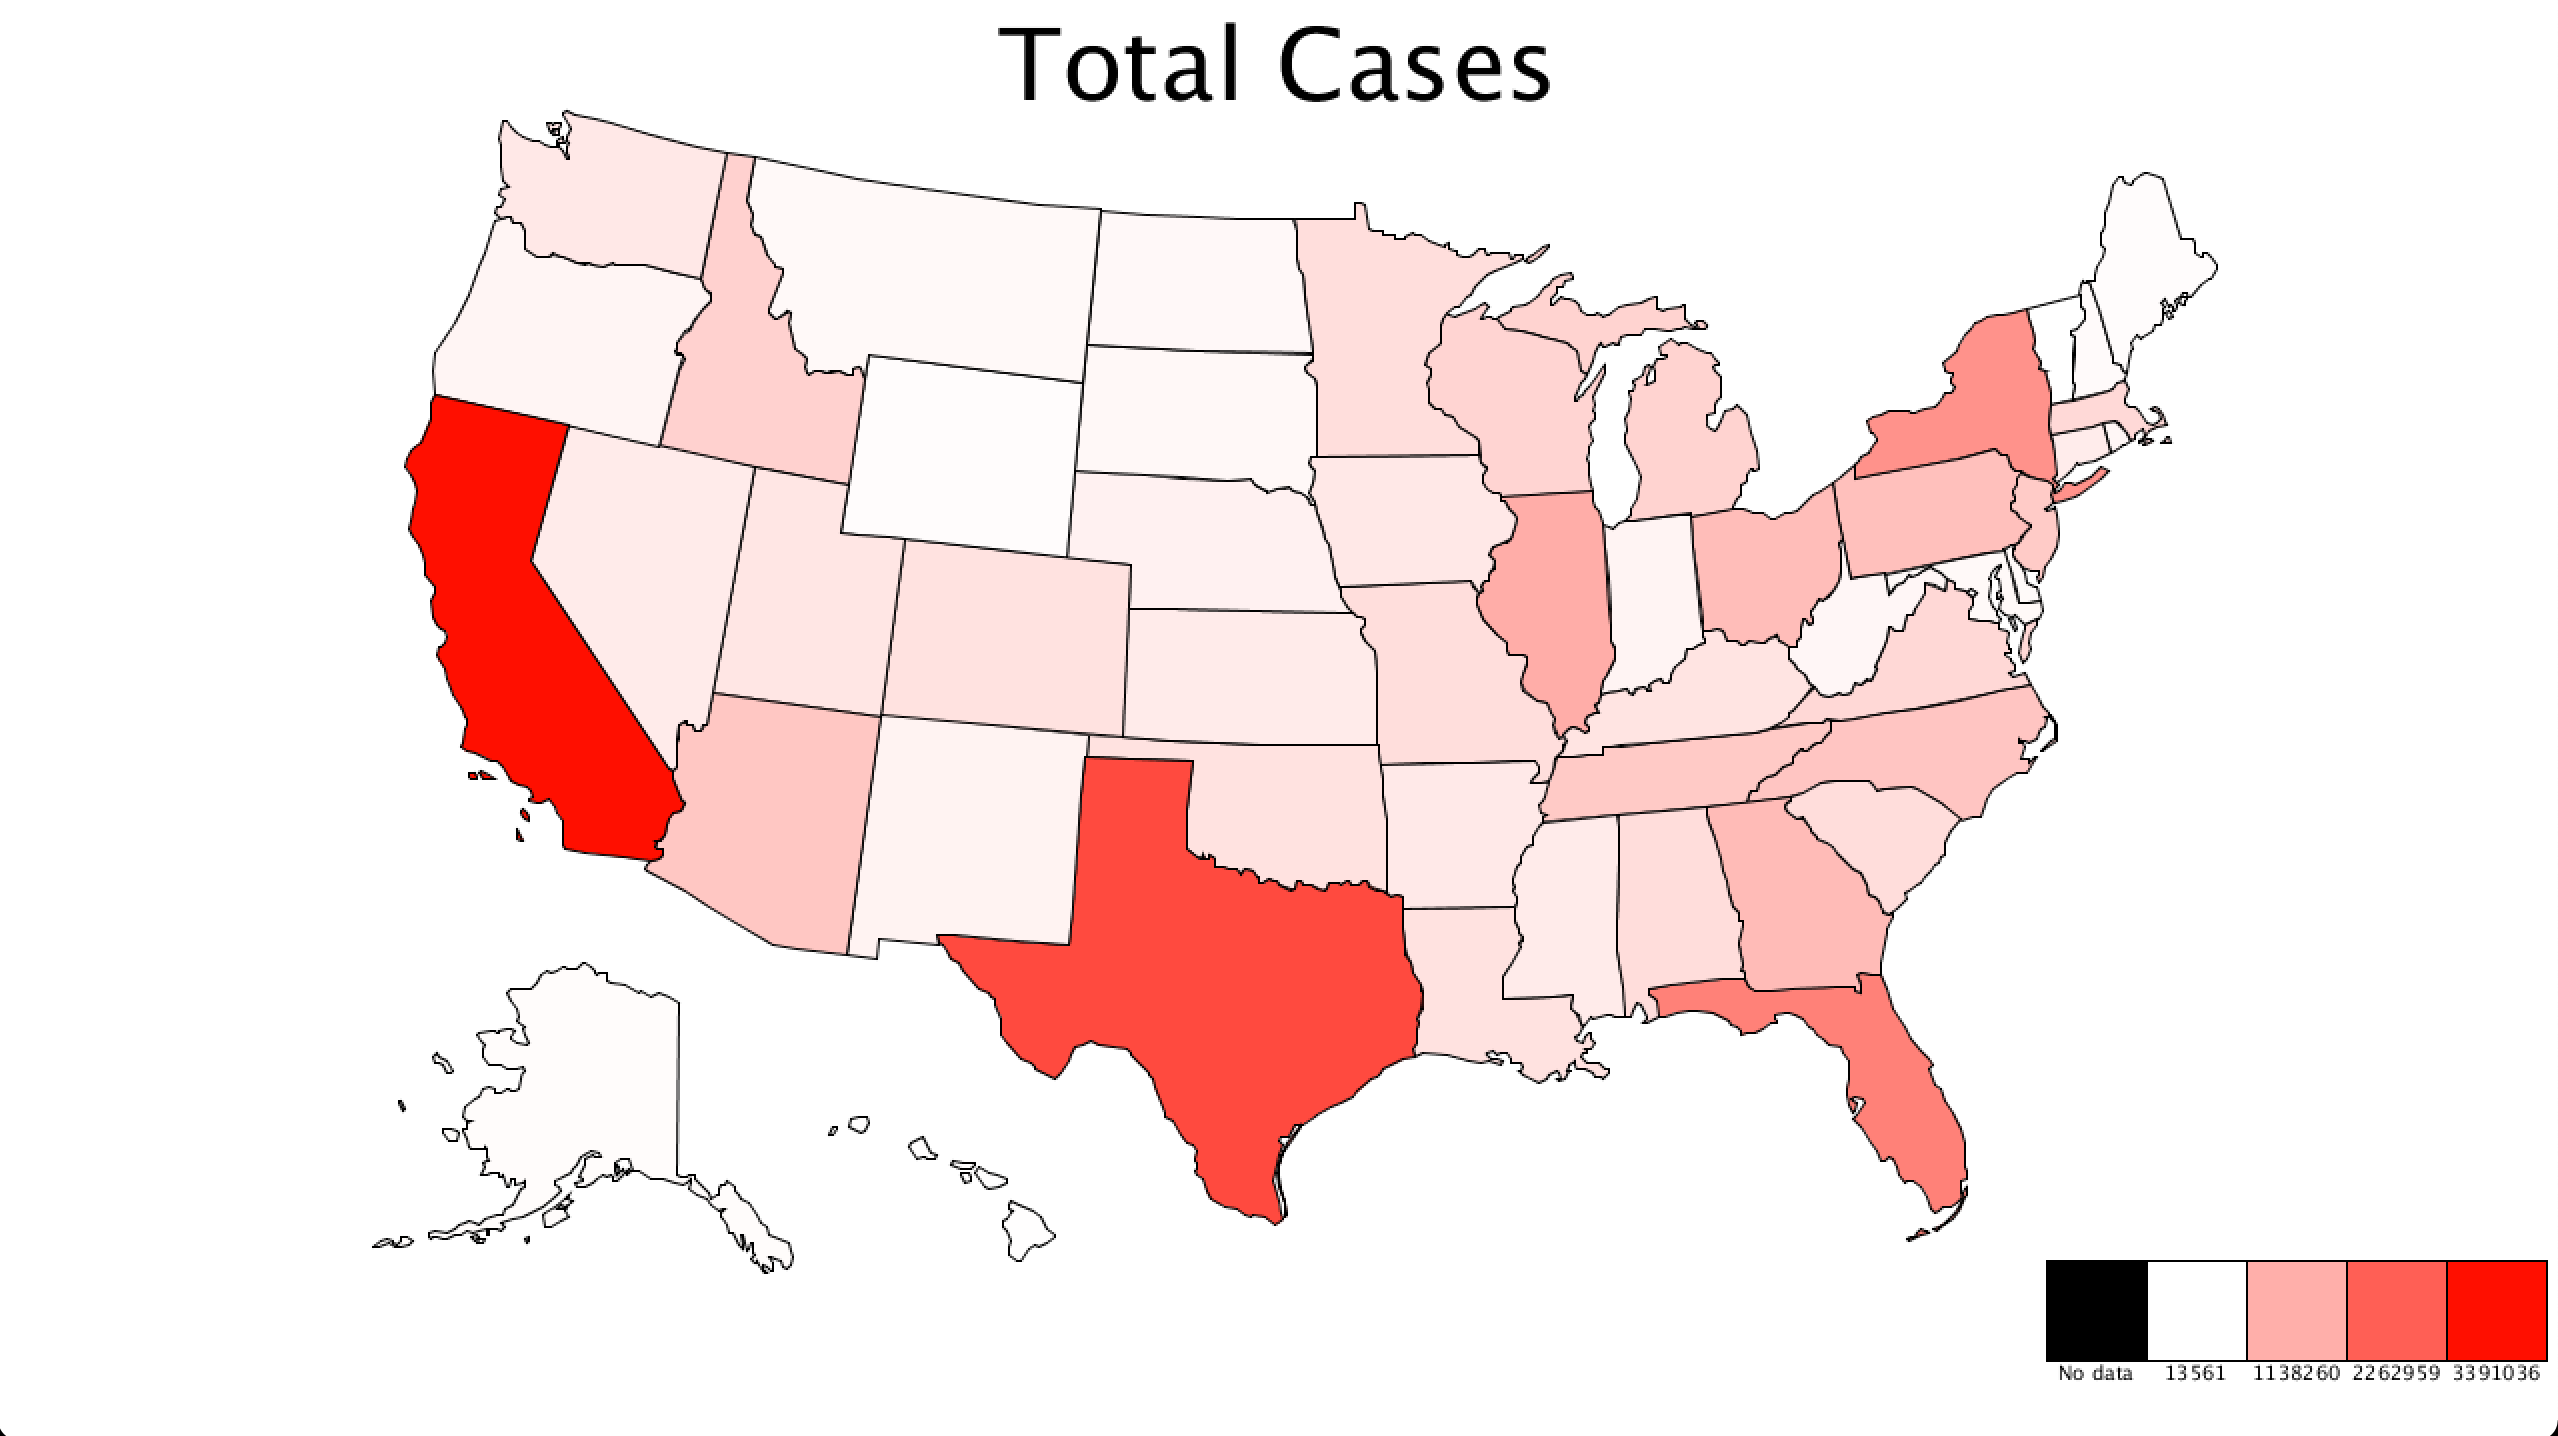
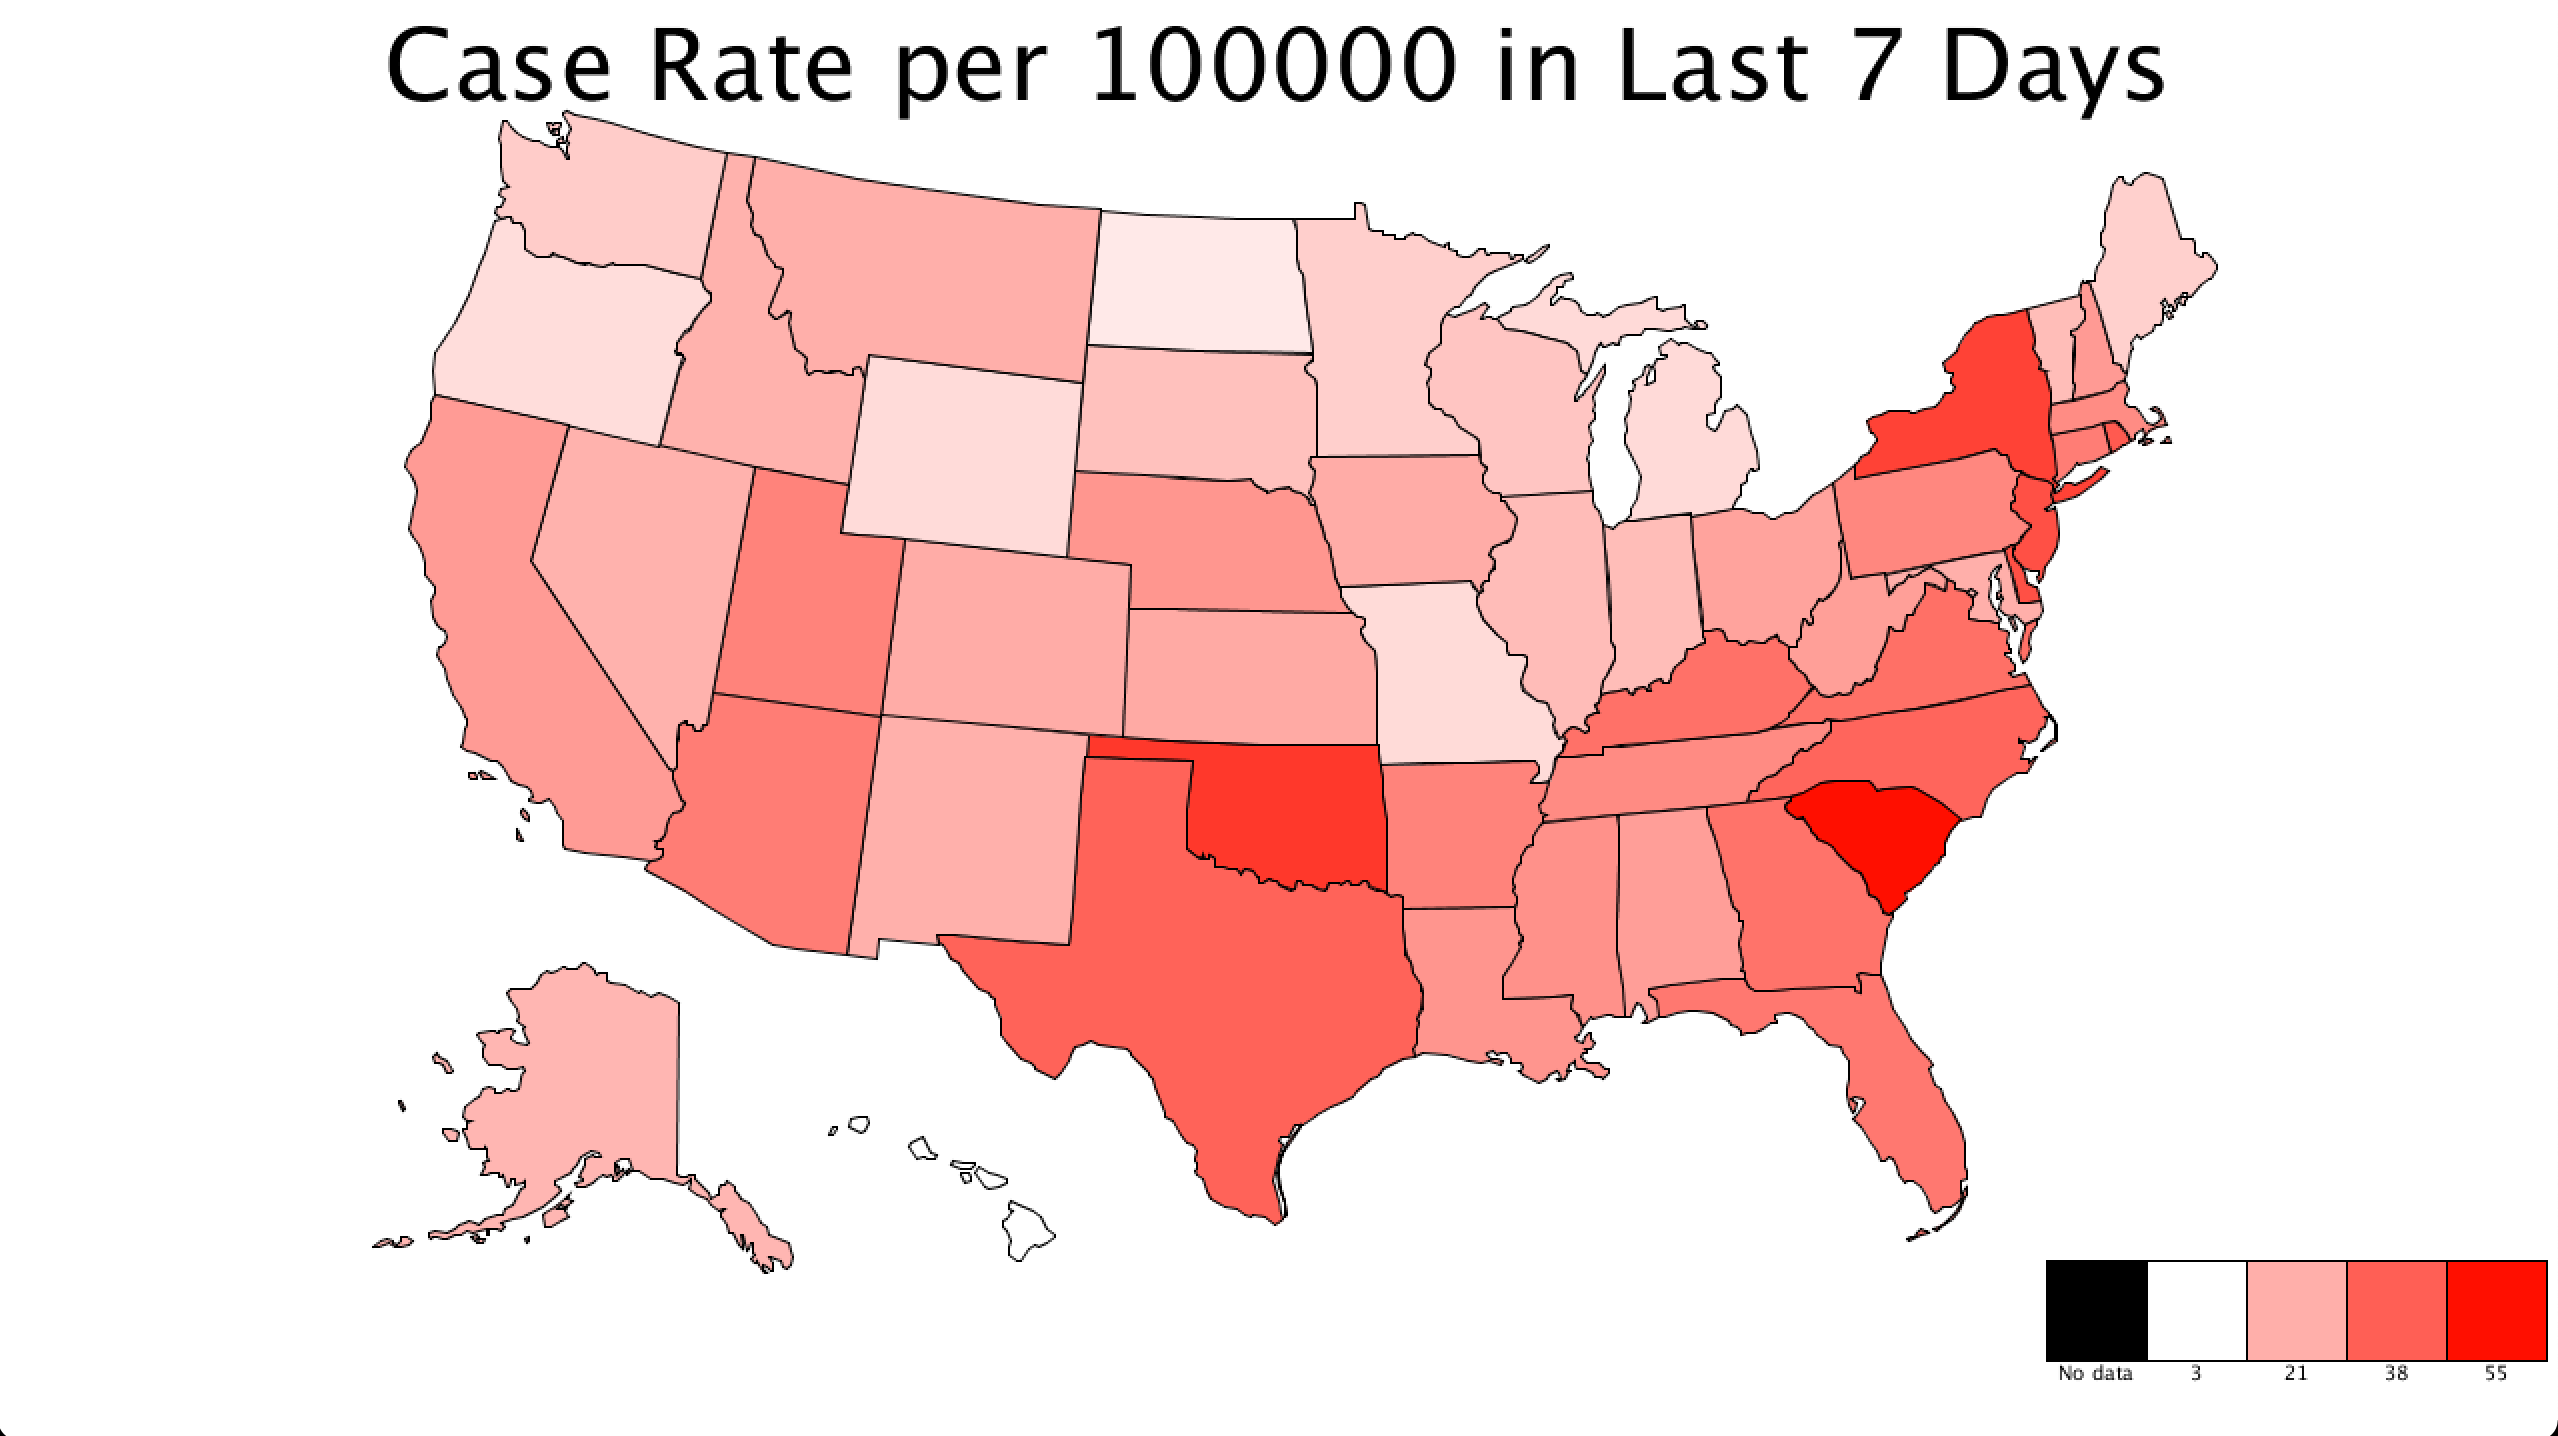
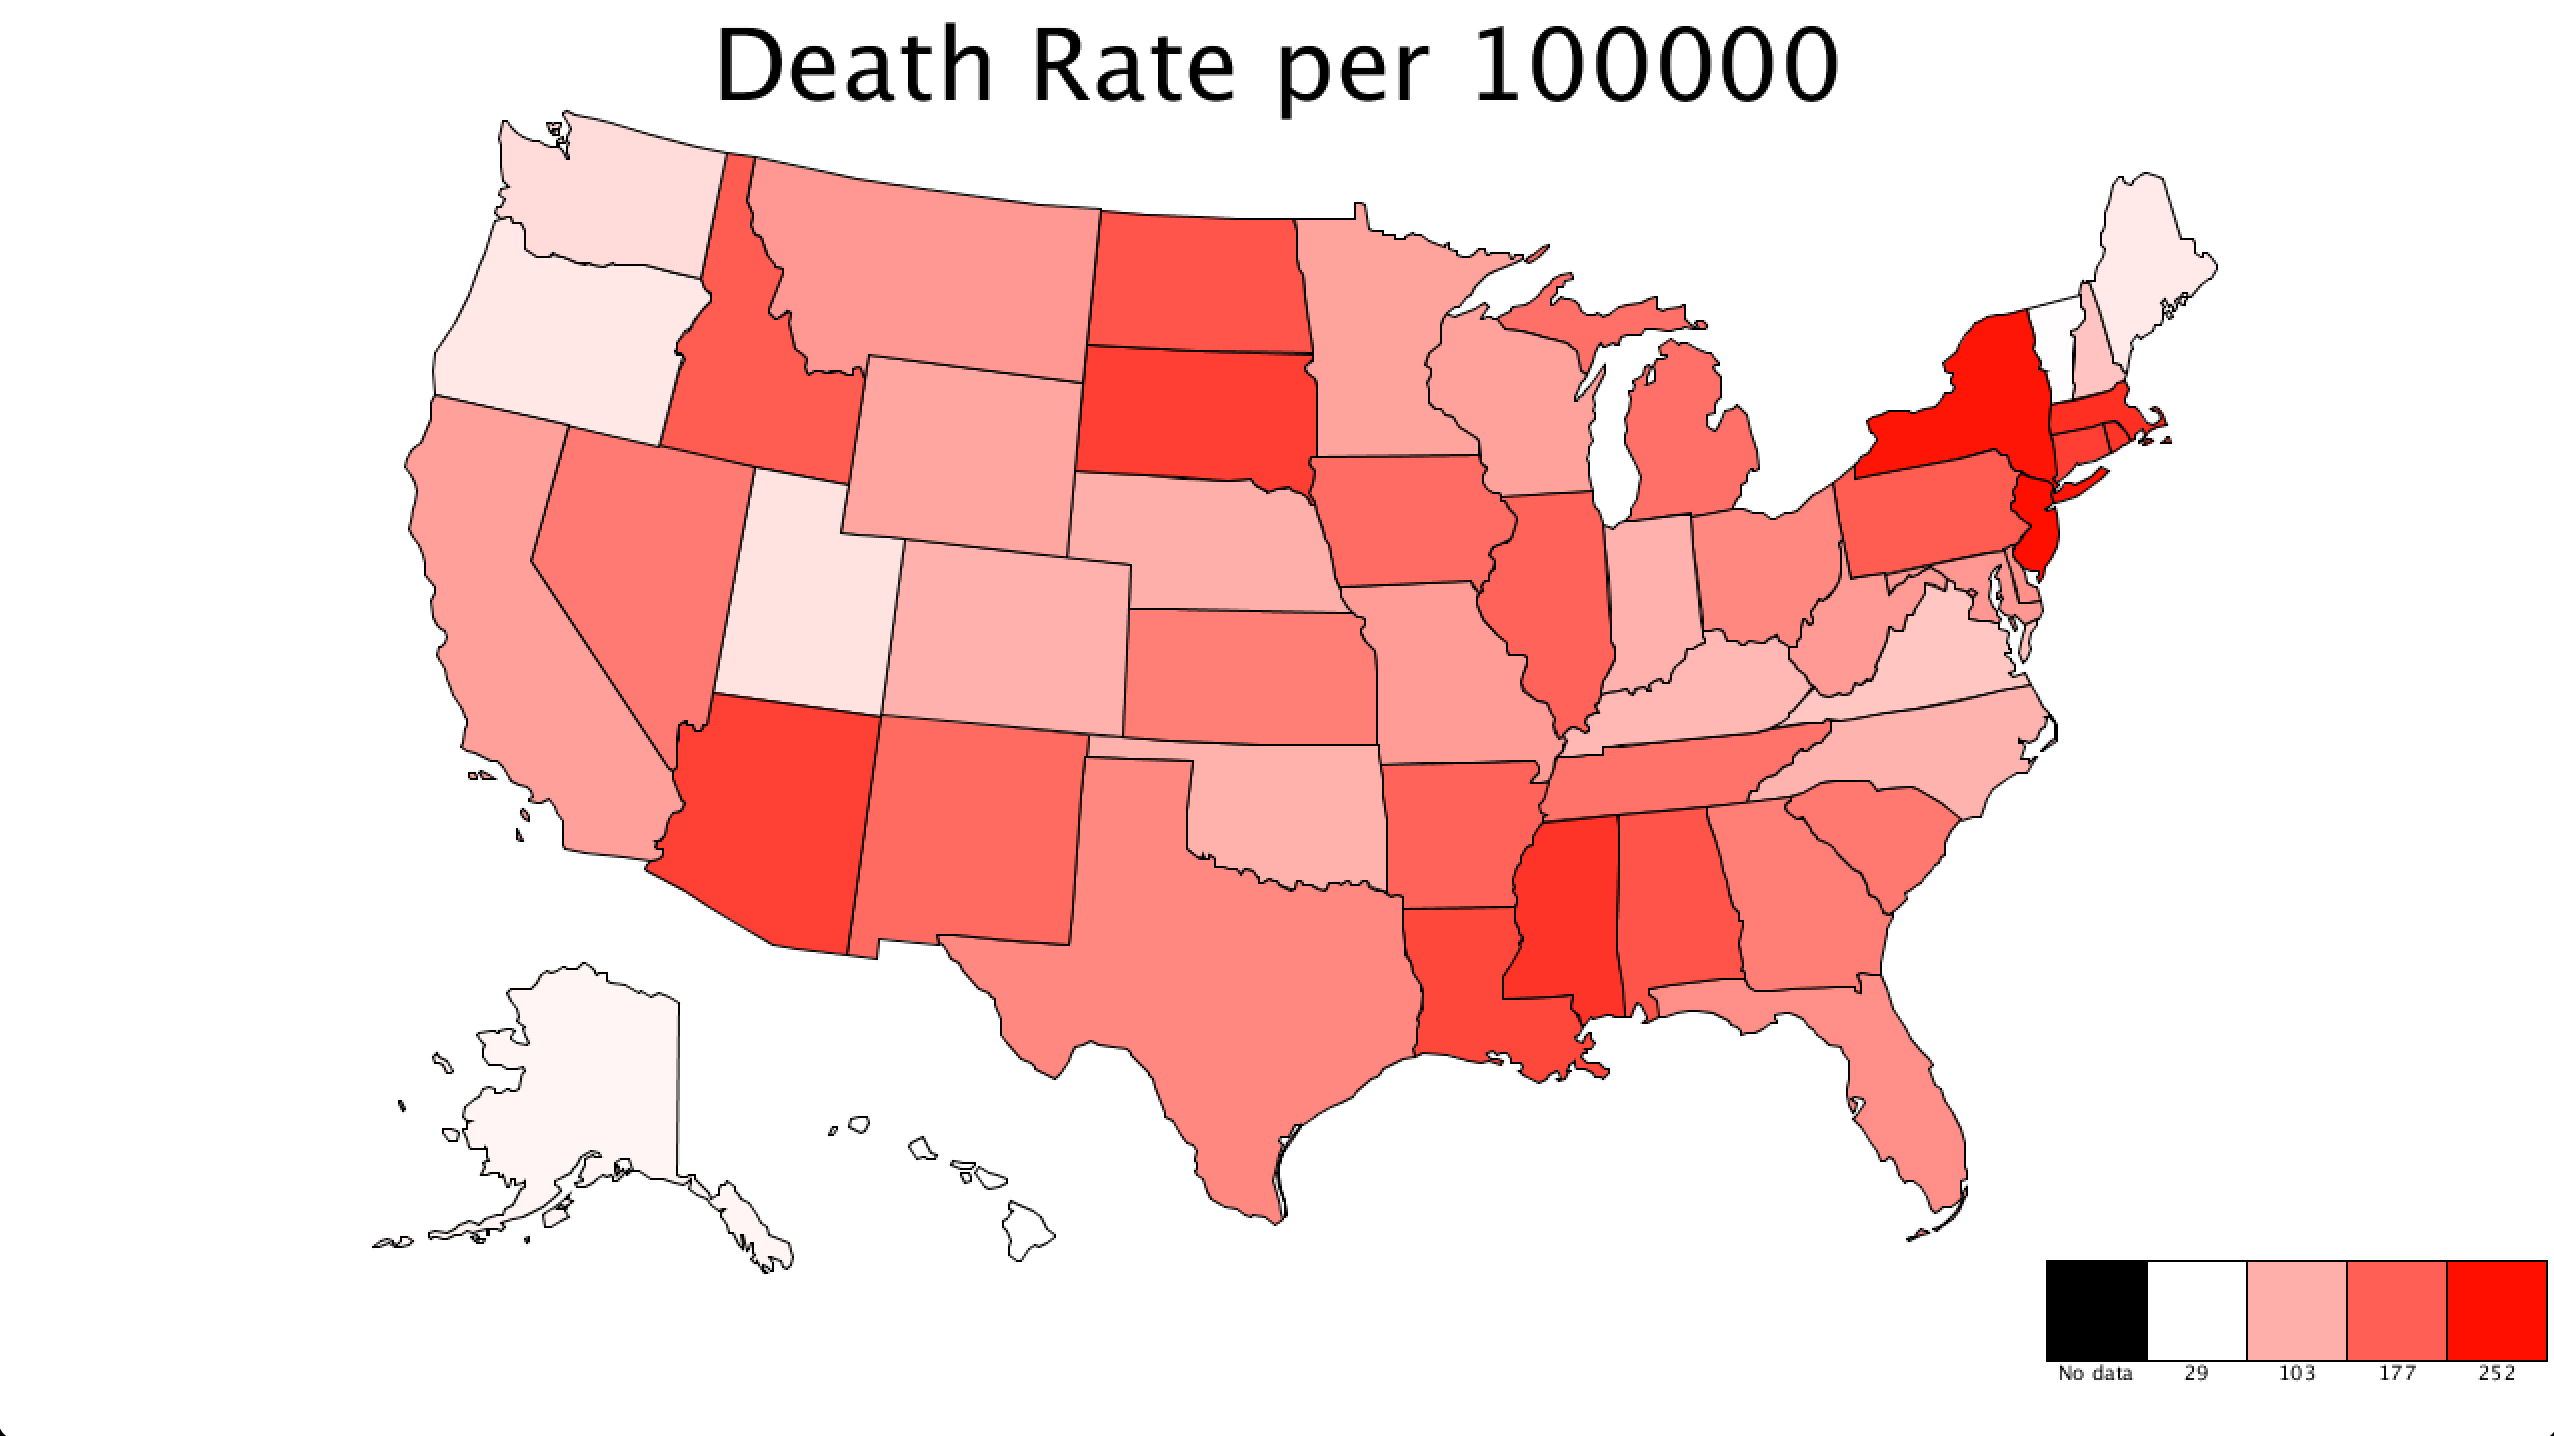
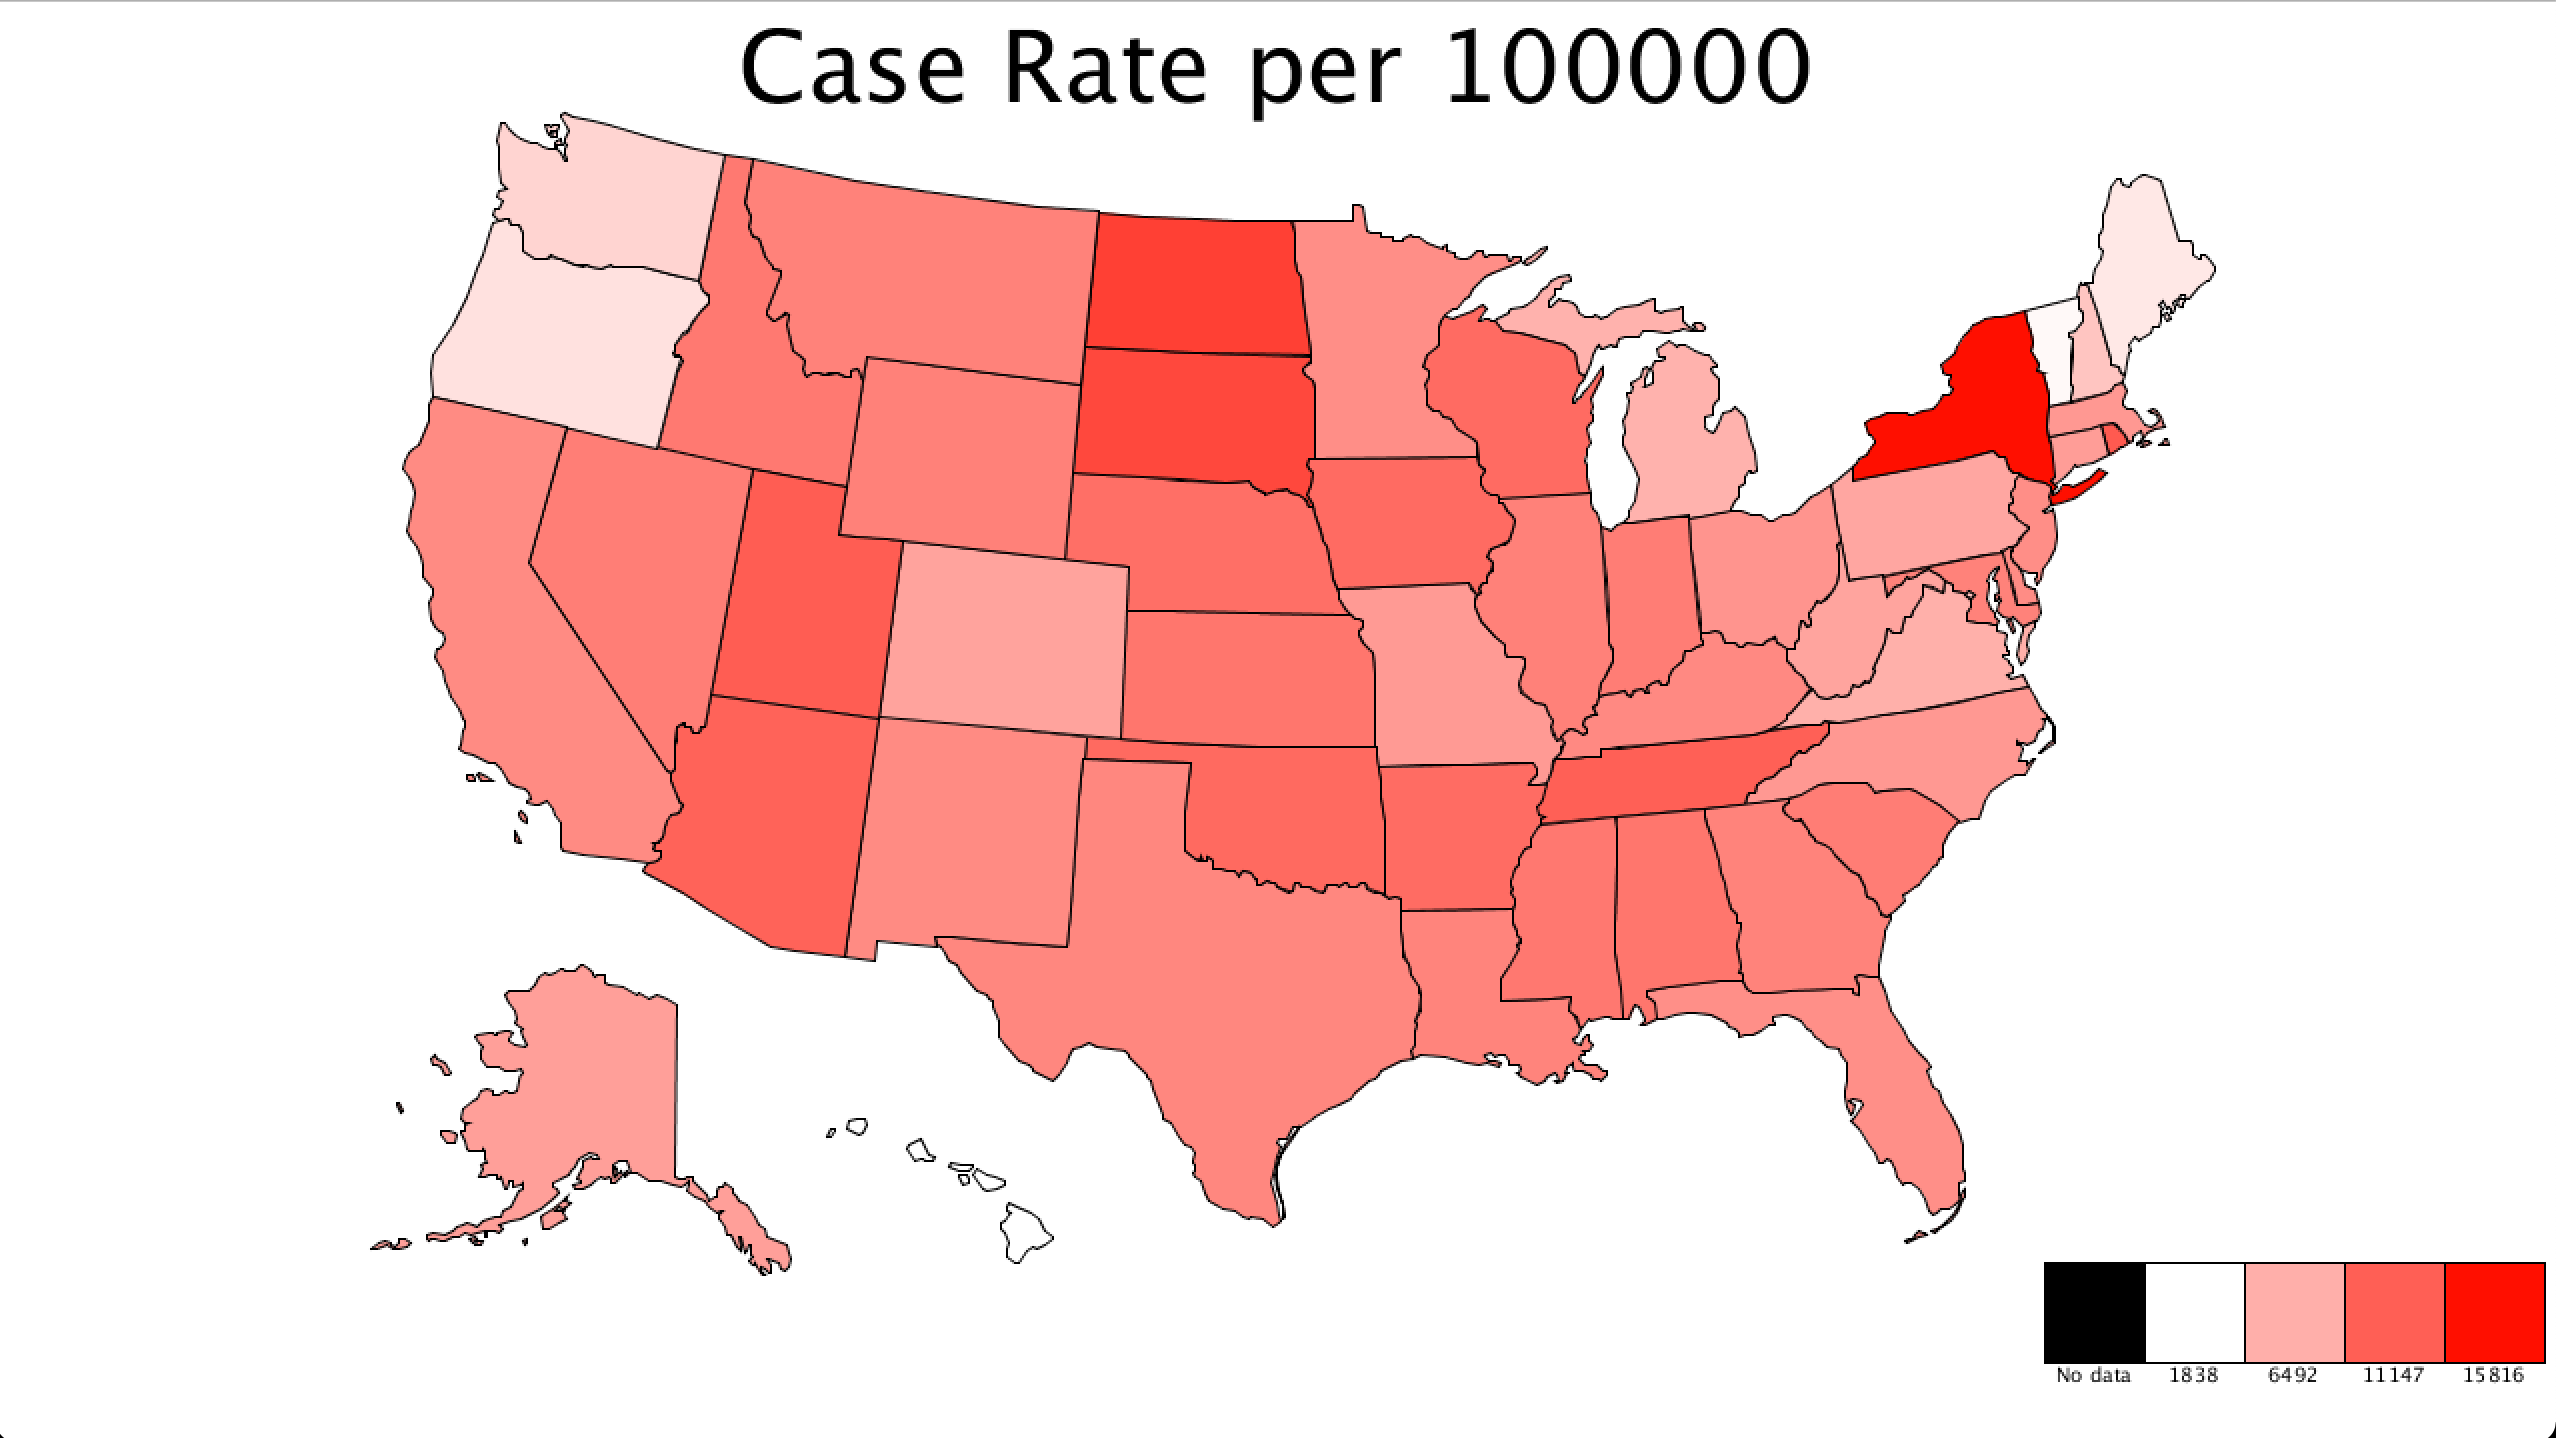
Here is my code and screenshots of the resulting maps.

//Variables for laoding state data file
String[] lines;  //Used to process svg file

ArrayList<State> stateArray = new ArrayList<State>(); //Holds all states
ArrayList<Data> dataArray = new ArrayList<Data>();  //Holds data for states

int col = 0;  //Which col of the dataArray is being shown

int xOffset, yOffset;

void setup() {
  size(1280, 720);
  lines = loadStrings("mapData.txt");
  loadStateData();
  loadCovidData();
  colorMode(HSB, 100);
}

void loadStateData() {
  int index = 0;
  //Loop through states
  while (index < lines.length) {
    int stringIndex = 0;
    String[] words = split(lines[index], ' ');  //Split each cord or
    State newState = new State(words[stringIndex]);
    stringIndex++;
    //Loop through data and save into the state's table
    while (stringIndex < words.length) {
      //See what the command is
      if (words[stringIndex].equals("M")) {
        String[] points = split(words[stringIndex+1], ',');
        newState.saveSVGData(words[stringIndex], float(points[0]), float(points[1]));
        stringIndex += 2;   //For command and point pair
      }
      else if (words[stringIndex].equals("L")) {
        String[] points = split(words[stringIndex+1], ',');
        newState.saveSVGData(words[stringIndex], float(points[0]), float(points[1]));
        stringIndex += 2;   //For command and point pair
      }
      else if (words[stringIndex].equals("C")) {
        String[] pointOne = split(words[stringIndex+1], ',');
        String[] pointTwo = split(words[stringIndex+2], ',');
        String[] pointThree = split(words[stringIndex+3], ',');
        newState.saveSVGData(words[stringIndex], float(pointOne[0]), float(pointOne[1]), float(pointTwo[0]), float(pointTwo[1]), float(pointThree[0]), float(pointThree[1]));
        stringIndex += 4;   //For command and 3 point pairs
      }
      else if (words[stringIndex].equals("z")) {
        newState.saveSVGData(words[stringIndex]);
        stringIndex += 1;   //For command and point pair
      }
      else {
        stringIndex++;
        println("Error loading data");
      }
    }
    stateArray.add(newState);
    index++;
  }

  //Move US to center of screen (hardcoded cause translate doesnt work)
  xOffset = width/7;
  yOffset = height/15;
}

void loadCovidData() {
  // Load CSV file into a Table objects
  Table covidTable = new Table();
  covidTable = loadTable("united_states_covid19_cases_and_deaths_by_state.csv", "csv");
  //Loop through data columns
  for (int j = 1; j < 13; j++) {
    Table subTable = new Table();
    subTable.addColumn("State");
    subTable.addColumn("Data");
    //Loop through all states
    for (int i = 1; i < covidTable.getRowCount(); i++) {
      TableRow newRow = subTable.addRow();
      newRow.setString("State", covidTable.getRow(i).getString(0));
      //Check for no data points
      if (covidTable.getRow(i).getString(j).equals("null") || covidTable.getRow(i).getFloat(j) == 0) {
        newRow.setFloat("Data", -1);
      }
      else {
        newRow.setFloat("Data", covidTable.getRow(i).getFloat(j));
      }
    }
    Data newDataPoint = new Data(covidTable.getRow(0).getString(j), subTable);  //Create new datapoint
    dataArray.add(newDataPoint);
  }
}

void draw() {
  background(0, 0, 100);
  //Draw states
  for (State state : stateArray) {
    float stateData = dataArray.get(col).returnData(state.getState());
    color stateColor = dataArray.get(col).returnColor(stateData);
    state.drawState(xOffset, yOffset, stateColor);
  }

  //Write title
  textAlign(CENTER);
  fill(0);
  textSize(50);
  text(dataArray.get(col).getHeader(), width/2, 50);

  //Draw scale
  dataArray.get(col).drawScale(width - width/5,height - height/8);
}


//Change what data is being displayed
void keyPressed() {
  if (keyCode == LEFT) {
    if (col == 0) {
      col = 11;
    }
    else {
      col--;
    }
  }
  if (keyCode == RIGHT) {
    col = (col+1)%12;
  }
}
class Data {
  String header;  //What is the data of
  Table dataTable;  //Table of the data values with the state identifier
  float min = -1;
  float max = -1;  //min and max val variables
  int scaleWidth = 50;  //how wide is the scale
  int hue = 1;  //HSB hue value, 0-100

  Data(String header, Table data) {
    this.header = header; //Data type
    dataTable = data;

    //Find max, min
    for (int i = 0; i < dataTable.getRowCount(); i++) {
      //If Max
      if (max == -1 || dataTable.getFloat(i, "Data") > max) {
        max = dataTable.getFloat(i, "Data");
      }
      //If min
      if (min == -1 || dataTable.getFloat(i, "Data") < min) {
        min = dataTable.getFloat(i, "Data");
      }
    }
  }

  //Returns float associated with state
  float returnData(String state) {
    return dataTable.matchRow(state, "State").getFloat("Data");
  }
  String getHeader() {
    return header;
  }
  //Return the mapped color
  color returnColor(float data) {
    //If no data
    if (data == -1) {
      colorMode(HSB, 100);
      return color(100, 100, 0);
    } else {
      colorMode(HSB, 100);
      float s = map(data, min, max, 0, 100);
      return color(hue, s, 100);
    }
  }

  //Draw the scale being used
  void drawScale(int x, int y) {
    colorMode(HSB, 100);
    //Draw null data
    fill(color(100, 100, 0));
    rect(x, y, scaleWidth, scaleWidth);
    //Draw min
    fill(returnColor(min));
    rect(x+scaleWidth, y, scaleWidth, scaleWidth);
    //Draw 1/3
    fill(returnColor(min+((max-min) * 0.333)));
    rect(x+scaleWidth*2, y, scaleWidth, scaleWidth);
    //Draw 2/3
    fill(returnColor(min+((max-min) * 0.666)));
    rect(x+scaleWidth*3, y, scaleWidth, scaleWidth);
    //Draw max
    fill(returnColor(max));
    rect(x+scaleWidth*4, y, scaleWidth, scaleWidth);

    //Text
    fill(color(100, 100, 0));
    textAlign(CENTER);
    textSize(10);
    text("No data", x+(scaleWidth/2), y + (1.2 * scaleWidth));
    text(int(min), x+(scaleWidth*1)+(scaleWidth/2), y + (1.2 * scaleWidth));
    text(int(min+((max-min) * 0.333)), x+(scaleWidth*2)+(scaleWidth/2), y + (1.2 * scaleWidth));
    text(int(min+((max-min) * 0.666)), x+(scaleWidth*3)+(scaleWidth/2), y + (1.2 * scaleWidth));
    text(int(max), x+(scaleWidth*4)+(scaleWidth/2), y + (1.2 * scaleWidth));
  }
}
class State {
  String code;  //2 Character code to identify state
  Table data = new Table();  //Table of svg command at points

  //Default constructor
  State() {
    code = "";

    //Populate table columns
    data.addColumn("Command");
    data.addColumn("x1");
    data.addColumn("y1");
    data.addColumn("x2");
    data.addColumn("y2");
    data.addColumn("x3");
    data.addColumn("y3");
  }
  State(String code) {
    this.code = code;

    //Populate table columns
    data.addColumn("Command");
    data.addColumn("x1");
    data.addColumn("y1");
    data.addColumn("x2");
    data.addColumn("y2");
    data.addColumn("x3");
    data.addColumn("y3");
  }

  //Getter and setter for state code
  String getCode() {
    return code;
  }
  void setCode(String code) {
    this.code = code;
  }

  //Passed a stiring with an SVG command and series of points, processes them into the table, three methods store different amound of cords
  void saveSVGData(String command) {
    TableRow newRow = data.addRow();
    newRow.setString("Command", command);
  }
  void saveSVGData(String command, float x1, float y1) {
    TableRow newRow = data.addRow();
    newRow.setString("Command", command);
    newRow.setFloat("x1", x1);
    newRow.setFloat("y1", y1);
  }
  void saveSVGData(String command, float x1, float y1, float x2, float y2) {
    TableRow newRow = data.addRow();
    newRow.setString("Command", command);
    newRow.setFloat("x1", x1);
    newRow.setFloat("y1", y1);
    newRow.setFloat("x2", x2);
    newRow.setFloat("y2", y2);
  }
  void saveSVGData(String command, float x1, float y1, float x2, float y2, float x3, float y3) {
    TableRow newRow = data.addRow();
    newRow.setString("Command", command);
    newRow.setFloat("x1", x1);
    newRow.setFloat("y1", y1);
    newRow.setFloat("x2", x2);
    newRow.setFloat("y2", y2);
    newRow.setFloat("x3", x3);
    newRow.setFloat("y3", y3);
  }

  //Draw state from given SVG path data
  void drawState(int xOffset, int yOffset, color fillColor) {
    fill(fillColor);
    //Iterate through data table and draw shape based on symbols.
    for (TableRow row : data.rows()) {
      //Get command
      //Move
      if(row.getString("Command").equals("M")){
        beginShape();
        vertex(row.getFloat("x1")+xOffset, row.getFloat("y1")+yOffset);
      }
      //Line
      else if(row.getString("Command").equals("L")){
        vertex(row.getFloat("x1")+xOffset, row.getFloat("y1")+yOffset);
      }
      //Bezier Curve
      else if(row.getString("Command").equals("C")){
        bezierVertex(row.getFloat("x1")+xOffset, row.getFloat("y1")+yOffset, row.getFloat("x2")+xOffset, row.getFloat("y2")+yOffset, row.getFloat("x3")+xOffset, row.getFloat("y3")+yOffset);
      }
      //End shape
      else if(row.getString("Command").equals("z")){
        endShape();
      }
    }
  }

  //getter for state name, no setter as wont change
  String getState(){
    return code;
  }

}
Data Distortion / Misrepresentation:
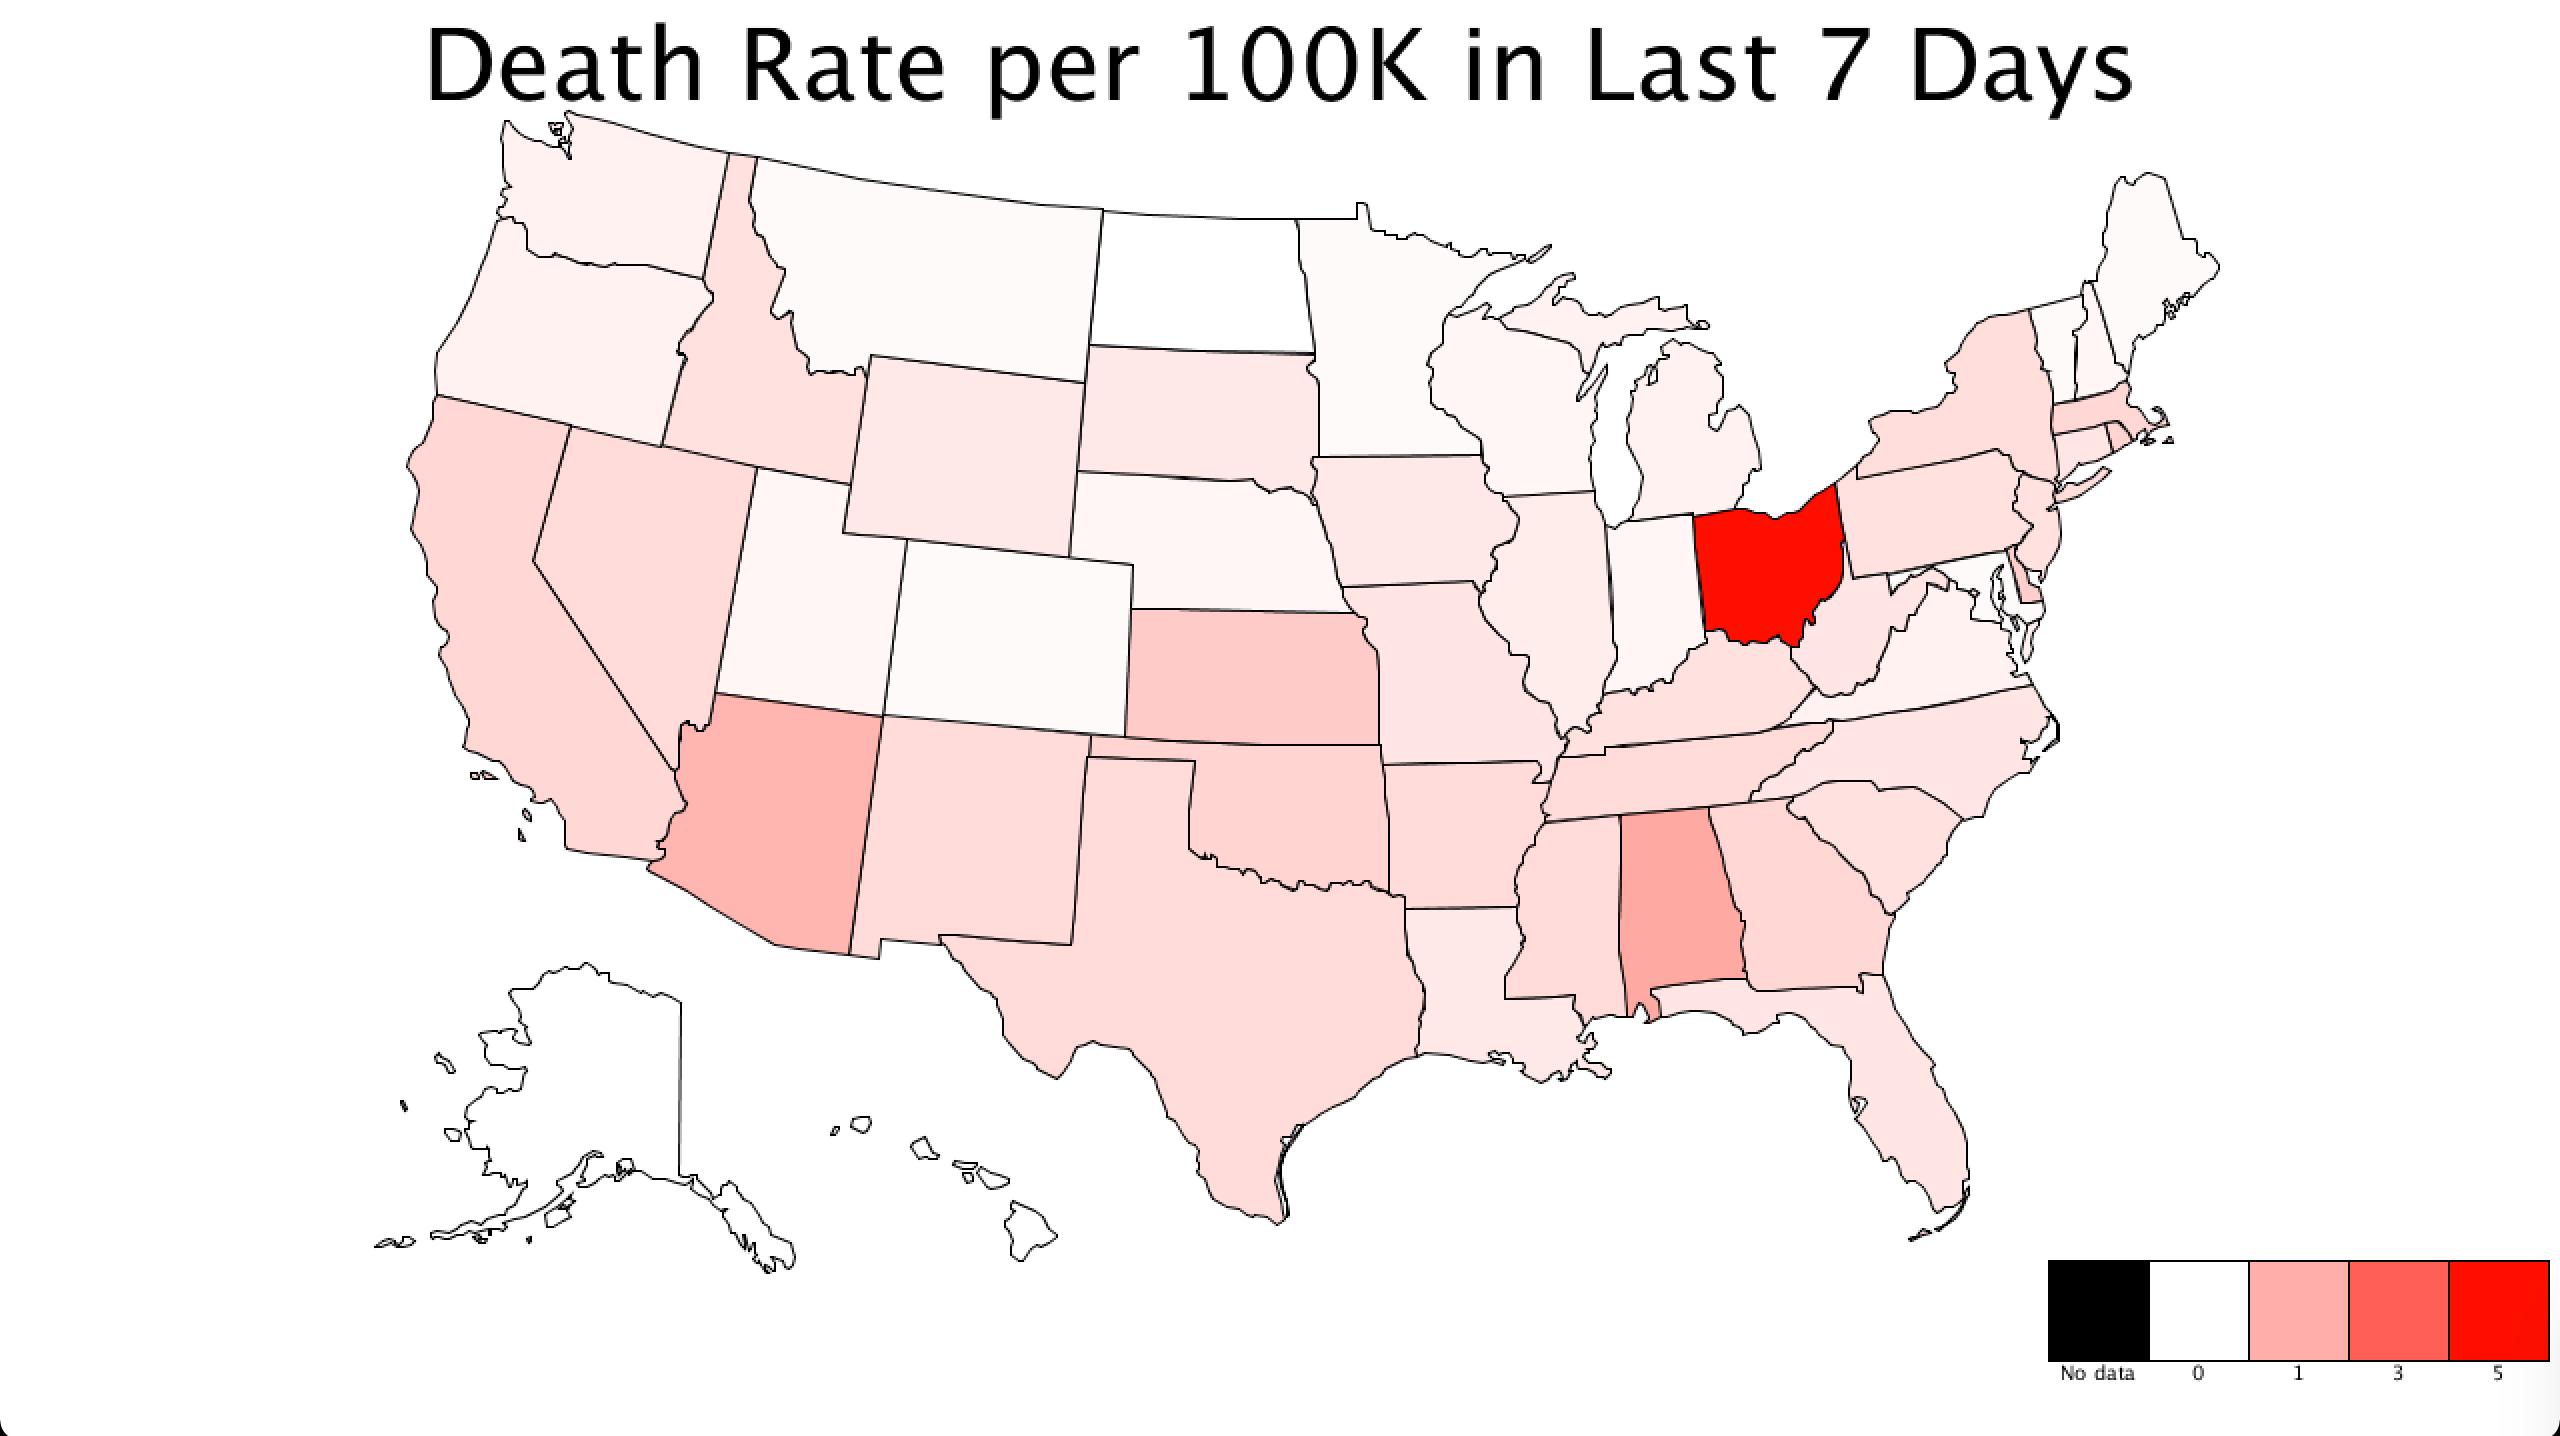
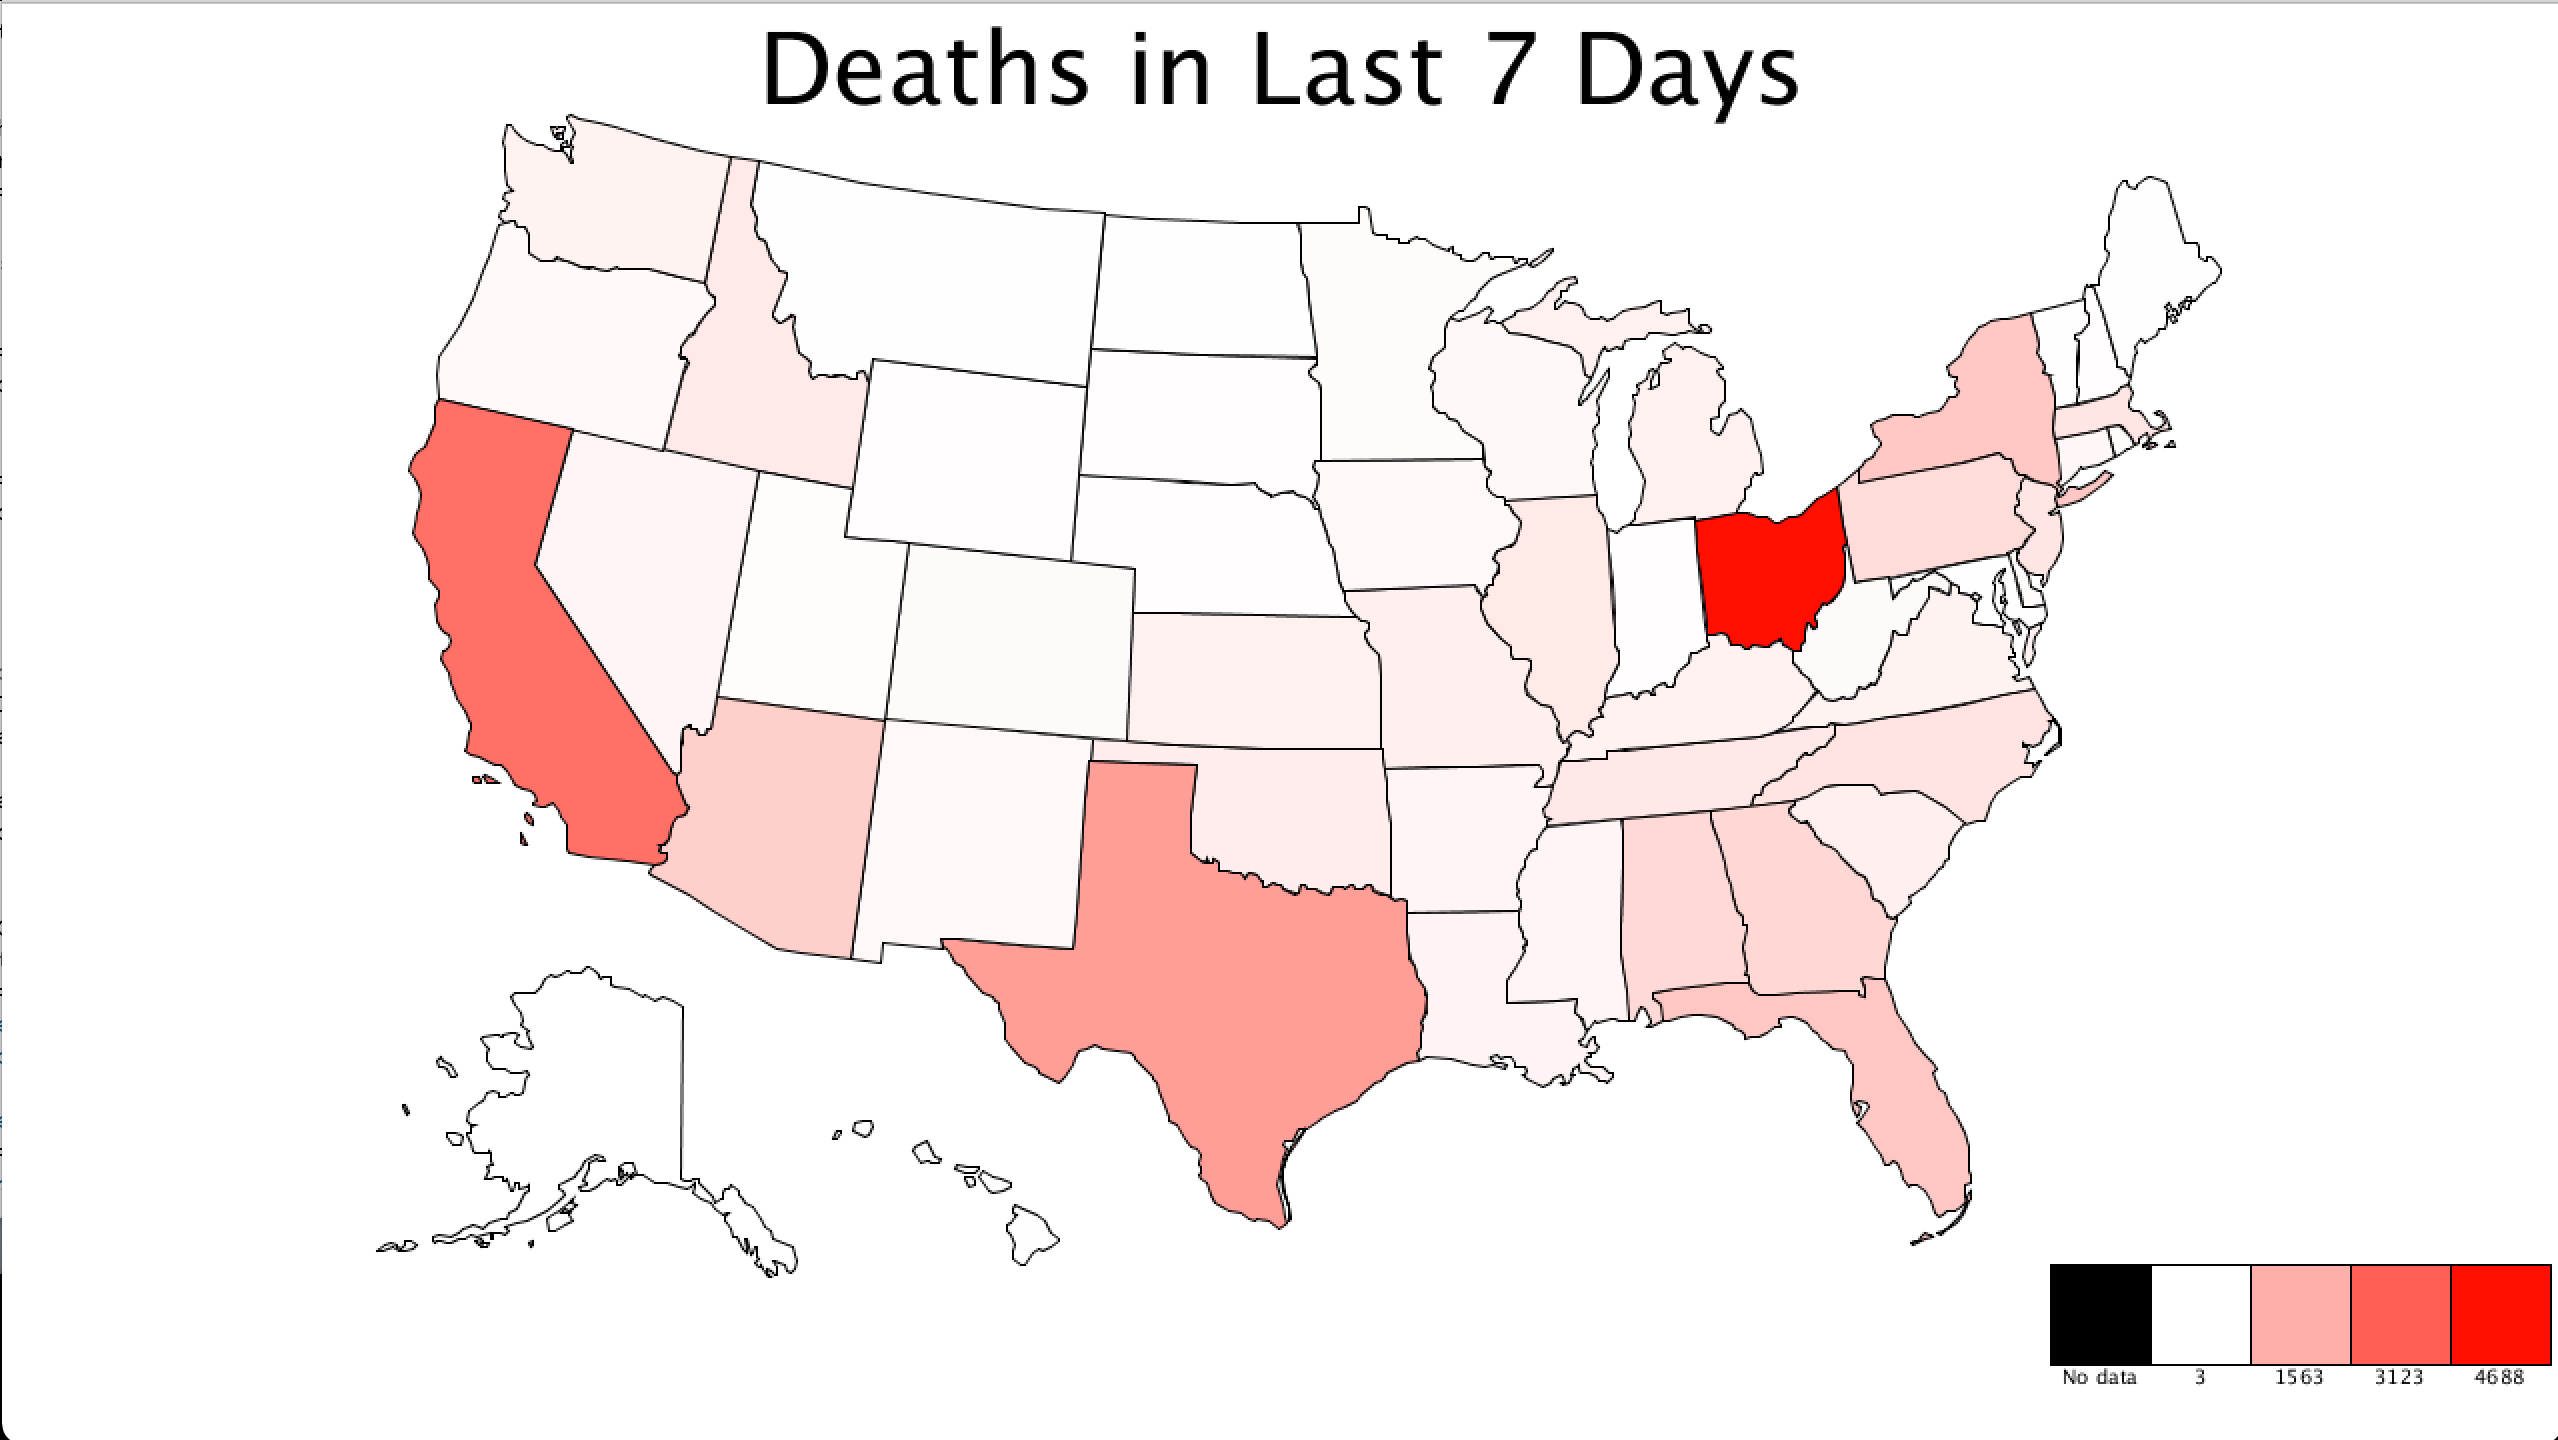
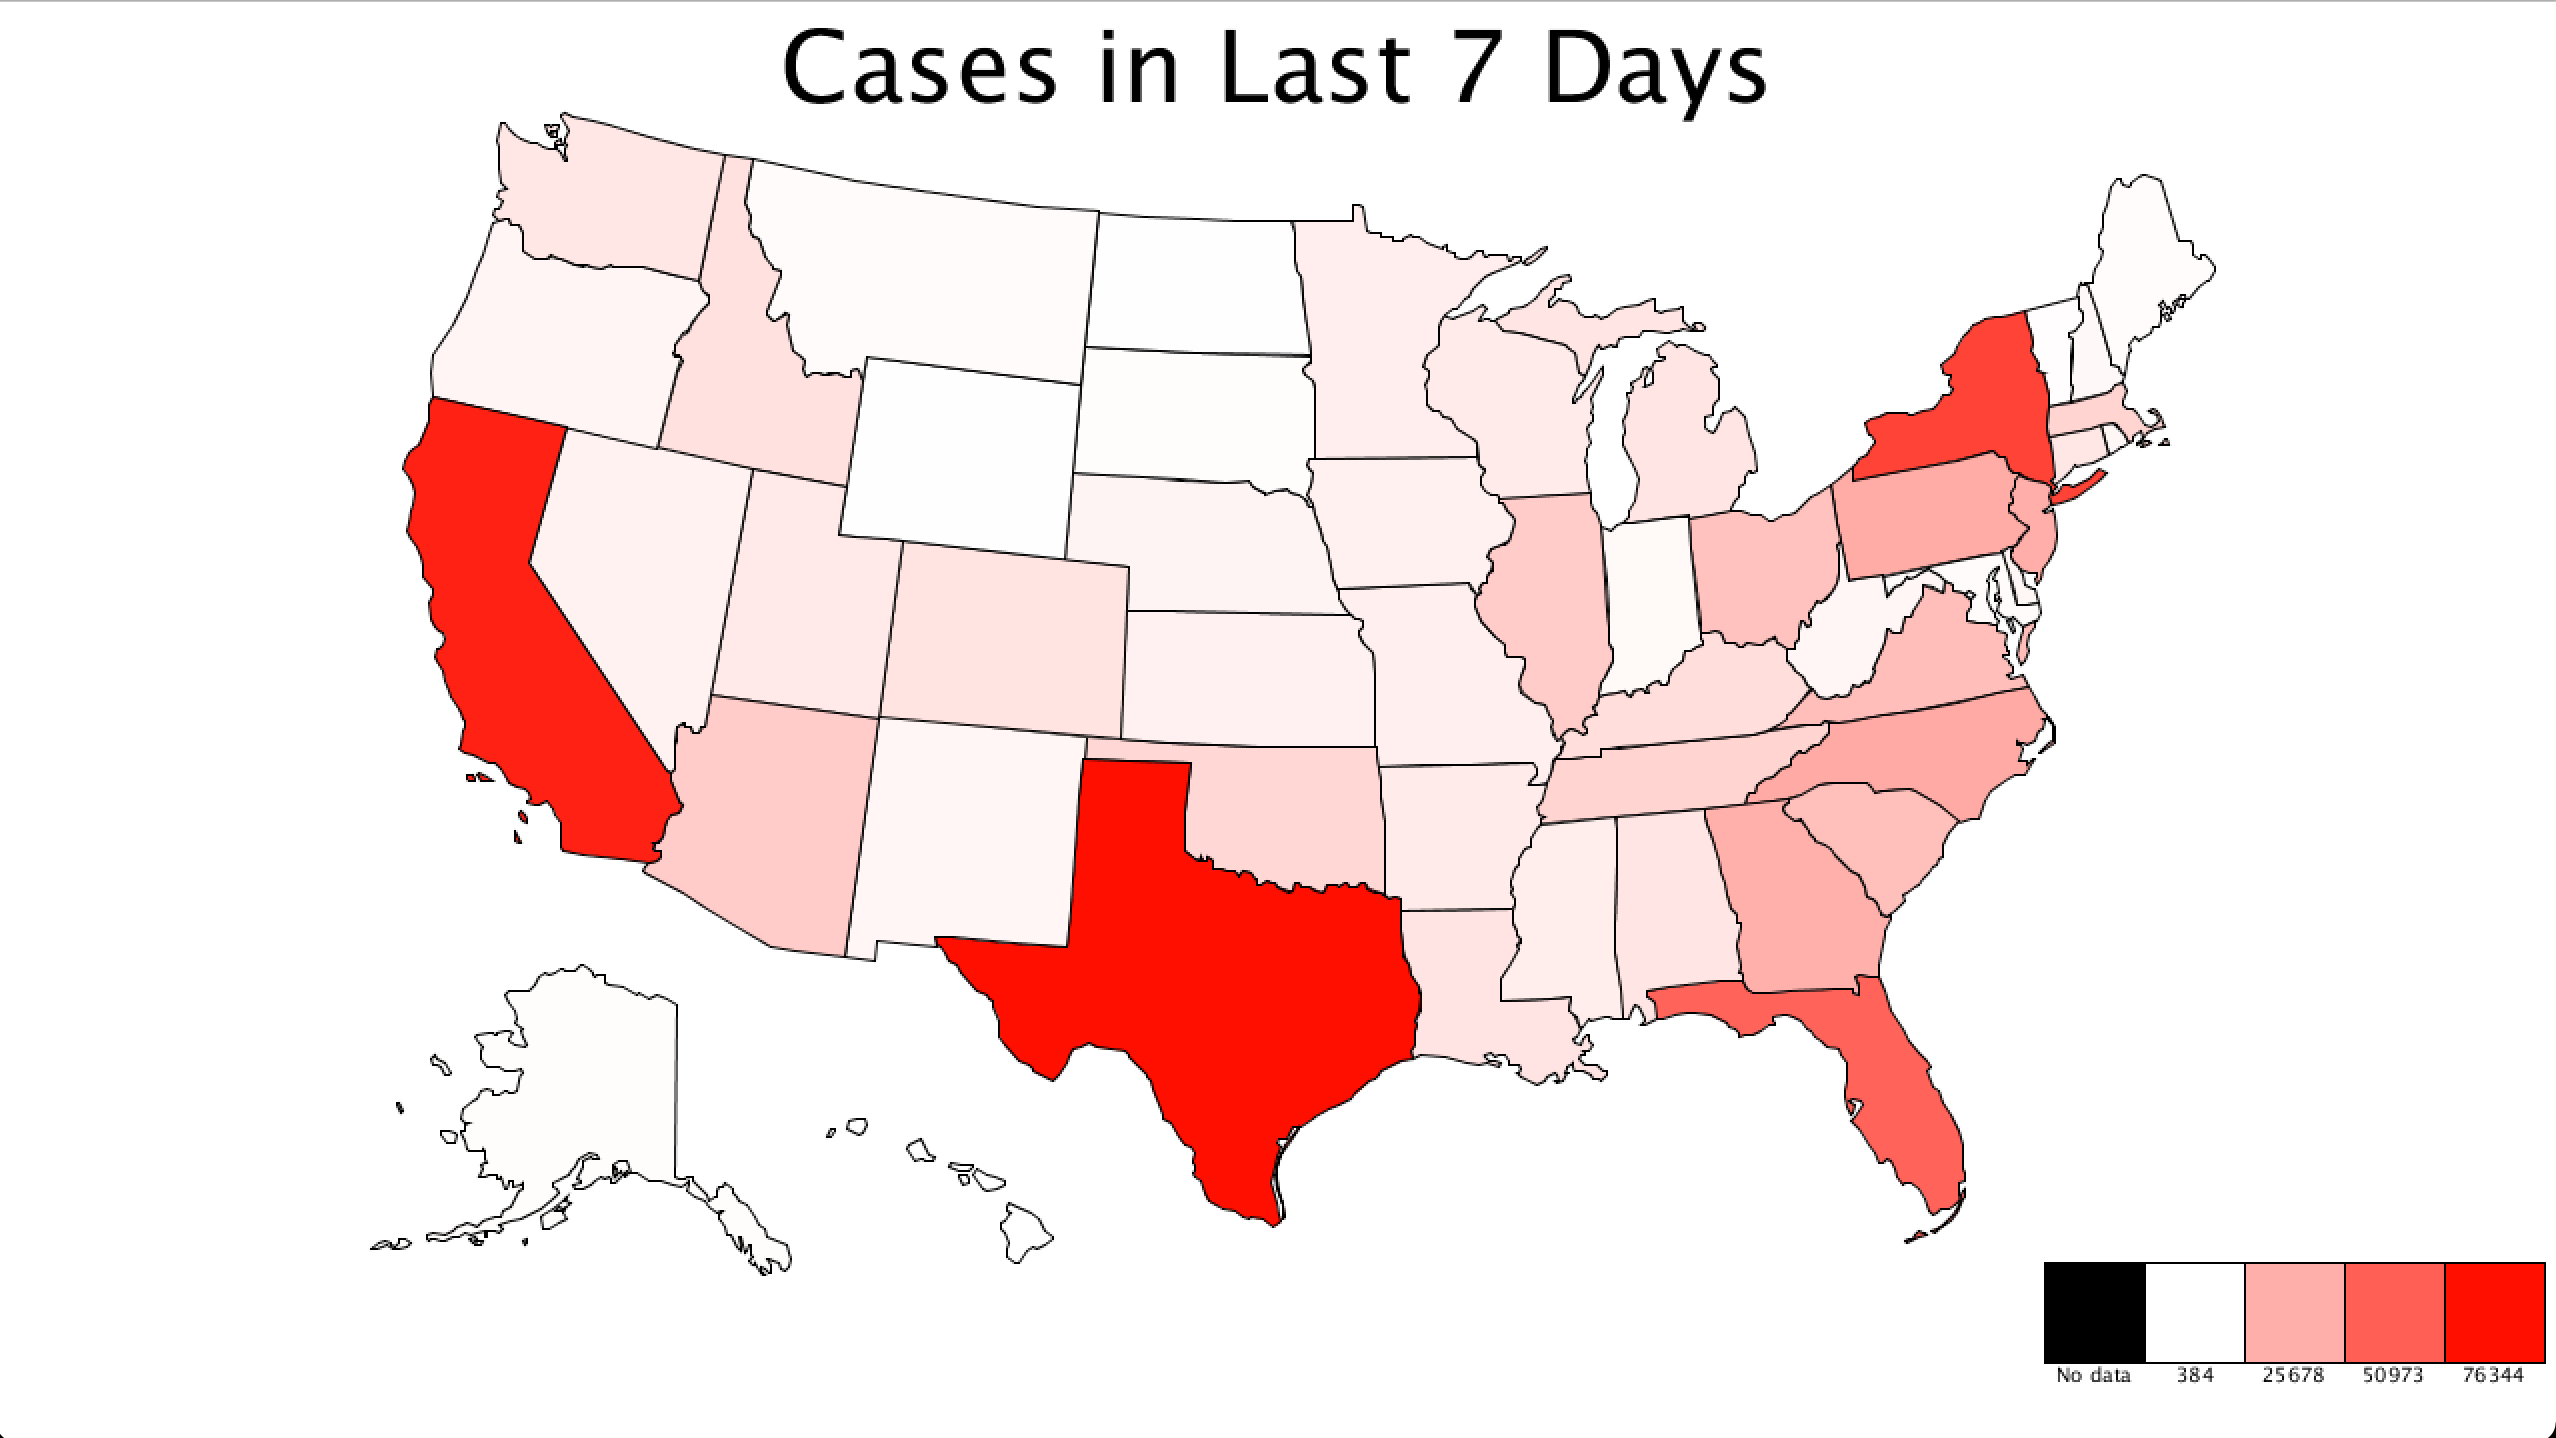
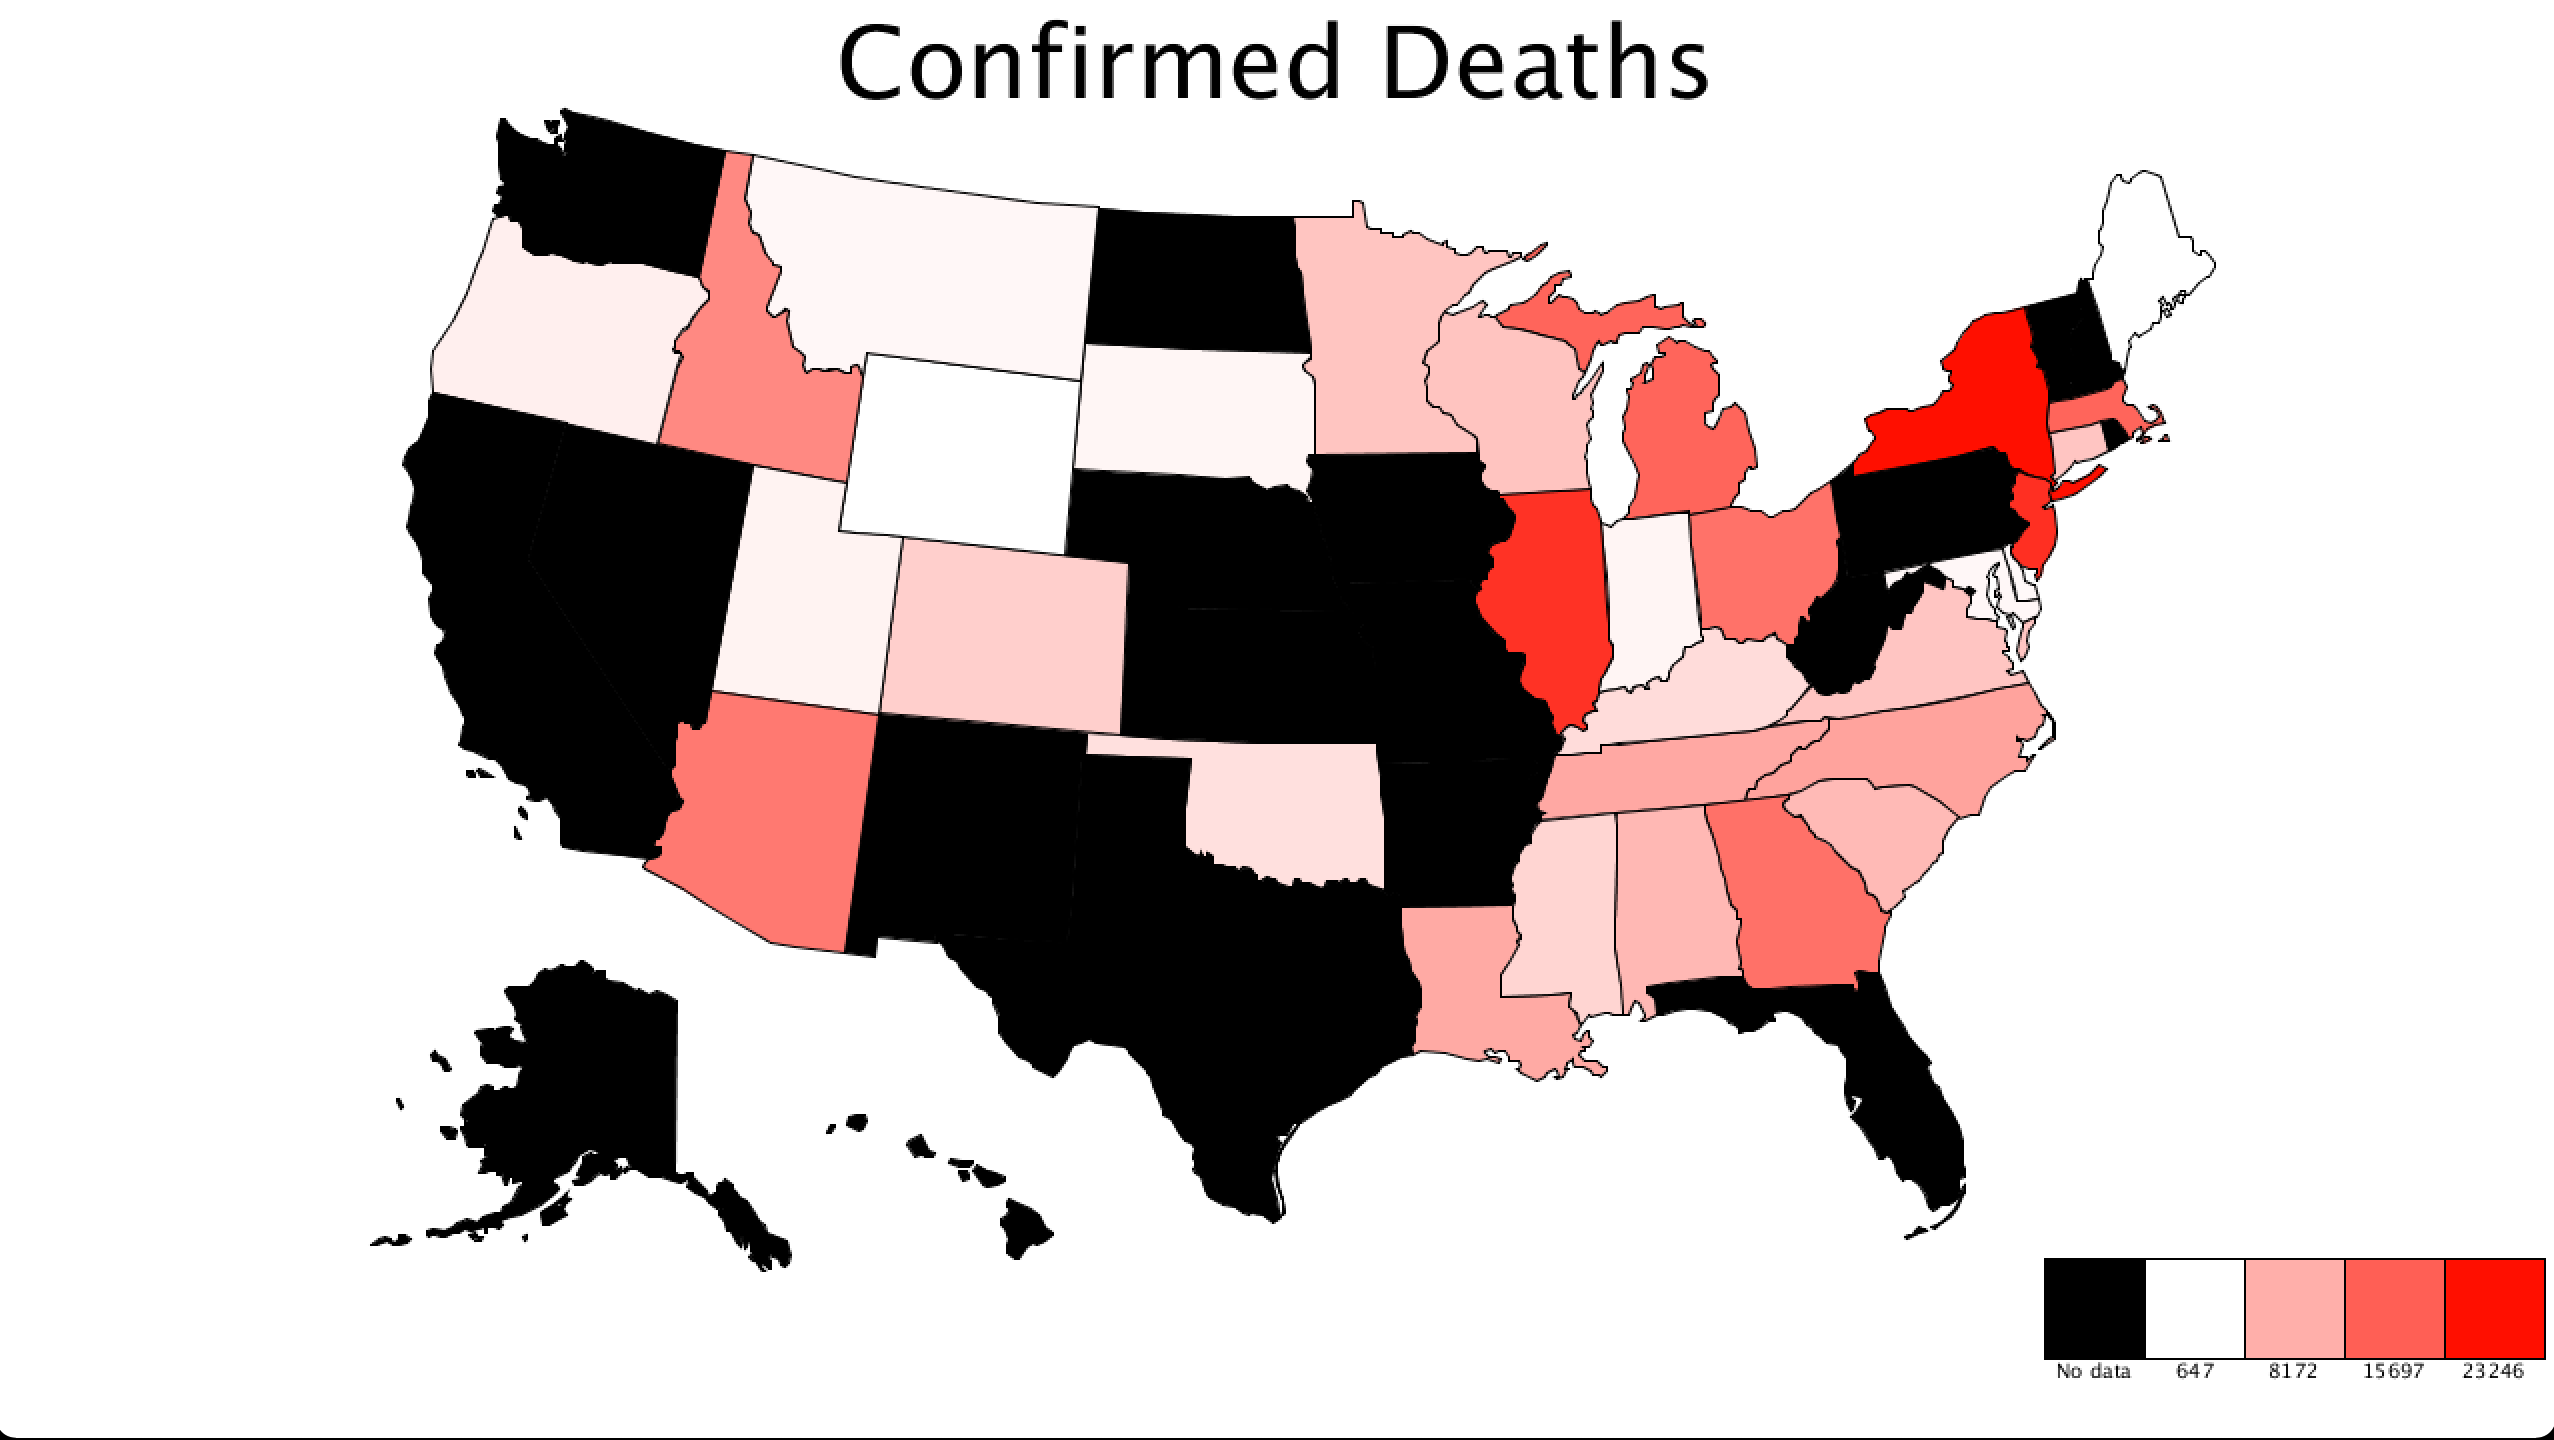
This data is all taken from the CDC so can be considered fairly reliable in my opinion. The issue with any data visualization is that misrepresentation is fairly easy. For starters, some states don’t report on the same data or with the same accuracy, hence why in the last image “Confirmed Deaths”, there are several states blacked out with no data points. Furthermore, color can easily distort the severity of a situation. With a simple mapping from the min to max, in the map “Death Rate per 100k in the Last 7 Days”, the state of Ohio looks much more severe than the rest of the country, when in reality its value is at 5, only slightly higher than most other states around 3. The type of data being displayed is also important. In the total case and total death maps, large and high population states appear far more severe. This may be in terms of quantity, but in reality per 100k is a much more useful metric. Would a city with 5 cases and 10 residents really be considered safer to be in that a city with 10 times as many cases but 1000 times as many residents?
Great job on processing the SVG Cole! The visualization choices are clear and easy to understand.