Overview:
This week’s task was to make some sort of artwork from the types of loops we had learned in class this week (for() and while()). To give us some inspiration, we were given some magazines on early forms of computer generated art coming out of the 1980s and 90s. Google searches yielded lots of examples to choose from in addition. Many were reminiscent of old Windows screen savers, and often featured bright colors. My favorite of several were the fractals that came up. Some were fairly simple, and others were complex using tricky mathematical formulas. I decided to go ahead and try one that pushed me to understand hard mathematical concepts such as imaginary numbers, and see if I could translate to Java.
Mandelbrot Set:
The Mandelbrot Set is a set of complex numbers that for each complex number, ‘c‘, does not diverge when the value for ‘z’ is iterated in the below formula.
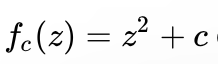
This math was tricky for me as it involved the revolution around a point in a complex plane. Luckily this topic is well documented and this page had great explanations and even a sudocode algorithm to get me started in plotting the phenomena.
I was able to convert the code into similar Java code, and then make changes so that processing could do what it needed.
Problems:
Besides complex math formulas, some problems that were tricky to overcome included converting values to colors on a scale to iterate through with a loop, and a self created extra challenge of animating a zoom functionality to better demonstrate the fractal’s impressive effects.
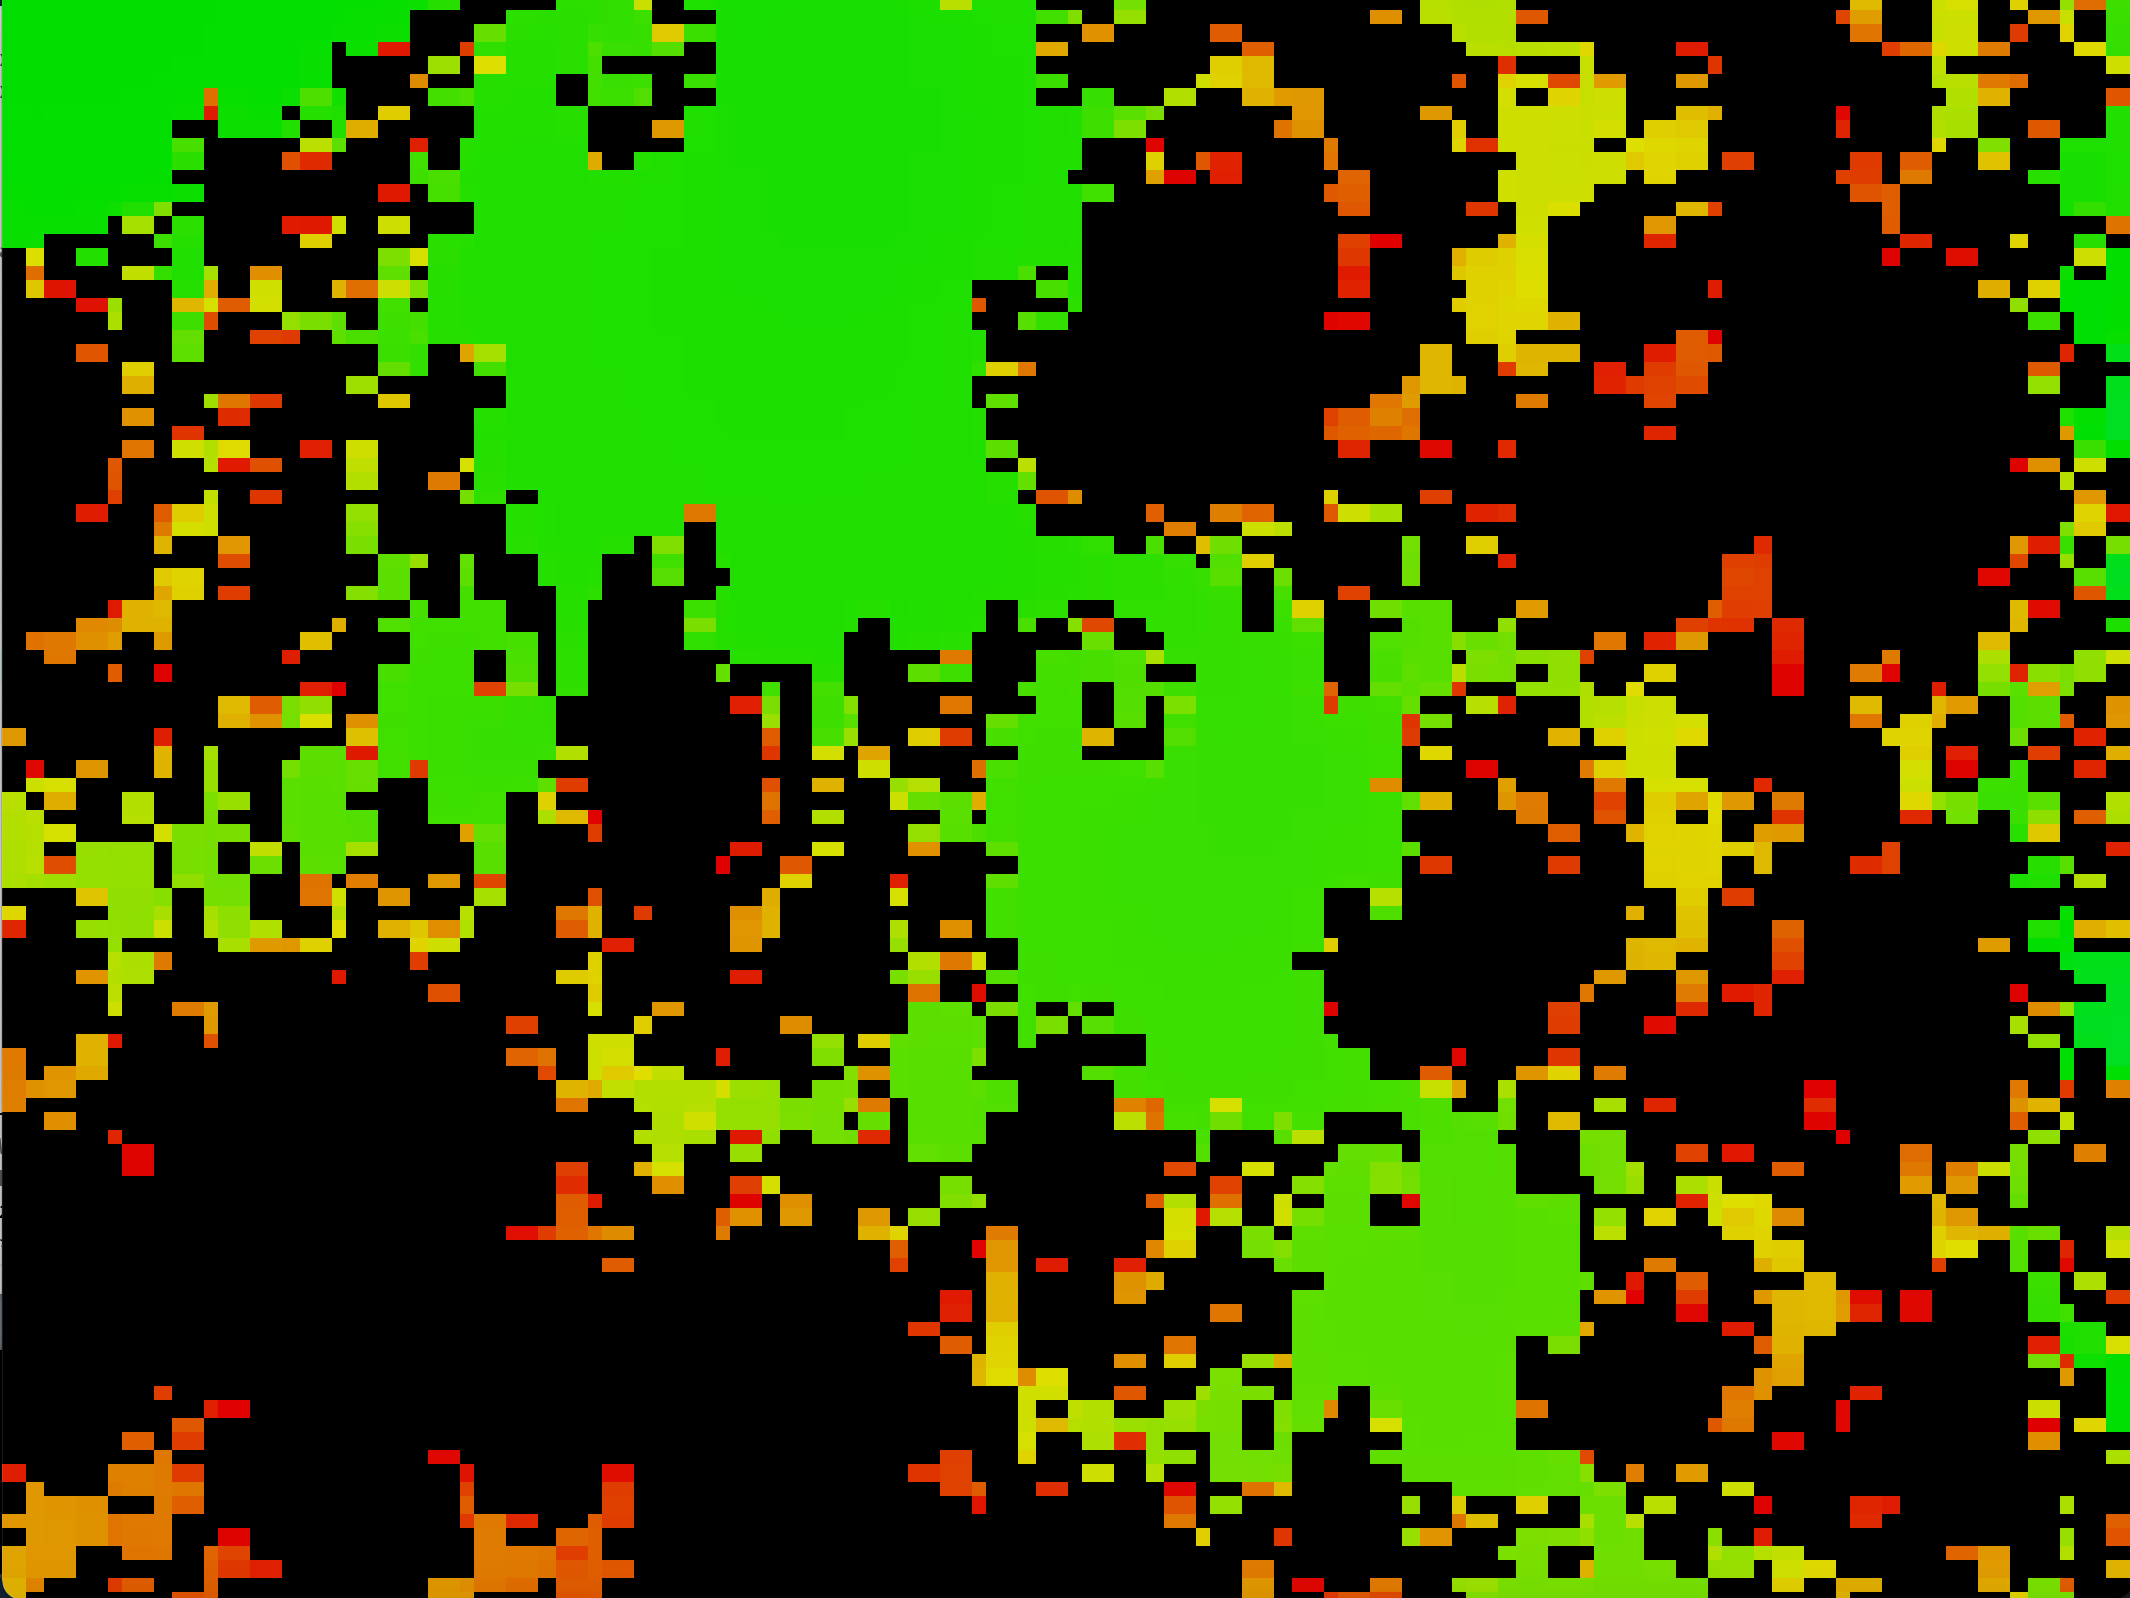
To translate the value of the algorithm to color in processing, I had to use map() to take a wide range of numbers and make it understandable to a color value. I also decided to use HSB color as it would allow me to use a single variable that could be iterated for hue, rather than three separate values for RGB. This was new to me and took some experimentation to get right.
For zooming, it took me a long time to figure out how to scale to a certain coordinate in the plane, while not distorting in the width or height directions. Eventually I derived the formula on line 38,39 of the code below which involves taking the width and height times a zoom factor with the correct offsets.
Code:
The code for this took several attempts to get right. The initial variables defined are mostly for the animation of the zoom, but also include adjustable parameters for the formulas. I utilized the timeout algorithm which provides a good approximation if a number is or is not in the set. This value could be adjusted to make to the depiction more detailed, at the expense of computational difficulty. I then initialize a workspace with a 1.333 aspect ratio, and set the color mode to HSB for the reasons described previously. I then begin looping. Using nested for loops I iterate over each pixel in the graphic and determine its timeout value using the above mathematical process in a loop. With the timeout value ranging from 0-timeout max value, with 1000 being the one used in this instance, these values need to map to a hue. Since anything above the max timeout value is considered part of the set, they are assigned black, otherwise the value is mapped reversely onto a range from red to violet.
//PSEUDOCODE TAKEN FROM WIKIPEDIA ESCAPE TIME ALGO
//x0 := scaled x coordinate of pixel (scaled to lie in the Mandelbrot X scale (-2.5, 1))
//y0 := scaled y coordinate of pixel (scaled to lie in the Mandelbrot Y scale (-1, 1))
//x := 0.0
//y := 0.0
//iteration := 0
//max_iteration := 1000
//while (x*x + y*y ≤ 2*2 AND iteration < max_iteration) do
//  xtemp := x*x - y*y + x0
//  y := 2*x*y + y0
//  x := xtemp
//  iteration := iteration + 1

//color := palette[iteration]
//plot(Px, Py, color)


int WIDTH;
int HEIGHT;
int maxIteration = 10000;  //level of detail
float zoom = 0;  //Can't zoom much past 100,000
float xOffset = 0.004; //(-1 - 1) (-1 zooms in on far left edge, 1 on far right)
float yOffset = -.1; //(-1 - 1) (-1 zooms in on top edge, 1 on bottom)   (0.004, -0.1 is an interesting cord set)

void setup() {
  size(1066, 800);
  WIDTH = width;
  HEIGHT = height;
  colorMode(HSB, 360);
}

void draw() {
  background(0);
  for (int i = 0; i < WIDTH; i++) {
    for (int j = 0; j < HEIGHT; j++) {
      //float x0 = map (i, (zoom*WIDTH/2), (WIDTH-((WIDTH/2)*zoom)), -2.5, 1);
      //float y0 = map (j, (zoom*HEIGHT/2), (HEIGHT-((HEIGHT/2)*zoom)), -1, 1);
      float x0 = map (i, (-WIDTH*zoom)-(xOffset*zoom*WIDTH), (zoom*WIDTH)+WIDTH-(xOffset*zoom*WIDTH), -2.5, 1);
      float y0 = map (j, (-HEIGHT*zoom)-(yOffset*zoom*HEIGHT), (zoom*HEIGHT)+HEIGHT-(yOffset*zoom*HEIGHT), -1, 1);
      float x = 0.0;
      float y = 0.0;
      int iteration = 0;
      while(x*x + y*y <= 2*2 && iteration < maxIteration){
        float xtemp = x*x - y*y + x0;
        y = 2*x*y + y0;
        x = xtemp;
        iteration++;
      }
      if(iteration == maxIteration){
        stroke(0, 0, 0);
      }
      else{
        float hue = map(iteration, maxIteration, 0, 0, 255);
        stroke(hue, 360, 360);
      }
      point(i, j);
    }
  }
  if(zoom == 100000){
    noLoop();
  }
  if(zoom == 0){
    zoom++;
  }
  //println("ran");
  zoom = zoom * 10;
}
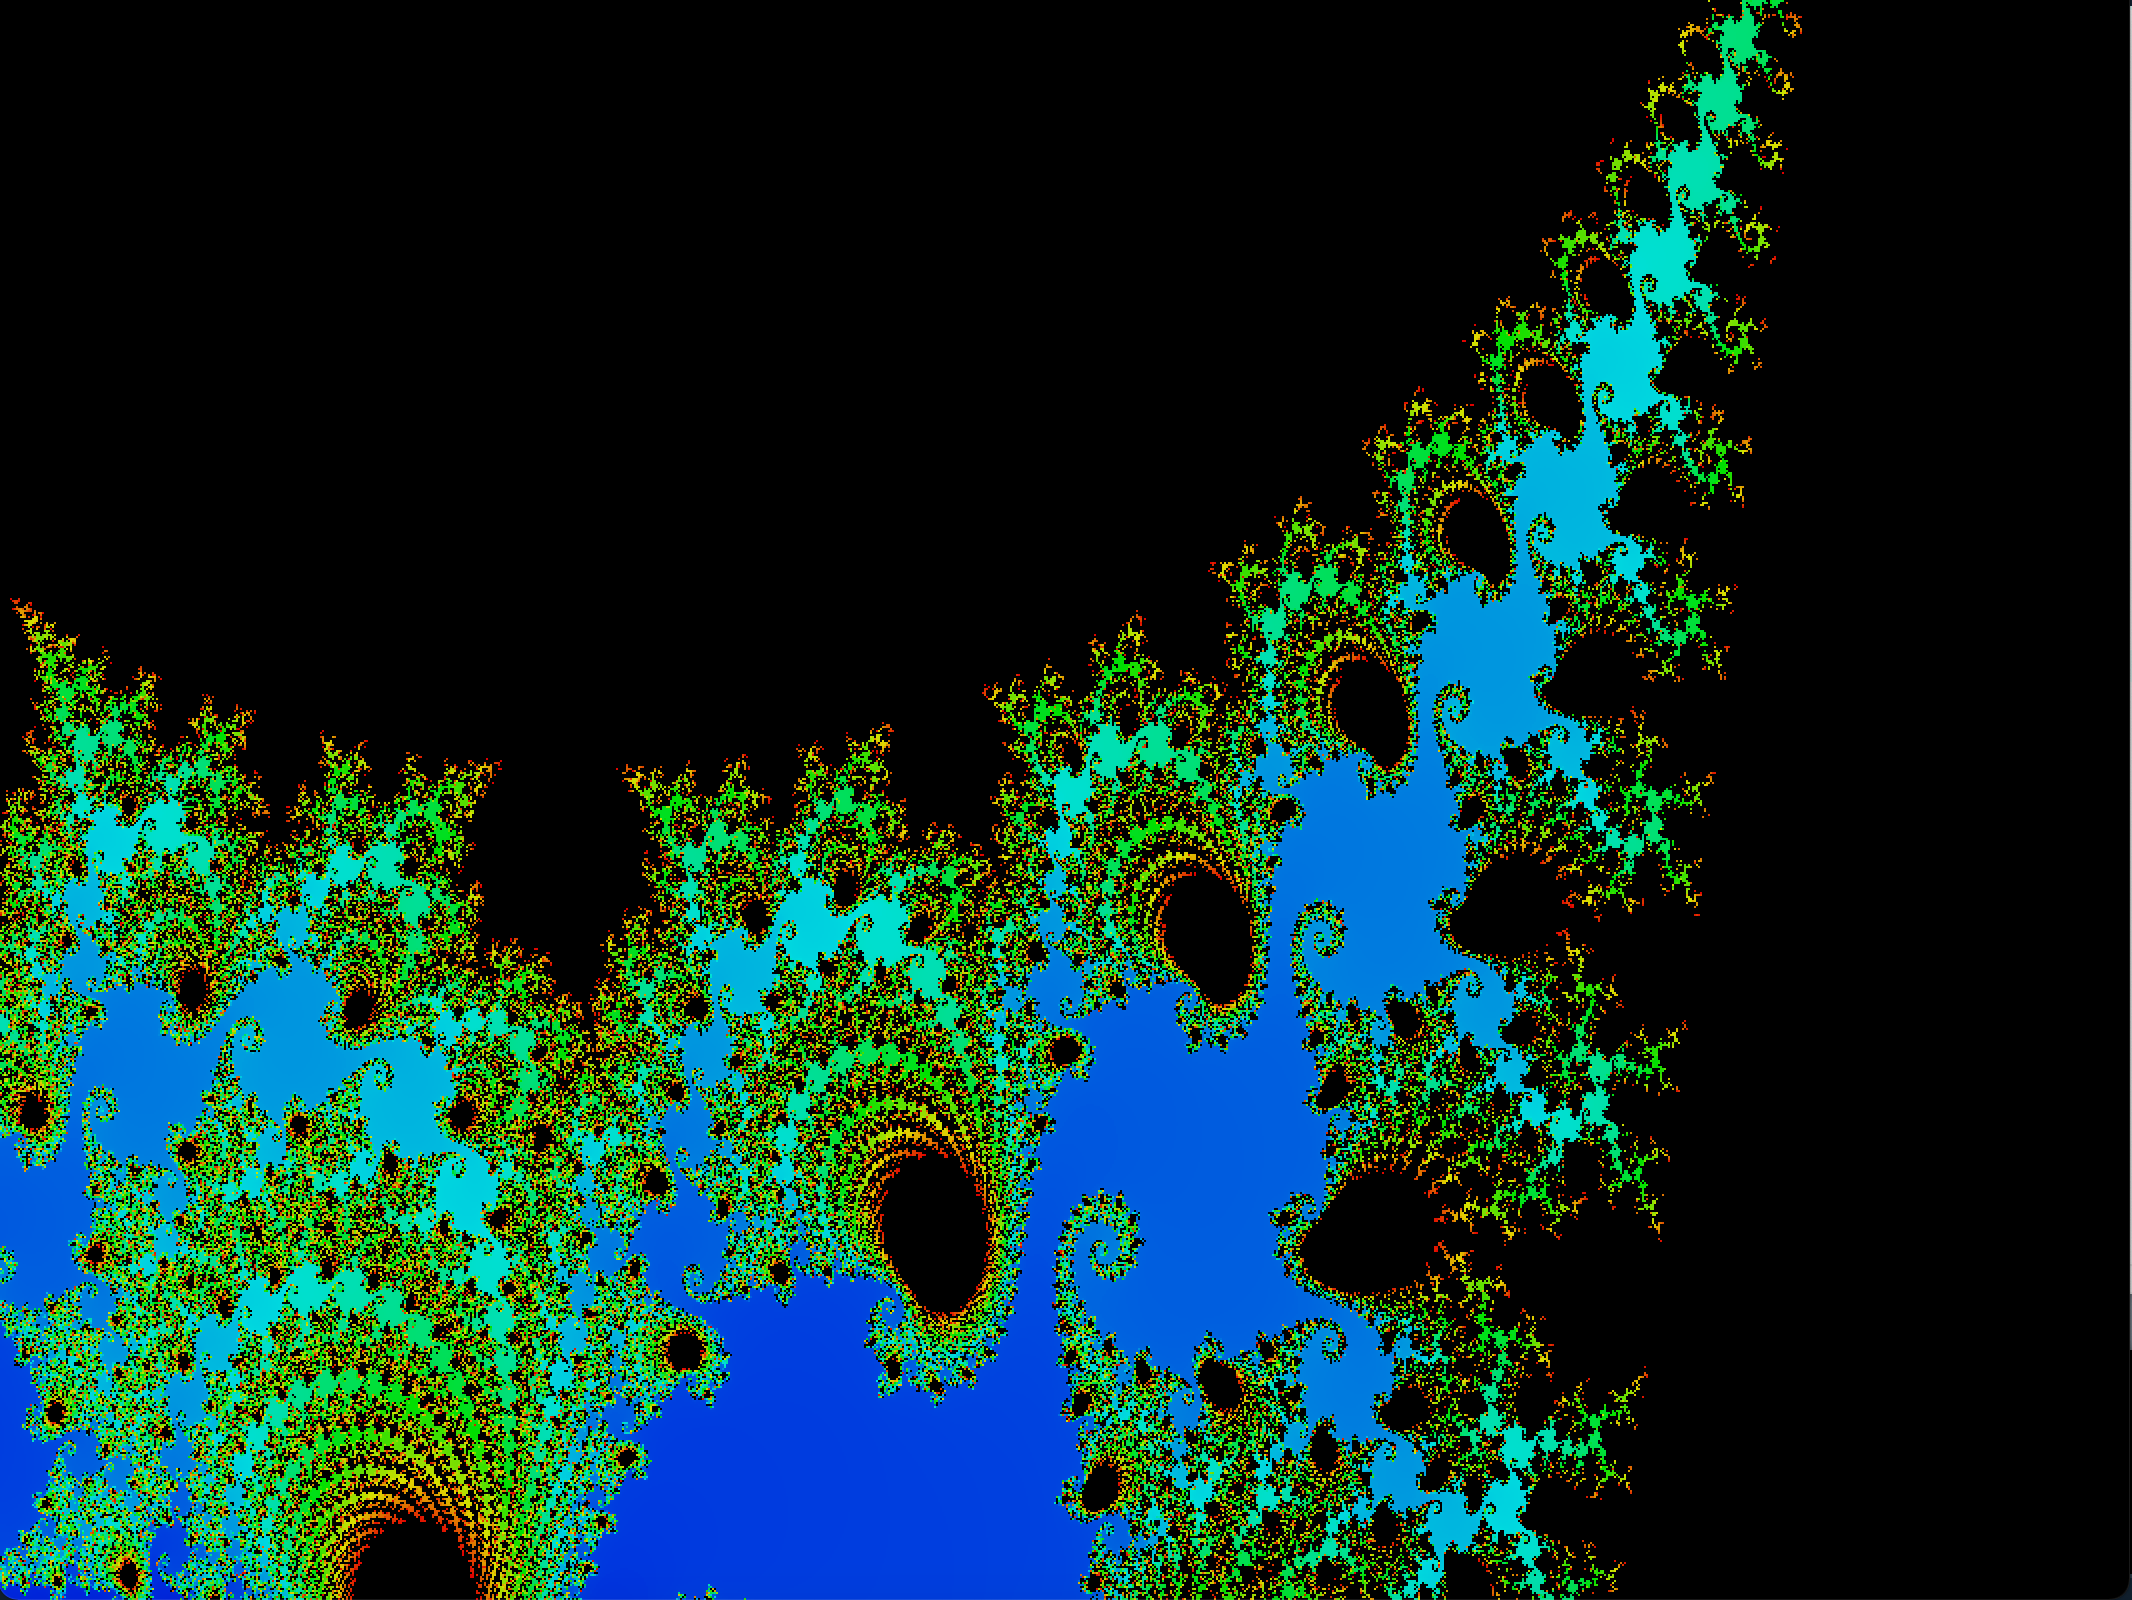
Results:
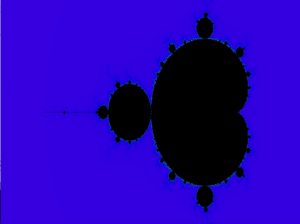
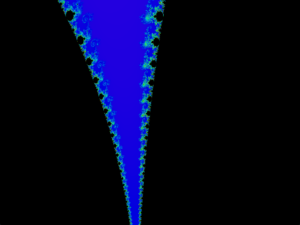

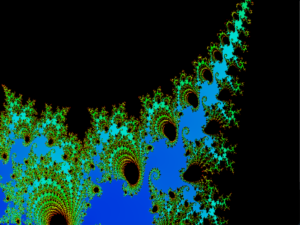
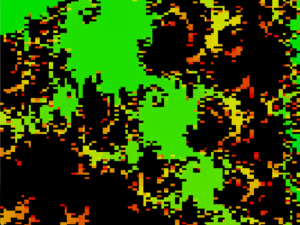
I am happy with how these images came out. It took a lot of time and tweaking of the code but the results were as I was hoping. I played with certain variables such as level of detail at higher levels, and quickly ran out of memory to work with. At high details the variables for the math become so large that they can’t really be stored or have no rounding errors.
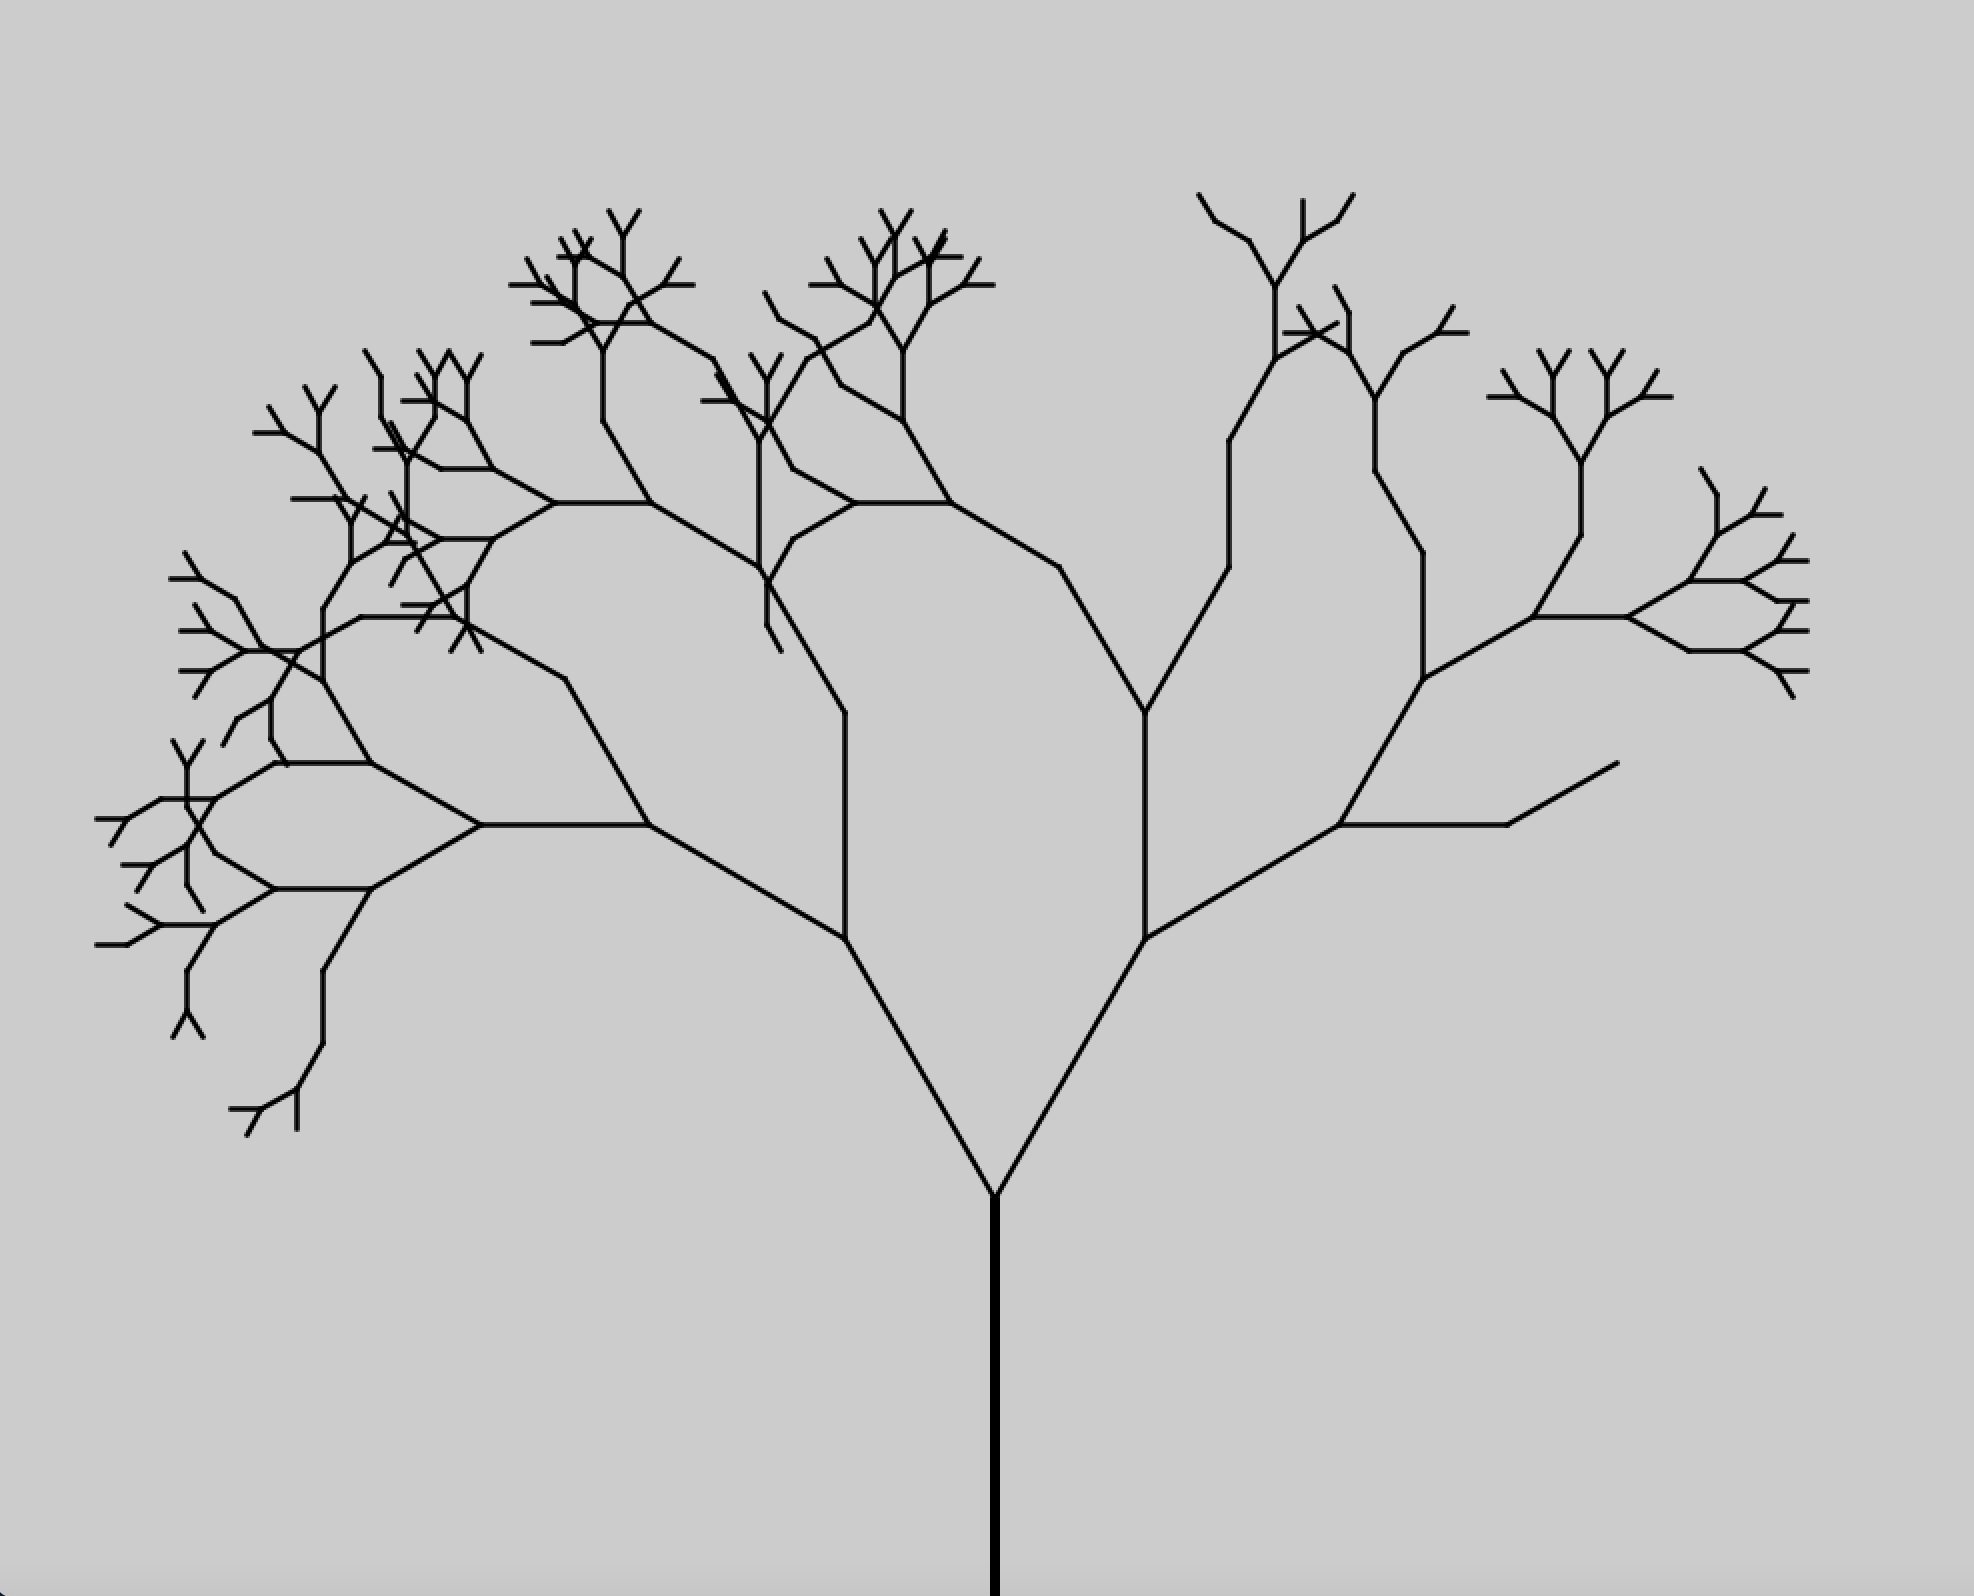
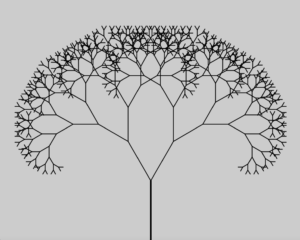
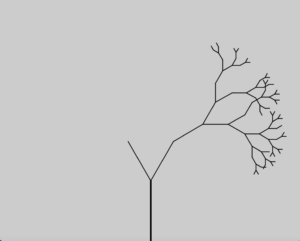
Other Recursion Tests:
I enjoyed making this example of a fractal and went forward trying more simple images using polar coordinates and recursion. This one did not use any loops however so it does not count directly for this assignment, just a fun example. I played with some randomization to try and make it look more realistic too.

//Recursion parameters
int maxIterations = 9; //Number of iterations

//Tree parameters
int angle = 30; //Angle the branches spread;
float treeStroke = 5; //Starting stroke line
float treeStrokeShrink = 0.5; //Fraction lost every time
float percentDestroy = 1.0; //0-1 how much shorter the branches get with each iteration, 1 is 100%, 0 is no chance
float shorteningPercent = 0.75; // 0-1, How much shorter the branches get
float branchLength;

//Drawing variables

void setup() {
  size(1000, 800);
  branchLength = height/4;
}

void draw() {
  drawTree(0, maxIterations, width/2, height, branchLength, 270, treeStroke);
}

// Iteration that its on, max iterations, x, y, length of line, stroke size
void drawTree(int i, int m, float x, float y, float l, float o, float s){
  translate(x,y);

  // Convert polar to cartesian
  float x1 = l * cos(radians(o));
  float y1 = l * sin(radians(o));

  // Draw the line and set stroke
  strokeWeight(s);
  line(0, 0, x1, y1);

  //Recursion
  if(i < m){
    float randOne = random(0,1);
    if(randOne < percentDestroy){
      pushMatrix();
      drawTree(i + 1, m, x1, y1, l*shorteningPercent, o+angle, treeStroke*treeStrokeShrink);
      popMatrix();
    }
    float randTwo = random(0,1);
    if(randTwo < percentDestroy){
      drawTree(i + 1, m, x1, y1, l*shorteningPercent, o-angle, treeStroke*treeStrokeShrink);
    }
  }
  noLoop();
}
Conclussions:
I enjoyed this weeks tasks and pushed myself to try something new to me. It made the assignment more challenging and more rewarding when it finally worked out the way I was hoping. The variables and iterative programming allowed me tot week the code and write minimal amounts once I had an algorithm that worked.