Prompt: Make something that uses only one sensor on Arduino and makes the ellipse in p5 move on the horizontal axis, in the middle of the screen, and nothing on Arduino is controlled by p5.
Code P5:
let circleX;
function setup() {
    createCanvas(600, 600);
    noFill();
}
function draw() {
     background("rgb(248,238,249)");
  stroke("purple");
 ellipse(map(circleX, 0, 1023, 0, width), height / 2, 100, 100);

     if (!serialActive) {
    background("#CE41E6");
    stroke("#white");
    textSize(50);
    text("Press Space Bar to select Serial Port", 20, 30, width - 30, 200);
  }
}
function keyPressed() {
    if (key == " ")
        setUpSerial();
}
function readSerial(data) {
    if (data != null) //
        circleX = int(data);
}
Arduino Code:
int lightPin = A0;
void setup() {
  Serial.begin(9600);
  pinMode(lightPin, INPUT);
}
void loop() {
  int sensorValue = analogRead(lightPin);
  Serial.println(sensorValue);
  delay(5);
}

Task 2:
Prompt: Make something that controls the LED brightness from p5
For this project, I decided to imitate the sun: as the mouse moves from left to right across the screen, the brightness level on the screen and the connected LED both increase.
Code P5:
let ledBrightness = 0;
function setup() {
  createCanvas(600, 400);
  textSize(20);
}
function draw() {
  background(240);
  if (!serialActive) {
    fill(0);
    text("Press SPACE to select serial port", 20, 30);
  } else {
    // Display mapped brightness
    fill(0);
    text("LED Brightness: " + ledBrightness, 20, 30);
    fill(255, 150, 0);
    ellipse(mouseX, height / 2, map(ledBrightness, 0, 255, 10, 100));
  }
  // Update brightness based on mouseX
  ledBrightness = int(map(constrain(mouseX, 0, width), 0, width, 0, 255));
  // Send brightness to Arduino
  if (serialActive) {
    writeSerial(ledBrightness + "\n");
  }
}
function keyPressed() {
  if (key == ' ') {
    setUpSerial();
  }
}
Arduino Code:
int ledPin = 9;
void setup() {
  Serial.begin(9600);
  pinMode(ledPin, OUTPUT);
  while (Serial.available() <= 0) {
    delay(300);
  }
}
void loop() {
  while (Serial.available()) {
    int brightness = Serial.parseInt();
    if (Serial.read() == '\n') {
      brightness = constrain(brightness, 0, 255);
      analogWrite(ledPin, brightness);
    }
  }
}
Task 3:
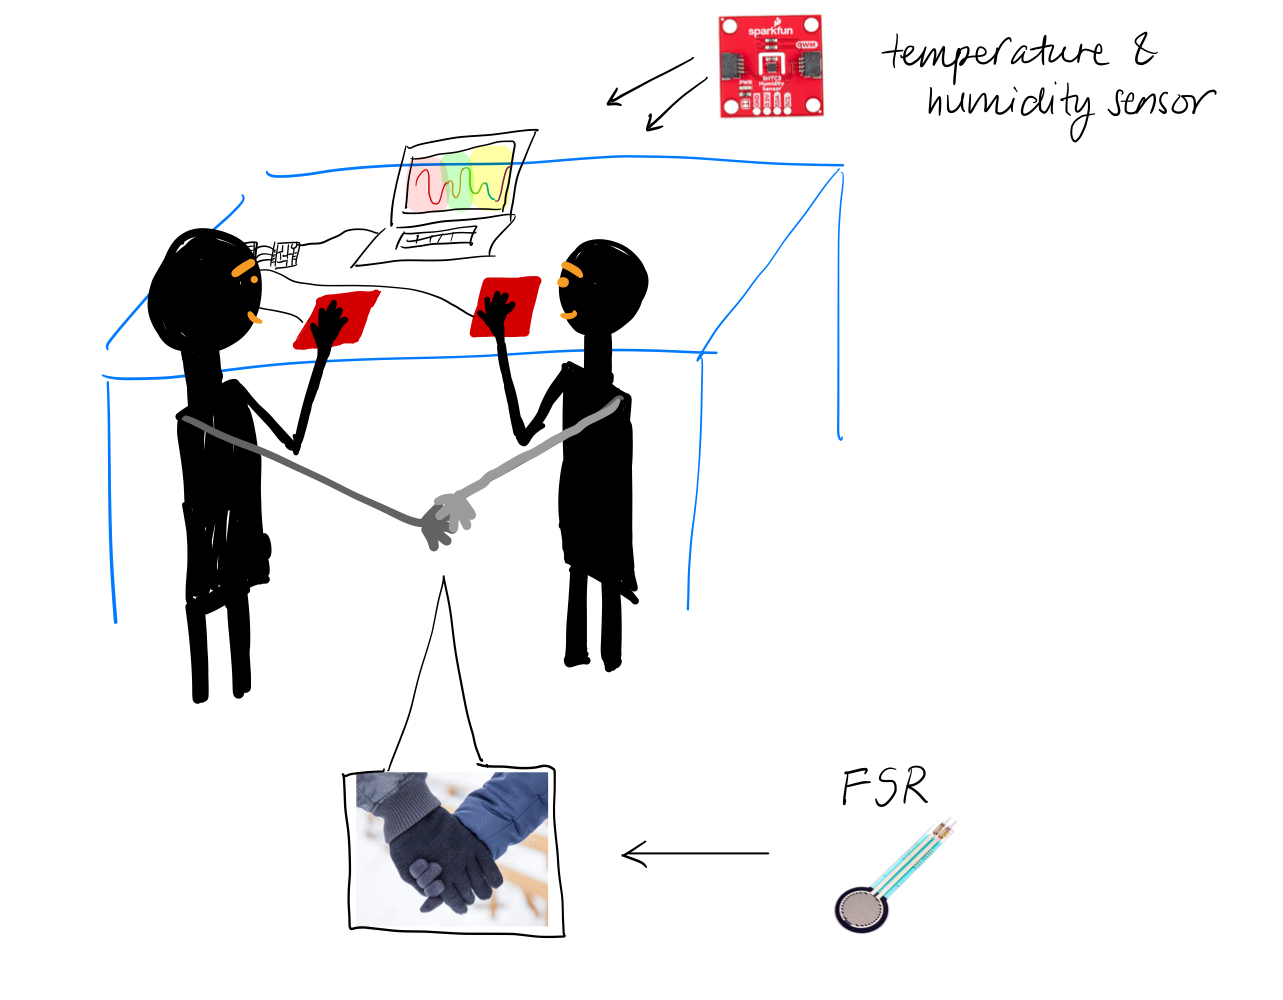
Prompt: take the gravity wind example (https://editor.p5js.org/aaronsherwood/sketches/I7iQrNCul) and make it so every time the ball bounces one led lights up and then turns off, and you can control the wind from one analog sensor.
I connected Arduino to p5.js so the potentiometer controls the wind of the bouncing ball, and whenever the ball hits the ground, the LED blinks. Everything talks to each other through serial communication.
Link to task 3 video
Code P5:
let velocity;
let gravity;
let position;
let acceleration;
let wind;
let drag = 0.99;
let mass = 50;
let serial;
let connectBtn;
let ledTriggered = false;
function setup() {
  createCanvas(640, 360);
  noFill();
  position = createVector(width / 2, 0);
  velocity = createVector(0, 0);
  acceleration = createVector(0, 0);
  gravity = createVector(0, 0.5 * mass);
  wind = createVector(0, 0);
  // setup serial connection
  serial = createSerial();
  let previous = usedSerialPorts();
  if (previous.length > 0) {
    serial.open(previous[0], 9600);
  }
  connectBtn = createButton("Connect to Arduino");
  connectBtn.position(10, height + 10); // button position
  connectBtn.mousePressed(() => serial.open(9600));
}
function draw() {
  background(255);
  // check if we received any data
  let sensorData = serial.readUntil("\n");
  if (sensorData.length > 0) {
  // convert string to an integer after trimming spaces or newline
    let analogVal = int(sensorData.trim());
    let windForce = map(analogVal, 0, 1023, -1, 1);
    wind.x = windForce; // horizontal wind force
  }
  applyForce(wind);
  applyForce(gravity);
  velocity.add(acceleration);
  velocity.mult(drag);
  position.add(velocity);
  acceleration.mult(0);
  ellipse(position.x, position.y, mass, mass);
  if (position.y > height - mass / 2) {
    velocity.y *= -0.9; // A little dampening when hitting the bottom
    position.y = height - mass / 2;
    if (!ledTriggered) {
      serial.write("1\n");   // trigger arduino LED
      ledTriggered = true;
    }
  } else {
    ledTriggered = false;
  }
}
function applyForce(force) {
  // Newton's 2nd law: F = M * A
  // or A = F / M
  let f = p5.Vector.div(force, mass);
  acceleration.add(f);
}
function keyPressed() {
  if (key === ' ') {
    mass = random(15, 80);
    position.y = -mass;
    velocity.mult(0);
  }
}
Arduino Code:
int ledPin = 9;
void setup() {
  Serial.begin(9600);
  pinMode(ledPin, OUTPUT);
}
void loop() {
  // send sensor value to p5.js
  int sensor = analogRead(A0);
  Serial.println(sensor);
  delay(100);
  // check for '1' from p5 to trigger LED
  if (Serial.available()) {
    char c = Serial.read();
    if (c == '1') {
      digitalWrite(ledPin, HIGH);
      delay(100);
      digitalWrite(ledPin, LOW);
    }
  }
}