I found this week’s reading really assuming because I could relate to a lot of the examples he gave. Specifically referencing the washing machine and glass door, I definitely have been in situations where the design of a product is aesthetically pleasing and minimalistic, but the actual usability of the product is misleading and frustrating to work with. The example I thought of was the integration of smart screens into the dashboard of cars. I grew up learning how to dial radio stations, DVDs, and cassette tapes, so when my family were able to purchase new cars, I was dumbfounded by the flat screen instead of the variety of knob and mechanism. While it was easy to figure out, I somehow found it a nuisance at times to have to tap or scroll through the interface. I also find it hypocritical because it can be super distracting and cause the driver attention to divert from the road.
I also could relate to the thinking process of engineers and having a set logical process. I agree with the author that it feel like a lot of products are designed for machines and are not user friendly. That is why clear communication, diagrams/ mappings, and symbols are so important because builds the relationship between the individual and the people that worked hard to create the product. In my own work, I find it hard to divert from my logic and fall into the pit of false confidence that led to fallacy. As such, I find great importance in the open projects and humanities because through these studies and experience can there be a bridge between hard logic and real case situations.
I hope in my interactive projects I don’t fall into the logical fallacies as an engineer. Especially because I have been trained through my college career to think logically and work efficiently, there will be times where something can less efficient but easily understood and easier to implement into my project. In addition, I hope to include aesthetic, yet mindful, signifiers in my project, so user are able to interactive and have fun with my projects rather than taking time to determine how my projects work.
Our assignment for the fourth week is data visualization along with typography. The data I chosen for this assignment is taken from the popular database website Kaggle. To visualize the data, I used a collection of different sized circles that was determined by the number of medals each of the 91 countries had won.
INITAL APPOACH
Initially, I had a lot of trouble finding the data that I wanted to use for my assignment because the dataset wasn’t organize, lacked information, or was too complex to be used. In addition, I also didn’t know what I wanted to do, so I felt super unconfident and uncreative in my work. I had an early approach to display the decomposition of RGB values of a randomly chosen color, but the end product left me extremely unexcited and disappointed. Below was my first attempt for the data visualization of color.
First Sketch of Data Visualization: Click the screen to change colors
Through the frustration of this project, I decided to give data searching another chance and decided to use Kaggle since I was a familiar with the site and could filter through different categorizes of datasets. Eventually I ended up finding the Paris Olympic medal dataset and was interested in the breakdown and ranking of the countries that participated.
CODING PROCESS
To not let my RGB project go to waste, I decided to incorporate my main goals and what I learned from the RGB project into the visualization for the distribution of Olympic medals: generating a random color, changing the canvas when the mouse is clicked and having text on screen.
function getRandomColorAndRatio(){
  colorRatio = [random(0,255), random(0,255), random(0,255)];
  updateCircleColor();
}

function updateCircleColor(){
  circleColor = color(colorRatio[0], colorRatio[1], colorRatio[2]);
}

function mousePressed() {
  getRandomColorAndRatio();
}
Also to note, I decided to remove the draw() function in my code because the name was deceptive to me, and I didn’t need my screen to constant refresh, so it was easier to declare my own function and call them in setup().
THE HARDSHIPS
Honestly, the hardest part this week was overcoming the uncreative block and finding a dataset I was interested to work with. For my code, I didn’t have too much trouble importing the data or implementing my idea because I already had a basis of what I wanted my project to look like and the interactive feature to because of my initial approach. I did have trouble figuring out the math to corelated the sizes of the circles with the number of medals awarded because I dumbly decided to work on the whole dataset instead of the first ten. So my future advice for people, is to work within a small range of your data first before implementing the code across the entire dataset. Otherwise, you’ll find that rank 84 in the world has the biggest circle and rank 1 has the smallest circle because you didn’t check your math.
Math for Circle Sizes
// circles are has a scale factor of 10% based on the ratio of a countries medals awarded with the total medals awarded in relation to the width
  let size = 10 * (countryTotal/ totalMedalsAwarded);
  let circleArea = (width) * size
THE UPSIDES
For my final product, I ended up with two concepts of my dataset. The first version is sort of a generative art that will randomly place the circles of the countries’ medal with a random color somewhere on the screen. Though, it sounds chaotic, I feel the circular shapes and (if lucky) the pastel color gives a bubbly and warm feeling to the viewer. It was also here that I noticed my mistake where rank 84 was much larger than the top ten because I had labeled each circle and didn’t see any of the top 10 countries listed. Through in the end, in the code I commented out the countries’ names and rank because I felt it added too much noise and unnecessary complexity into the composition.
Data Visualization 1: Click to change composition
For my second concept, I decided to have a structed data visualization. To do so, I simply implemented a double for-loop to create a 10 by 10 matrix and map each of the circle centers to their respective coordinates. Once the circles were maps, I uncommented the text label for the countries’ rank and medals, and I feel like it tired the project together. However, sometimes the randomization of the colors may cause the label, and sometimes the circle, to blend into the background and making it invisible. I think for future plans, it would be nice to figure out a solution to keep randomization but not have it blend with the background.
For-loop Code and If-Else Statement to check if there are still data to be processed
// organize the datas in a set 10 x 10 coordinate fashion
function xyPos(){
  for (let yPos = 120; yPos < height; yPos+= 120){
    for (let xPos = 120; xPos < width; xPos += 120){
      // there will be extra spaces in the end so it is necessary to always check that there are still rows/ data left in the file to be processed
      if (fileRow < strings.length){
        lineFile = split(strings[fileRow], ",")
        runFile(xPos, yPos, lineFile);
        fileRow += 1
      }
    }
  }
}
I had to increase the canvas size to 1200 x 1200 in order for the labels to not overlap with each other, so here is the link to project, for anyone wanting to see the code.
Data Visualization 2: Visualizations of the number of medals award to each 91 participating countries
FINAL REMARKS
While time consuming, compared to my first project, I am extremely happy with my final result. I really liked processing the data and understanding which of the data was useful to me and would be the most impactful to the viewer. I had also learned that the Olympics ranks by gold medals, not total medals. I was really confused why Brazil was ranked 8th when it had more medals than those that ranked higher than them. Overall, I had a lot of fun using the data and then seeing the work tied together.
Also, in my code, I have a breakdown of each countries’ medals by gold, silver, and bronze. I didn’t include it in concept 2 photo because I wanted to keep it straightforward and simple.
In Chapter 1 of The Art of Interactive Design, Chris Crawford describes interactivity as a continuous loop with three steps: listening, thinking, and speaking. A system that truly engages users is one that doesn’t just react—it listens, processes input and responds differently based on type of the input.
The strongest interactive systems create a kind of “conversation” between the user and the program. It’s not just about clicking a button and getting a fixed response, but more about the system understanding the user’s input and adapting to it. For example, a simple calculator provides weak interaction because it only gives pre-programmed results. On the other hand, a video game provides a much richer experience by reacting to the player’s choices and strategies in real time.
To make my p5.js sketches more interactive, I could start by making them more adaptive to user behavior. My most important takeaway from the chapter is separating ‘participation’ as compared to ‘interactivity’. In my old sketches I have used ‘participation’ where no matter how the user approaches the system, the system outputs from a list of fixed effects. Moving to making my systems interactive would mean that any system I design would not just respond the same to each output but contain an algorithm that accurately digests the variability of inputs whether that is length, type of interaction, active or passive interaction and then react accordingly.
Instead of just reacting with basic changes like color shifts when the mouse is clicked, I hope to now build in more complex systems of interactivity in my sketches. For instance, if the user holds the mouse down longer, maybe the system reacts in a different manner. Or, I could design it so that the faster someone moves their mouse, the more dramatic the visual change. The more, the user thinks that not just their input matters, but their type of input matters as well, the more I will know I did a good job creating an interactive piece of media. By adding this kind of real-time feedback, the sketch can feel more dynamic and have deeper user involvement, a system of ‘inputs’, ‘processing’ and ‘outputs’, that Crawford would consider ‘interactive’.
For this project, I viewed a lot of generative artwork created using P5.JS but the idea for my particular design did not click until I was watching a 3Blue1Brown, a math youtuber’s video on Dirichlet’s theorem. The theorem tries to explain how prime numbers create certain spirals, and the randomness of primes means you cannot accurately predict the pattern. Thus the idea of working with random spiral shapes was born. I decided to create a 6×6 grid of spirals, each generating a gradient of color for unique spiral shapes. I wanted to add a level of interactivity which I did by making the spirals spin when the mouse hovers over them (mimicking an electron’s spin and change of behavior when ‘observed’). Furthermore I made it so that any mouse click on a particular spiral, changed the direction of the spin.
Code I am particularly proud of:
A part of the code I am particularly proud of is the draw_ background() function that created a smooth gradient for the background. In plain white the sketch looked dull and uninteresting but I believe the new gradient background has allowed each spiral color to ‘pop’.
//this function draws the background gradient going from dark blue to pink
function draw_background() {
  let c1 = color(60, 120, 200);  // navy blue shade
  let c2 = color(255, 182, 193);  // light pink shade
  //loop through each pixel row to create the gradient
  for (let y = 0; y <= height; y++) {
    let gradient_color = lerpColor(c1, c2, y / height);  //finds an in-between color for each pixel depending on height in the sketch
    stroke(gradient_color);  // color for the current row
    line(0, y, width, y);   // draws a line of that color
  }
}
Final Sketch:
Reflections:
I am happy with the results of this assignment. It is visually interesting, pleasing to look at and interactive but I do believe there is room for improvement. Another level of interactivity I hope to add is the spirals changing colors when hovered over or maybe when clicked upon. Another idea I had was the spirals morphing into different shapes based on user movement across the canvas. Overall I believe this assignment sets up a good basis for further development of this seemingly simple idea.
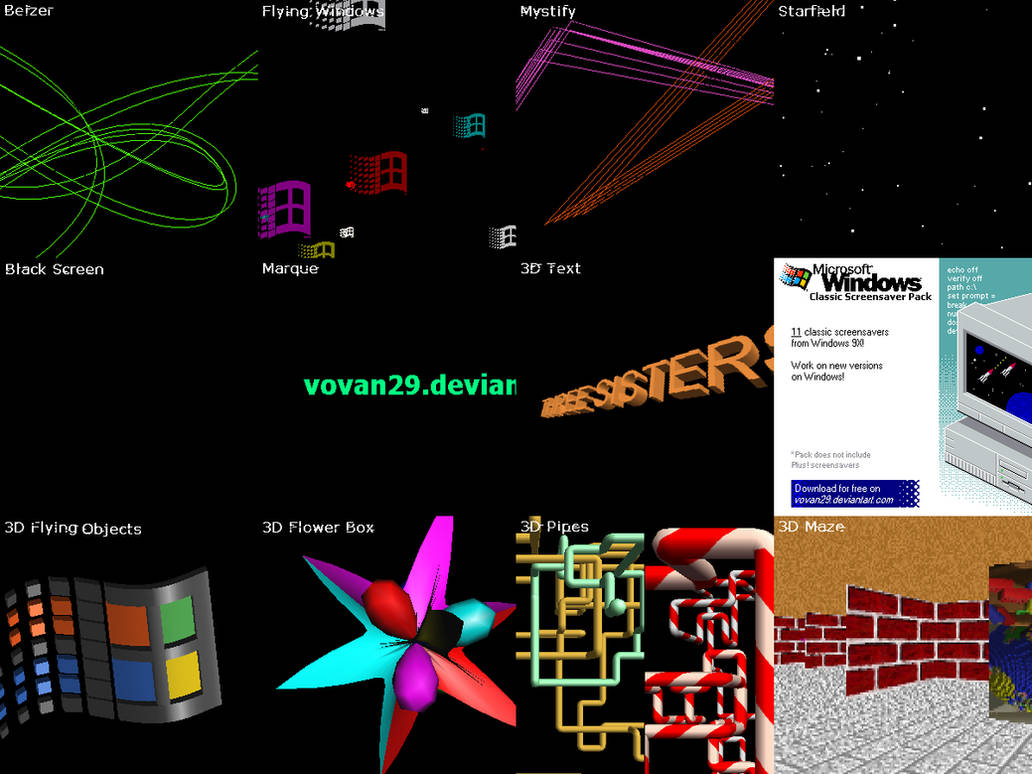
For this assignment, I drew inspiration from the the era of late 1990s and early 2000s. At that time, Windows 98 and Windows XP had some unique screensaveers which I still remember and which evokes a sense of nostalgia in me. These screensavers (link) often featured geometric shapes and repetitive, hypnotic patterns, such as oscillating lines, spirals, and pendulum-like movements.
Fig: Some of the Windows Screensavers
For this, I used robotic arms and “Inverse Kinematics” as my inspiration. From my point of view, I saw this as the perfect oppertunity to blend computational techniques into this visual style. The robot arms represent the pendulums of the past, but with a unique twist. Instead of being merely simple lines, these arms demonstrate the principles of Object-Oriented Programming (OOP), where each pendulum is treated as an independent object, following specific behaviors such as oscillation and length growth. Moreover, inverse kinematics allows each arm to dynamically respond to changing positions, mimicking the flexibility and precision of robotic motion. The result is a digital artwork that blends the nostalgia of retro visuals with the sophistication of modern computational design.
Code Explanation
“Arm” class
This class features a constructor which initializes each pendulum’s amplitude, angle, angle velocity, and length growth. It also has the “update()” function to update the pendulum’s length (amplitude) and oscillation (angle). Using the “display()” function, it calculates the current position of the pendulum and draws a line from the previous position.
// Defining the Arm class
class Arm {
  constructor(amplitude, angle, angleVel, lengthGrowth) {
    this.amplitude = amplitude;      // Initial length of the arm
    this.angle = angle;              // Starting angle
    this.angleVel = angleVel;        // Angular velocity
    this.lengthGrowth = lengthGrowth; // How fast the arm grows in length
  }

  // Method to update the arm's properties (growth and oscillation)
  update() {
    this.amplitude += this.lengthGrowth; // Increase length over time
    this.angle += this.angleVel;         // Update angle for oscillation
  }

  // Method to display the arm
  display(prevX, prevY) {
    let x = sin(this.angle) * this.amplitude;  // Calculate x position
    let y = cos(this.angle) * this.amplitude;  // Calculate y position
    line(prevX, prevY, x, y); // Draw line from previous position to current
    return { x, y };          // Return current x, y for the next arm
  }
}
“setup()” function
The “setup()” function initializes the canvas size and prepares the environment. It disables fills for the shapes and sets default stroke properties. It randomizes the number of pendulum arms (num_arms) and the other arm’s properties, with each arm receiving random values for amplitude, angular velocity, and growth rate. The arms are stored in an array, each represented as an object with properties for oscillation and growth.
function setup() {
  createCanvas(800, 800);
  noFill();
  stroke(255); // Initial stroke color
  strokeWeight(1); // Initial stroke weight

  // Randomize the number of arms between 2 and 10
  num_arms = int(random(2, 10));

  // Initialize the Arm objects with random values
  for (let i = 0; i < num_arms; i++) {
    let amplitude = random(70, 150);
    let angleVel = random(0.01, 0.05);
    let lengthGrowth = random(0.1, 0.5);

    // Create new Arm and push to the arms array
    arms.push(new Arm(amplitude, 0, angleVel, lengthGrowth));
  }

  // Initially set the center to an off-canvas position
  centerX = -1000;
  centerY = -1000;
}
“draw()” function
This function creates a semi-transparent background overlay to maintain the fading trails without fully erasing the canvas. The “rect()” draws a slightly transparent rectangle over the entire canvas, producing the trailing effect. The “translate()” function shifts the origin of the canvas to the clicked point (centerX, centerY), which acts as the center of the pendulum system. A loop iterates over each arm, calculating its new position based on its current angle and amplitude using “Inverse Kinematics.” The arms are drawn as lines connecting from one pendulum to the next, simulating the robot arm movement whos length increases with time.
// Draw Function
function draw() {
  if (hasStarted) {
    fill(0, 10); // Semi-transparent background to maintain trails
    rect(0, 0, width, height);

    // Set the center of the arms to the clicked position
    translate(centerX, centerY);

    let prevX = 0;
    let prevY = 0;

    // Loop through each arm and update and display them
    for (let i = 0; i < arms.length; i++) {
      let arm = arms[i];

      // Update arm properties
      arm.update();

      // Display the arm and update the previous position for the next one
      let newPos = arm.display(prevX, prevY);
      prevX = newPos.x;
      prevY = newPos.y;
    }
  }
}
“mousePressedI()” function
The “mousePressed()” function updates the center of the pendulum system to wherever the user clicks on the canvas (mouseX, mouseY). This triggers the pendulum animation by setting “hasStarted” to true. Upon clicking, it randomizes the stroke color, weight, and number of arms, creating variety and making each user interaction unique. It also reinitializes the pendulum arms with new random values, ensuring a different pattern is generated with every click.
// This function will run when the mouse is pressed
function mousePressed() {
  // Set the new center of the arm system to the clicked location
  centerX = mouseX;
  centerY = mouseY;
  hasStarted = true;

  // Randomize background and stroke properties
  stroke(random(0, 255), random(0, 255), random(0, 255));
  strokeWeight(random(1, 10));

  // Randomize the number of arms between 2 and 6
  num_Arms = int(random(2, 6));

  // Reinitialize the arms array
  arms = [];
  for (let i = 0; i < num_Arms; i++) {
    let amplitude = random(80, 150);
    let angleVel = random(0.01, 0.05);
    let lengthGrowth = random(0.1, 0.5);

    // Create new Arm objects with random values
    arms.push(new Arm(amplitude, 0, angleVel, lengthGrowth));
  }
}
Sketch
Further Improvements which can be made
– Smoother Transitions: Currently, the background might change too quickly when clicking. Adding a smooth transition effect between pendulum sets can make the animation more fluid and visually appealing.
– Scaling upto 3D space: I had originally though of introducing a responsive 3D canvas using “WEBGL” mode in p5.js, but that was making the idea of user interaction a little complex, so I had to drop that for now.
– Damping: Currently, the simulation runs the pendulums until another person clicks it. Introducing damping can be another way to introduce realism to it.
– Collission: Various arms when coming in contact with each other change their path/length can be another aspect which can be looked to.
Reflection
This project modernizes the retro screensaver aesthetic using modern programming techniques such as OOP and inverse kinematics, combined with user interactivity. The code is modular, making it easy to add new features or improvements, and the possibilities for further customization and expansion are vast.
Concept: I wanted to create a view of my home country, Bangladesh, which is filled with. hundreds of rivers, and with time the rivers are shrinking. So, I used this assignment to create something that represents the rivers from Bangladesh in a sunset light.
Code:
I’m particularly proud of the FluidSimulation and FlowingMotif parts of my code because they exemplify a thoughtful blend of creativity and technical skill. The FluidSimulation class captures the essence of fluid dynamics with its elegant use of vectors and noise functions to simulate realistic flow patterns. The display() method, with its precise rendering of flow lines, transforms abstract concepts into a visually engaging experience. This method doesn’t just draw; it visually narrates the movement of fluid in a way that is both aesthetically pleasing and scientifically intriguing.
Similarly, the getForceAt() method provides a crucial interface for interaction with the fluid simulation, enabling dynamic elements like particles to seamlessly integrate with the simulated environment. This capability is pivotal in creating a responsive and immersive visual experience.
The FlowingMotif class adds a touch of artistic flair to the simulation. By using dynamic shapes that evolve over time, it introduces an additional layer of visual interest and complexity. The carefully crafted constructor ensures that each motif is unique, with properties that allow for smooth and captivating motion. The motifs enhance the overall aesthetic of the simulation, bringing a sense of life and movement to the scene.
display() {
    noFill();
    strokeWeight(1);
    for (let y = 0; y < this.rows; y++) {
      for (let x = 0; x < this.cols; x++) {
        let v = this.field[y][x];
        let px = x * this.gridSize;
        let py = y * this.gridSize;
        stroke(255, 100);
        line(px, py, px + v.x * this.gridSize, py + v.y * this.gridSize);
      }
    }
  }

  getForceAt(x, y) {
    let col = floor(x / this.gridSize);
    let row = floor(y / this.gridSize);
    col = constrain(col, 0, this.cols - 1);
    row = constrain(row, 0, this.rows - 1);
    return this.field[row][col].copy();
  }
}

// FlowingMotif class definition
class FlowingMotif {
  constructor(x, y, size) {
    this.x = x;
    this.y = y;
    this.size = size;
    this.angleOffset = random(TWO_PI);
    this.frequency = random(0.01, 0.05);
  }
In the first chapter of Chris Crawford’s The Art of Interactive Design, I found myself engaged with the foundational ideas presented. From Crawford’s exploration into the nature of interaction as the core of design, one of the key takeaways for me was Crawford’s emphasis on interaction being the core of design. Before reading this, I often saw interactivity as an added feature rather than the fundamental aspect of the user experience. It was like a light bulb went off when he explained that interaction isn’t just about adding clickable elements but about making the whole design process revolve around the user’s actions and reactions. This perspective has made me question my approach to design—am I truly focusing on how users interact with my work, or am I just ticking off boxes?
I agree with him on the definition of interactivity. If I am creating an interactive device/art/product, I should always remember how four parameters, aka listening, speaking, thinking, and responding, work on my idea. I really enjoyed how he explained interactivity with examples, making it easier to even teach my 7-year-old brother about interactivity in technology.
Lastly, on the notion of traditional entertainment like movies being non-interactive, I think that might get shifted with emerging technologies. Digital media, including interactive films, virtual reality experiences, and even interactive web-based stories, demonstrate that interactivity can be a fundamental aspect of various media forms. The rise of these new media formats challenges the traditional notion that interactivity is limited to games or other explicitly interactive experiences.
The whole idea of interactivity and its distinction from mere reactions or participation stood out for me considering the focus of this course (Introduction to Interactive Media). As the text analyses interactivity insisting on dynamic exchanges between participants, requiring active listening, thoughtful consideration, and responsive speaking, I realize the importance of these elements. As an artist, I aim to integrate emotional aspects of my designs, considering how my audience will hear, think, and speak as they interact with my work. Beyond artistic experiences and designs, I also hope that computer systems and programs continue to evolve becoming more interactive as we evidently see it bloom day by day through the advancement of generative AI and other technologies.
While interactivity involves listening, thinking, and speaking, its application might be challenging or unnecessary in some contexts within computer systems and applications. I hope that the level of interactivity required be only tailored to the specific needs and goals of the system or application.
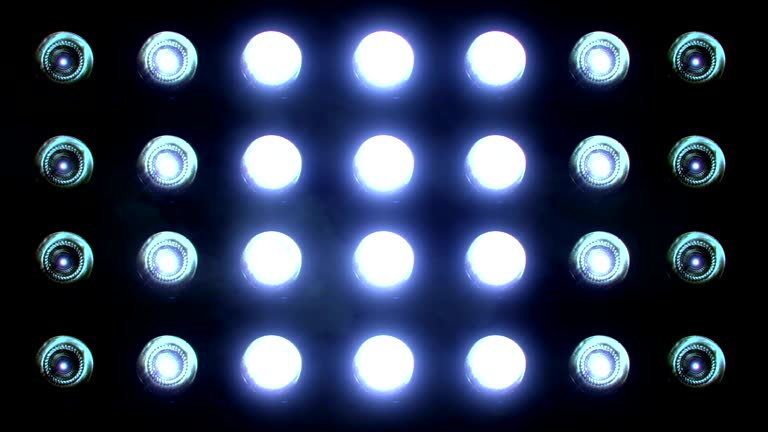
For this week, as I was looking forward to make use of arrays and object oriented programming, I wanted to draw lights that smoothly turn on and off. My idea has inspiration from disco lights that blink turning on and off. An image of such an arrangement of lights can be seen here below:
The alternation of black and white colour are intended to create an illusion of lights turning on and off.
Implementation
To implement my idea, I created two classes one for the boxes and one for the circles. I had functions to draw the boxes and circles in each class and created the objects in the setup function and saved the locations of each in an array. In the draw function I used the arrays to draw the boxes in the canvas.
The inspiration for using balloons in this project came from a Chelsea football match I watched on Saturday, September 14. During the game, my team struggled to score until a substitute player finally found the net. In his celebration, he blew up a balloon, which sparked the idea to create a project centered around balloons. I wanted to capture that moment of excitement and celebration by translating it into an interactive experience where each balloon expands and changes color when clicked. My goal was to apply the programming concepts I’ve learned so far to build something creative and playful using balloons.
The project is built using p5.js and applies Object-Oriented Programming (OOP) to create interactive floating balloons. A `Balloon` class is defined, with properties like position, size, color, and growth rate. Each balloon floats upwards and resets when it reaches the top of the canvas. On each mouse click, the clicked balloon changes color and expands by a set amount.
The `setup()` function initializes an array of balloons with random attributes, while the `draw()` function continuously updates and displays the balloons. The `mousePressed()` function checks for clicks and triggers balloon growth and color changes. This structure efficiently demonstrates object interaction, animation, and user engagement with OOP principles.
Highlight
One aspect of the code that I enjoyed implementing was the incremental growth of balloons on each mouse click. Instead of making the balloon instantly expand to a large size, I wanted to ensure each click resulted in a smooth, controlled increase. To achieve this, I implemented the grow() and clicked() methods within the Balloon class. This is the code that shows the highlight:
  // Incrementally expand the balloon when clicked
  grow() {
    this.balloonSize += this.growthAmount;  // Increase size by a fixed amount per click
  }

  // Check if the balloon is clicked
  isClicked(px, py) {
    let d = dist(px, py, this.x, this.y);  // Distance from mouse to balloon center
    return d < this.balloonSize / 2;  // Check if mouse is inside the balloon
  }

  // Change color and grow when clicked
  clicked() {
    this.color = color(random(255), random(255), random(255));  // New random color
    this.grow();  // Incremental growth with each click
  }
}
Embedded Sketch
Future Reflections and Ideas for Future Work
Looking ahead, there are several ways I could improve and expand upon this project. One idea is to implement a balloon popping mechanic, where balloons could “pop” after reaching a certain size, adding another layer of interaction and completion. This could involve sound effects to make the interaction even more satisfying and immersive for the user.
Additionally, I could introduce different behaviors for each balloon, such as varying floating speeds or randomized directions, to make the scene feel more dynamic. Another potential improvement would be to add more complex user interactions, like dragging balloons or having them respond to other inputs such as keyboard presses.
Finally, I’d like to explore using advanced animations to create a more gamified experience. These ideas could help make the project more engaging and add more variety for the user.


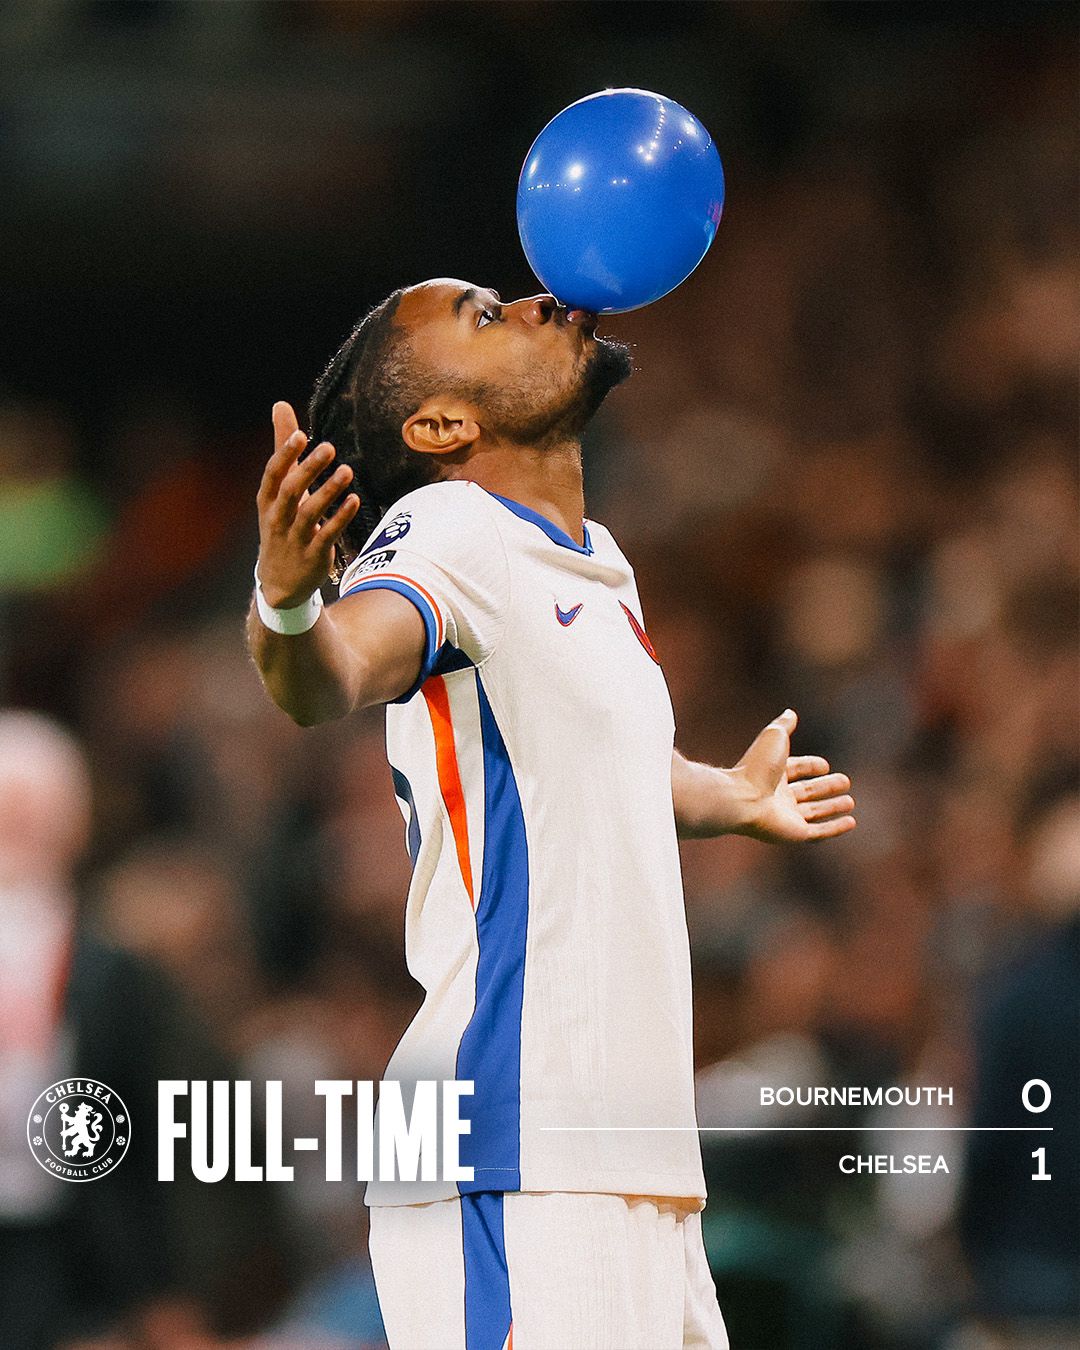 Christopher Nkunku, the chelsea Player who scored the only goal of the game and did his iconic balloon celebration.