Assignment 4: Data Visualization and Generative Text | Midterm Idea

I wanted to do data visualization for this assignment, but I used the words in my csv to add to the visualization as well. The file I used is an excel spreadsheet of my spendings from a semester in New York City. I had five values: date, amount spent, category, payment method, memo. I mainly used amount, category and memo.

Coding Process

I began by following the same process that we did in class for the wind turbine example.

function draw() {
  background("#394053");
  noStroke();

  title();

  //separate each row of the csv into another array
  // put the array here instead of set up b/c when I tried to access singleRow[1] outside of the loop it didn't show the correct value
  for (let csvRowNumber = 4; csvRowNumber < strings.length; csvRowNumber++) {
    singleRow = split(strings[csvRowNumber], ",");
    text(singleRow[MEMO], random(width), random(70, height));
    ellipse(
      random(25, width - 25),
      random(90, height - 25),
      float(singleRow[AMOUNT] * 2.5)
    );
    noLoop();

    fillCircles();
  }

The difference is that I put the for loop in draw rather than setup. I tried using singleRow outside of the loop, but it would only give the last line in the strings array, so I have to do most of the “drawing” inside the loop as well.

I also had another function specifically for filling the circles, because it was just a bunch of if statements. I used the category column in my csv file to correlate the colors to the amount. So the size of the ellipse is based on the amount while the color is based on the category.

I felt like it was a bit empty, so I added the memo text as well. I wanted it to be transparent and in the background, but it didn’t really work out the way I wanted it to.

Future Improvements and Ideas

I have quite a lot of improvements and ideas for this assignment. Currently, it looks really busy and messy, so I want to make it less crowded and more of an “organized mess”. I also wanted to add lines connecting the ellipses to each other using the date, but I wasn’t sure how because 1) I would need to use points instead of ellipses, 2) I would need to know the coordinates and 3) I can’t use the date because it’s not formatted like an integer or float. One idea I had was using map() for the dates to correlate with where the circles are. But the problem was figuring out how to connect the ellipses with a line when I don’t know the x and y, since it’s random…

Another idea I had was was to place the ellipses in random spots but with no overlaps. I watched a video on how to do this and I attempted it using class, but it didn’t work out. So this is something I would like to work on in the future as well.

Overall, I personally feel like working with a csv file is harder than working with JSON. I’ve done a data visualization before with JSON, so it was interesting to try a different method of using files in javascript.
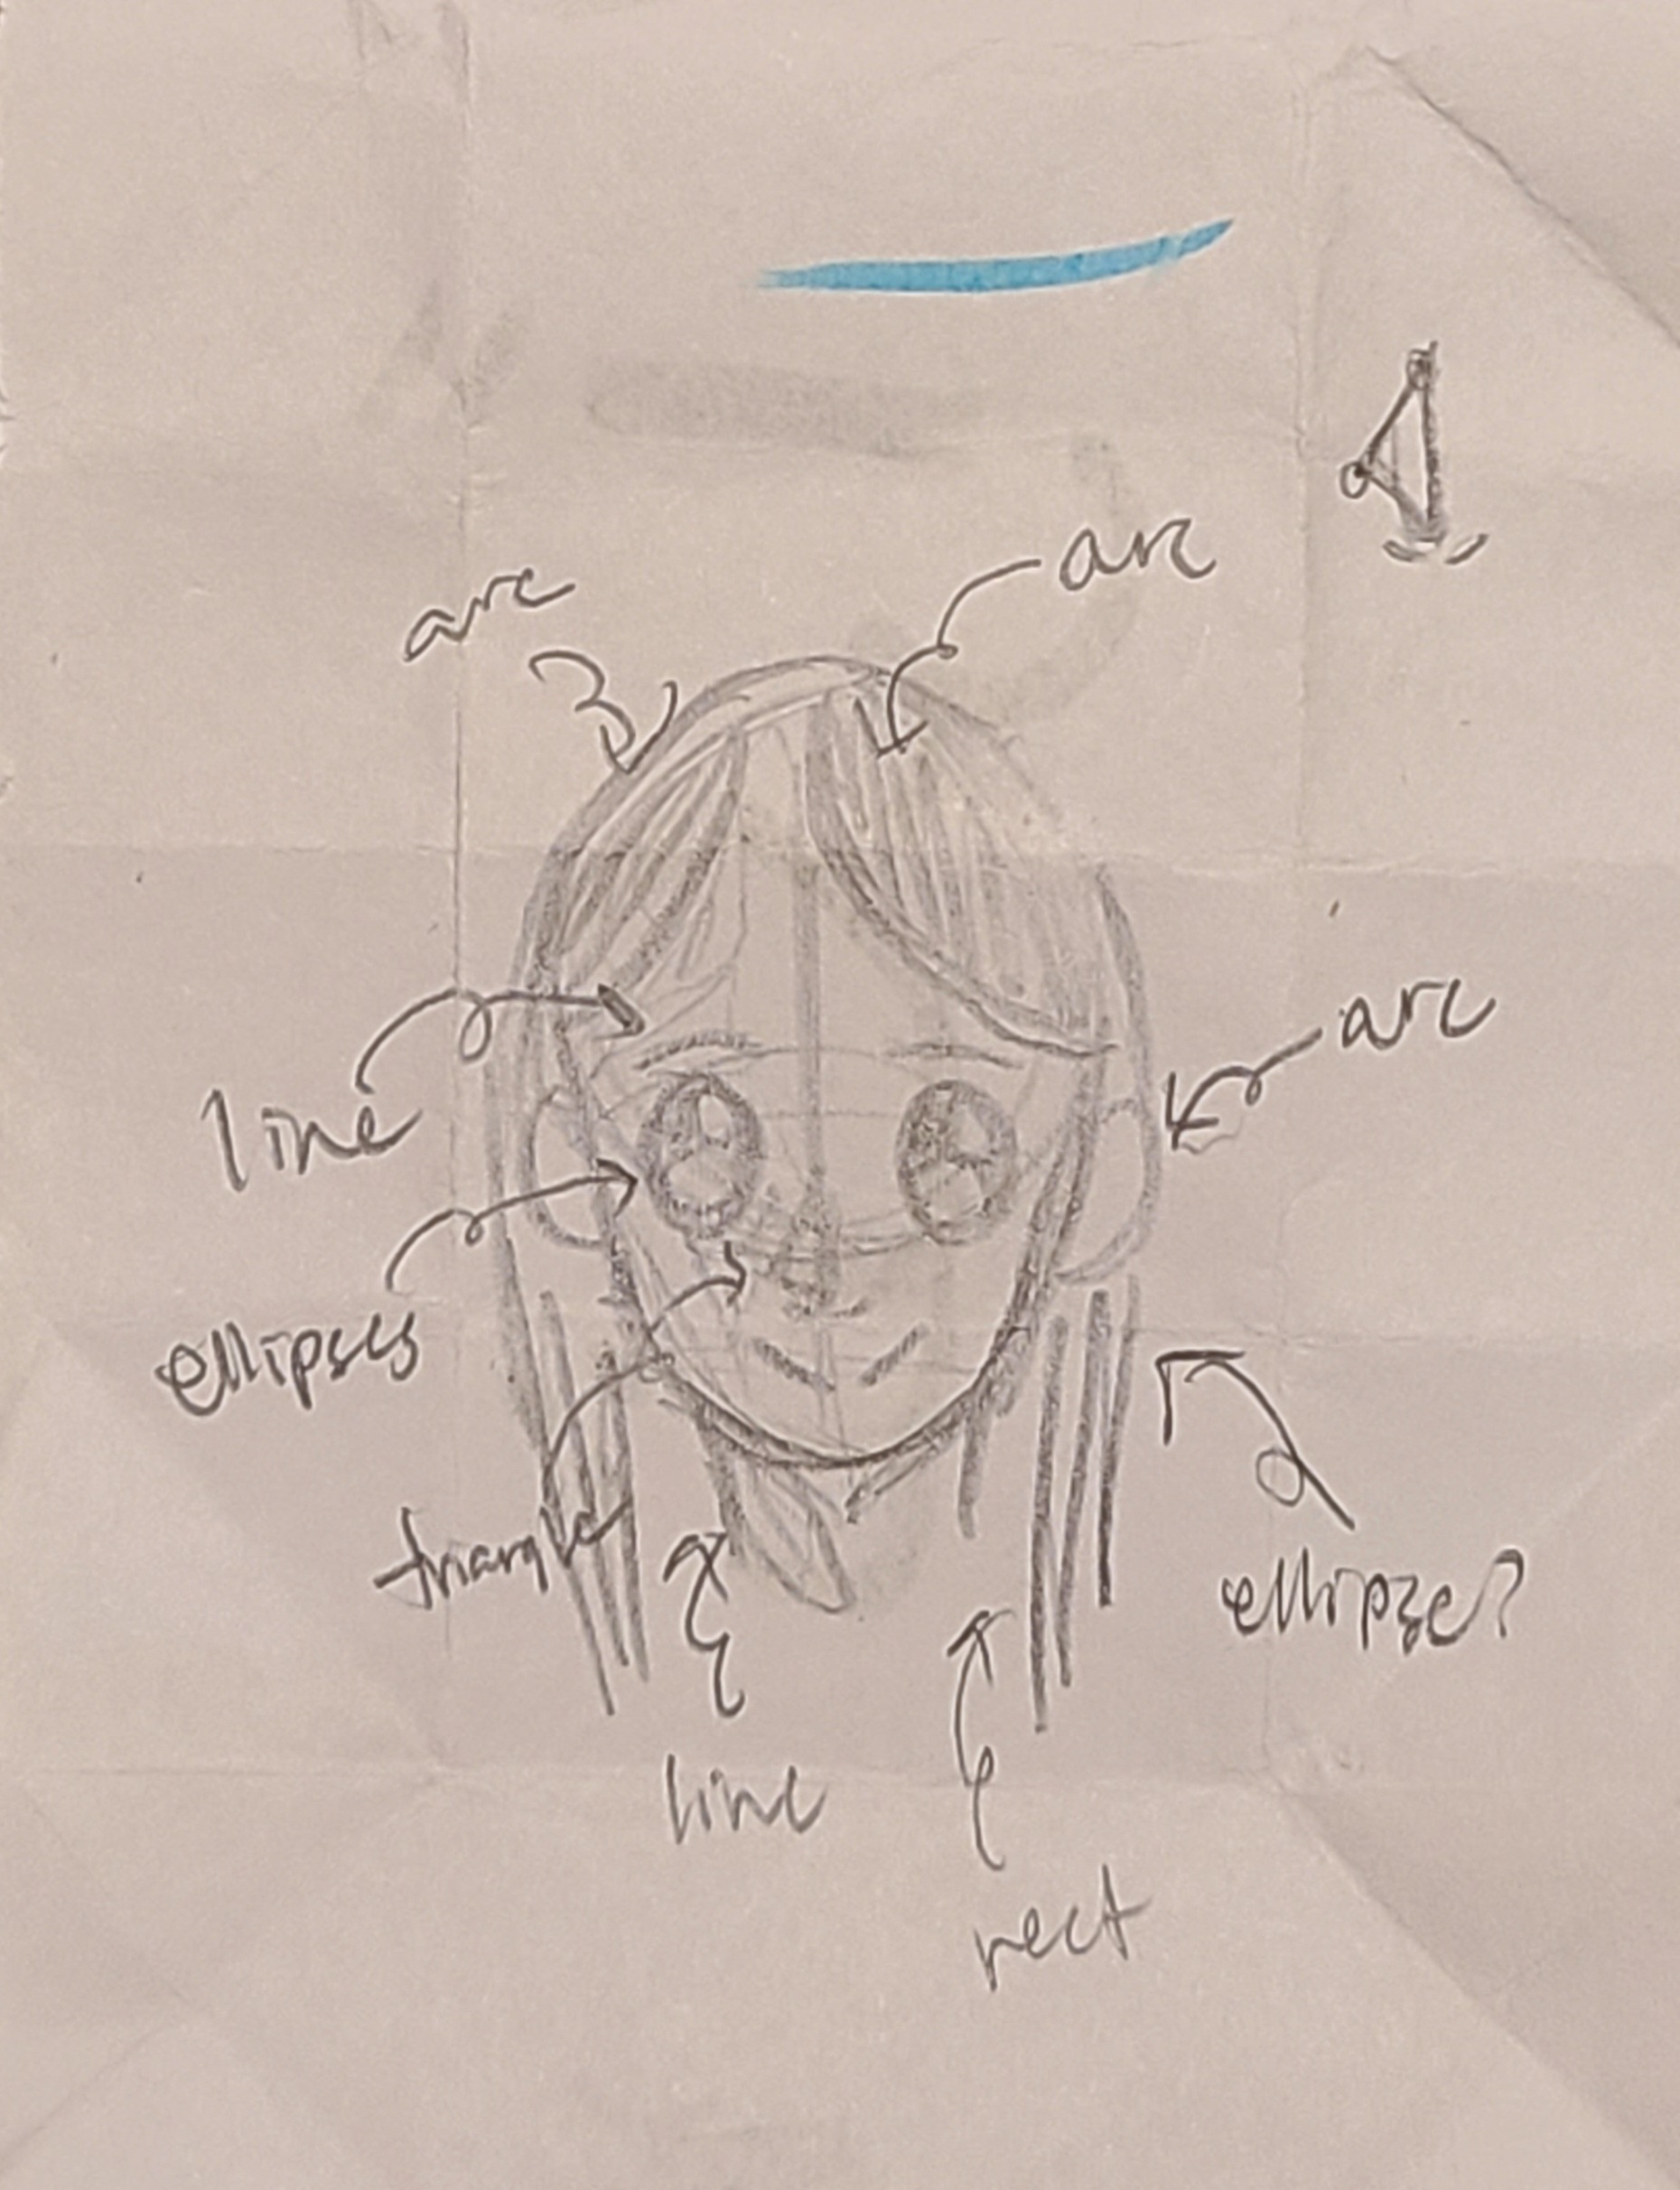
Midterm Idea

My idea for the midterm project is to do something similar to i-Spy. The things necessary for this idea are:

      • Mouse clicking on the image that the user needs to look for
      • Uploading images
      • Checking for if the user picked the right image
      • Sound effects for when the user correctly finds the object
      • Counter for the objects found
      • Restarting the game

Assignment 3 – OOP

For this assignment, I decided to create a tree with flowers. I struggled a lot with what I wanted to do for this assignment. Since I didn’t have a starting point or any idea what I wanted to do, I spent a lot of time trying to figure out what I wanted to create. This also led to me changing my mind numerous times (there are 4 versions of this assignment, the first 3 are incomplete because I kept changing my mind with what I wanted to do).

Coding Process
show() {
    for(let i = 0; i < 3; i++) {
      ellipse(this.pointX[i], this.pointY[i], 10);
    }
    
    beginShape();
    vertex(this.vertexX, this.vertexY);
    for(let i = 0; i < 10; i++) {
      bezierVertex(this.pointX[i], this.pointY[i], this.pointX[i+1], this.pointY[i+1], this.pointX[i+2], this.pointY[i+2]);
    }
    endShape();
  }
}

The code above is part of the v1 of assignment 3. I wanted to tackle bezier curves, but it didn’t end up quite the way I wanted. I watched a few videos explaining how it worked, but I was still kind of confused so I decided to just experiment with it. I tried to shortcut my way around writing multiple points by using for loops, but when I wrote the code to create the shape, I got an error about the variable scope. Therefore, I decided to give up on this “shortcut” and try something else.

The ellipse placements reminded me of a galaxy, so my next version was an attempt to create galaxy art. I originally wanted the stars to twinkle by changing the alpha of the color and I also wanted to make the stars grow and shrink. I also wanted to create the galaxy cloud effect somehow and add some shooting stars. However, I realized that this idea was a bit too ambitious, and during the process of making the stars grow I had another idea.

The final idea was to create a tree with growing flowers. For some reason, as I was playing around with the “breeze” blowing the flowers, I started to make it flowers falling off a tree. Here is the code:

breeze() {
   if (this.pointX < this.pointX + 50) {
     this.pointX += random(-1, 1);
     this.pointY += 0.75;
   }
 }

But for the final version, I decided to make the flowers grow and shrink. I made the flowers arcs instead of ellipses because I felt like it was more interesting to see different compared to different sized ellipses.

The fractal tree I got from this example. I also watched The Coding Train video on fractal trees, but I mainly used the tree by Yuan Hau. I tried to experiment with the tree by changing the strokeWeight() and angle, but I didn’t keep those changes. This will be part of my future improvements and ideas.

Future Improvements and Ideas

One thing that I found interesting was changing the angle of one side of the branches. This created a bent tree, which I thought would have been cool to work with. However, I wasn’t sure how to bound the flowers to the shape of the tree. What I did was restrict it to a box by using random(), but it doesn’t fit the shape of the tree. For improvements, I want to figure out how to make the flowers follow the shape of the tree.

To add more improvements to the tree, I feel like it looks too mathematical and organized. So, for the future I want to make it have different thicknesses in the branches, different angles, and different lengths in the branches. I did try to experiment with these three things, but with the experiments I crashed my program several times…

One thing I had an issue on with all four versions was choosing a random color. For example, for v4 I wanted a random color for each individual flower, but my code randomly picks one color from the array once for all the flowers. The color will change every time you run the program though. Since I have a specific set of colors, I put it into an array:

flowerColors = ["#EC275F", "#F25477", "#E476A6", "#F3868C"];
let oneFlower = [];

function setup() {
  createCanvas(550, 550);

  pickAColor = floor(random(flowerColors.length));

The code above is the bit that creates a variable to pick a random element in the array. This is the link to the reference I used to figure out how to use floor() (actually I used a different reference, but my very first sketch crashed before I saved so I lost the reference).

show() {
   this.color.setAlpha(200);
   fill(this.color); //how to make each individual flower have a different, random color?
   arc(
     this.pointX,
     this.pointY,
     this.size,
     this.size,
     this.arcPt1,
     this.arcPt2
   );
 }

The code above is in my class Flowers, where I fill the color of the flower and change the alpha to be more transparent. I tried to use a loop, but that didn’t work. So this is another aspect that I want to improve in the future.

Finally, I want to work on is the breeze. Currently, it doesn’t look as smooth as I want it to look. I feel like to do this, I would need to incorporate some physics and more math.

Overall, while I’m not totally satisfied with how the final code ended up looking, I did try to experiment and take risks with this assignment, which is a win.

Assignment 2 – Loops

If you keep watching the numbers until they fill up the whole canvas, you will see a surprise!

The concept I was going for in this assignment was Matrix themed. Originally, I wanted to have a different work of art for “out of the Matrix” and “stay in the Matrix”, but I ended up just doing something simple instead.

Process + Highlight

The whole process of making this was similar to the self portrait; there was a lot of trial and error. Essentially, I just experimented until I got something I liked.

I started off with a black background and added green ellipses that were slightly transparent. I later changed it to rectangles. I tested different transparencies and sizes before I settled for the final look. random() is my favorite method to use because I don’t have to make a choice and it’s interesting to see how the “art” changes each time you run it (also you will see how often I use random() in this assignment).

function matrixNumbers() {
  fill(0, 143, 17);
  textFont("Courier New");
  textSize(20);
  
  if(random(2) < 1) {
    text("0", textPosX, textPosY + spacing); 
  } else {
    text("1", textPosX + spacing, textPosY);
  }
  
  textPosY = textPosY + spacing;
  if (textPosY > height) {
    textPosY = 0;
    textPosX = textPosX + spacing;
  }
}
Organized numbers, but there was an offset on the left

The one thing I was certain I was going to do was the numbers appearing down the screen. At first, I had the numbers in an organized fashion by having textPosX + spacing and textPosY + spacing in both the if and else statements. Then I changed it to the code above, which staggered and stacked the numbers, which I felt was more interesting than a grid-like fashion. I also realized that globalizing the variables will create the dynamic aspect of the numbers showing up one by one. At first I just put the variables in the function, but this just stacked 0 and 1 in the corner (I think this happens because when you keep it in the function it changes once, whereas when you globalize it, the variable changes every time the function is called in draw?)

This code was actually taken from a previous p5 assignment I did, but I modified it to fit the Matrix number pattern:

A 10Print assignment I did for another class

This isn’t really related to loops, but I really like how the pills appeared after the numbers finish appearing on the screen. I experimented with setAlpha() to make the pills and text appear gradually. I got this code from the reference, but I modified it because I didn’t need it to go constantly go from opaque to transparent. Originally, I followed the reference and did sin(millis() / 1000), but it didn’t work the way I wanted it to, so I looked at the reference for just millis() and realized that I didn’t need the sin().

I wanted the red pill and blue pill to contrast each other in terms of the shapes used. So for the red pill, I wanted to use arcs, but I didn’t really like how the empty space looked, so I used circles and adjusted the transparency. For the blue pill, I wanted it to be like pixel art. Again, I used random so the colors would be different each time. I originally had the squares larger, but the smaller it was, the more intense the pixel effect was so I kept it small.

Future Improvements and Ideas

Currently, I’m kind of cheating with how the red pill and blue pill works. This is the code:

if (mouseIsPressed && mouseX < width / 2) {
    noLoop(matrixNumbers());
    redPill();
  }

  if (mouseIsPressed && mouseX > width / 2) {
    noLoop(matrixNumbers());
    bluePill();
  }

So no matter where on the canvas, as long as it’s less than half of the width, it will take you to the red pill. Similarly for the blue pill, as long as it’s more than half of the canvas width it will change. Therefore, even before the pills appear you can click to see either the red pill or blue pill “art”. I was thinking of using dist(), but I was a bit confused as to how with a rectangle. Additionally, since my code doesn’t include a way to go back to the numbers screen, once you click on one side you would have to restart the program in order to see the other pill. I’d like to say this was an intentional design because once you pick one, you can’t go back. However, since the mouse press range isn’t only within the two pills, if you accidentally click somewhere it will take you to either pill drawings.

I want to add more dimension to the red pill and blue pill drawings, such as lines or curves drawing over it, similar to what Casey Reas does. Actually, the more I look at the arcs version of the red pill art, the more I like how random it is. So another future idea might be combining the current, organized version with the arcs. For example, make the circles change into arcs using millis() and loop that, similar to what the reference for setAlpha() does.


Assignment 1 – Self Portrait

Concept

For my self portrait assignment, I decided to go with a simple cartoon-y style. I was kind of inspired by anime style art, so I sketched out how I wanted my final result to look like on a piece of paper:

It didn’t really turn out like that sketch, but the overall idea was still followed through. I mainly used ellipses and arcs. Originally, I was going to go for just my head, but I decided to add a neck and shoulders to add a more to the self portrait element. There was a lot of guessing and adjusting with this assignment, such as the eyes and the hair. Additionally, I wanted to add some sort of interactivity, so I made the blush appear if the mouse X-position was within the face. I feel like with this, it makes it a bit more fun as opposed to just having the blush there statically.

Highlights

The part I struggled the most with was my bangs, but it turned out to be what I’m most proud of in the assignment because it took perseverance and a lot of trial and error to get it to look like the way I wanted it to.  At first, I tried to use bezierVertex(), which was in the shapes section of the reference. However, it was really hard to understand where to put the points to make the shape I wanted. It also took a lot of guessing and still didn’t turn out the way I wanted.

The second method I tried was doing two ellipses for the bangs and a rectangle for my hair. I had to add another ellipse for the top of my head or else it would look like I was bald. The rectangle for my hair was perfectly fine, but I still wasn’t completely satisfied with the look and shape of my bangs.

So the final shape I tried was the arc for my bangs. I used arc for my eyebrows as well, so I feel like I should’ve done this method first but I wanted to experiment with bezierVertex(). The arcs were a bit tedious because it was a lot of guessing where each side of the bangs would be positioned. I also had to adjust the arc shape, width, and height multiple times before I got the final product.

Reflection and Future Directions

A future improvement or idea I want to incorporate is a blinking animation when the mouse is pressed. I would also like to add different facial features, such as anger or sadness. Right now, the background is also quite plain so it would be nice to add something else to it, for instance a landscape or abstract art. Overall, since I’ve done p5 in the past, this was a nice refresher and a fun assignment.