Week 5: Midterm Progress Report

Concept:

I have been playing “Survivor.io” as a leisure game whenever I have free time or in-between classes just to pass the time. This game is a small mobile based game with the objective of surviving waves of attacks from a swarm of enemies that approach you and inflict damage when they touch you. We are given with a basic weapon in the beginning which we upgrade as we kill the enemies and survive the wave. The objective of the game is to farm weapons and survive for the longest time possible. I thought of implementing this game in p5js as my midterm project.

Survivor.io - Apps on Google Play

I have made quite a progress with my game by implementing the following features:

  1. A starting screen which describes the objective of the game.
  2. A playing screen where the player can control a character and kill minions. For now, the players, minions and weapons are just blobs with color.
  3. A game over screen where the time the player endured the waves is shown with a “Play Again” button.

Most Terrifying Part:

The most frightening part of the code so far was the collision detection of the “weapon & minions” and “minions & player” and killing the minions or the player when enough collision is made. The confusion lied on how to detect collision for all the minions and all the weapons. The solution I came up with is as follows:

  1. Weapons & Minions: I would detect the collision in the Minions class. Then we consider all the Arrows for the current minion. We call this detectArrowHit in the Minions class for all the minions in the minions array.
  2. Minions & Player: The same concept was applied for this collision, except the collision algorithm is implemented in the Player class, where we consider all the Minions present in the minions array.

As for the effects of the collision, I am still working on it and fine-tuning the effects of the collision. For now, I delete the minion which are hit from the minions array.  In doing so, it brings the problem of indexing in the minions array which is used to identify a minion in the canvas.

Future Progress and Reflection:

So far, the project is going smooth with all the bugs that I encountered getting solved fairly quickly. Here are a few things I need to work on:

  1. Sound track for the entire game.
  2. Sound effects for weapon firing, minions and player dying.
  3. Power-up for the player when it gets very hard to survive.
  4. Mechanism to regain health when certain criteria is matched.
  5. Images for the player, minions and weapons

The code is getting longer and longer very quickly, so I will probably divide the code into more JS files, just to make everything readable and understandable.

Week 4: Data Visualisation (Udemy Course Data)

Concept

I found a dataset on Udemy courses on the Kaggle database, which stored the data such as course rating, course duration, course price, and many more. However, I was focused on three of these variables. I quickly browsed through the data and decided to use it to create a scatterplot or three variables. One of them would represent the x-axis, while another one would populate the y-axis, and for the third variable, it would be plotted as the size of the point. This would essentially create a 3-dimensional scatter plot in a 2D graph.

The scatter plot can then be used to find correlation between the three variables and all the six combinations of two variables from three. Some of the observations that can be made from this data visualisation is discussed below.

Procedure

There are a series of steps I followed to reach my end result. Note that: Each blob is an object and has its own attributes.

  1. Data Collection/Retrieval: I got the data set titled “Udemy Courses – Top 5000 Course 2022” from Kaggle. However, I only used about 2000 rows of data as it was faster to load, the code can be scaled to utilise all 5000 rows of data, if necessary.
  2. Data Cleaning: In this phase, I looked at the columns of data that the plot would concern with, namely reviews_avg (course rating), course_duration, and main_price. All of theses columns were in a string format with embedded numbers in them. For instance, the course rating was stored as “Rating: 4.6 out of 5.0“. I split each data point, and extracted the relevant number.
    function getRating(ratings) {
      // stores ratings in floating numbers
      let rating = [];
      max_rating = 0;
      
      // cleaning the data to extract numbers from strings
      for (let i = 0; i < len; i++) {
        let rating_array = ratings[i].split(" ");
        rating[i] = parseFloat(rating_array[1]);
        
        // extracting the maximum rating
        if (max_rating < rating[i]) {
          max_rating = rating[i];
        }
      }
    
      return rating;
    }
    
    function getDuration(durations) {
      // stores duration in floating numbers
      let duration = [];
      max_duration = 0;
      
      // cleaning the data to extract numbers from strings
      for (let i = 0; i < len; i++) {
        let duration_array = durations[i].split(" ");
        duration[i] = parseFloat(duration_array[0]);
        
        // extracting the maximum duration
        if (max_duration < duration[i]) {
          max_duration = duration[i];
        }
      }
      
      return duration;
    }
    
    function getPrice(prices) {
      // stores duration in floating numbers
      let price = [];
      max_price = 0;
      
      // cleaning the data to extract numbers from strings
      for (let i = 0; i < len; i++) {
        let price_array = prices[i].split(" ");
        price[i] = price_array[2];
        
        // ignoring any values that is not present
        if (price[i] == undefined) {
          continue;
        }
        
        // the number in string had comma, e.g. 1,399.99. This portion removes the comma and converts the string into a floating number
        let temp = price[i].slice(2).split(",");
        if (temp.length == 2) {
          // the price was only in thousands, so there is only one comma in each price data
          price[i] = parseFloat(temp[0])*1000 + parseFloat(temp[1]);
        } else {
          price[i] = parseFloat(temp[0]);
        }
        
        // extracting the maximum price
        if (max_price < price[i]) {
          max_price = price[i];
        }
      }
    
      return price;
    }

    The above code shows how the data cleaning was done.

  3. Normalised Values: I normalised the value in each data variable to fit the canvas. This was achieved by comparing each data with its respective maximum data for each variable and multiplying by the some factor of width, height and size. The portion of the code used to normalise the values is as follows:
    // normalizing the data to fit into the canvas
        
    // Price is used on the x-axis, while rating is used on the y-axis
    let xPos = this.price / max_price * (width/1.1);
    let yPos = this.rating / max_rating * (height*2) - height*1.1;
        
    // the duration of the course determines the diameter of the circle
    let diameter = this.duration / max_duration * 200;
  4. Displaying: Notice from the above code snippet, that the prices is used as the x-coordinate, rating is used as the y-coordinate, while duration is used as the diameter for the blob/circle that would be plotted on the canvas. This decision for the axises was made with hit-and-trial as I tried various combination, and chose which appeared to be the most aesthetic.
  5. Interactivity: As part of the interactivity, I added in a hover function to the blob, such that the name, price, rating and duration of the course gets displayed when you hover over any of the blobs in the plot. I implemented this using show_description() function in the class as such:
    show_description() {
      // displays the information about the course when hovered on the blob
      if ((mouseX <= this.xPos + this.diameter/2 && mouseX >= this.xPos - this.diameter/2) && (mouseY < this.yPos + this.diameter/2 && mouseY > this.yPos - this.diameter/2)) {
        if (mouseX > width/2) {
          textAlign(RIGHT, CENTER);
          fill(123);
          rect(mouseX - 520, mouseY - 10, 520, 80);
        } else {
          textAlign(LEFT, CENTER);
          fill(123);
          rect(mouseX - 20, mouseY - 10, 520, 80);
        }
    
        fill("#eeeeee")
        text(this.name, mouseX - 10, mouseY);
        text("Price: "+this.price+ " USD", mouseX - 10, mouseY + 20);
        text("Rating: "+this.rating + "/5.0", mouseX - 10, mouseY + 40);
        text("Duration: "+this.duration + " hours", mouseX - 10, mouseY + 60);
      }
    }

Observations that can be made

There are a couple of interesting observations we can make from the data:

  1. There appears to be no apparent correlation between the price of the course and the course rating. It is interesting there is not much information to conclude that as the course rating increasing, the price increases with it, which is supposedly a common belief.
  2. Notice that the biggest blobs are mostly on the bottom right of the graph, suggesting that the course with have a longer duration also are more costly and also have a higher rating.
  3. However, most of the courses that are short have lower price and a rating that is distributed.

Future Improvements

It appears that the data set stores Udemy Courses have a high average rating which might make the observations on the data biased towards higher rated courses and might not provide definite conclusion about the entirety of Udemy course libraries. So, an improvement would be on the data collection where we can randomly sample a few thousand courses from the entire Udemy course library to maintain a proper distribution of the entire population/sample space.

Week 3: Generative Art using OOP

Concept

For this assignment, I was inspired by the piece we looked in class by Manfred Mohr, titled “space.color.motion”, that showed the projection of higher dimension object in 2D.
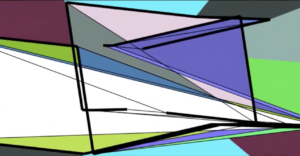
Link to the artwork: space.color.motion

I did not implement any mathematical functions, simply because I am not aware of them, but I tried mimicking the actions of the shape. It did turn out to be completely different, but the properties of the shapes are somewhat retained in my approach like the overlapping of shapes onto the other and the change in shape. Some properties I added in was the varying opacity of the shape color and the rotation of the shapes.

Code

As part of the requirement for the assignment, I used a class called Shape which has parameters that represent four points for a quadrilateral. These points are random and create a random quadrilateral on the canvas. The display() function creates the quadrilateral and fills in a random color and a random stroke weight to the shape. The color has varying opacity, which I implemented through the .setAlpha in-built function for color. Finally, the rotate_() function rotates the shape with the axis of rotation at position (0, 0).

class Shape {
  constructor() {
    // the shape is a quadrilateral, so require four points.
    // these points are random and one is in the range of 'vary' with respect to one another.
    this.x1 = random(width);
    this.y1 = random(height);
    this.x2 = random(this.x1 - vary, this.x1 + vary);
    this.y2 = random(this.y1 - vary, this.y1 + vary);
    this.x3 = random(this.x2 - vary, this.x2 + vary);
    this.y3 = random(this.y2 - vary, this.y2 + vary);
    this.x4 = random(this.x3 - vary, this.x3 + vary);
    this.y4 = random(this.y3 - vary, this.y3 + vary);
    
    // random color for the shape.
    this.clr = color(random(255), random(255), random(255));
    
    // random stroke weight for the shape
    this.strWeight = random(2, 7);
    
    // changes the opacity of the shape to a random value. Gives a glass-like illusion to the shape
    this.clr.setAlpha(random(255));
  }
  
  display() {
    strokeWeight(this.strWeight);
    fill(this.clr);
    
    // Creating a quadrilateral.
    quad(this.x1, this.y1, this.x2, this.y2, this.x3, this.y3, this.x4, this.y4);
  }
  
  rotate_() {
    // stops the rotation when the mouse is clicked as the angle becomes constant
    if (!mouseIsPressed) {
      angle+=0.00001;
    }
    rotate(angle);

  }
}

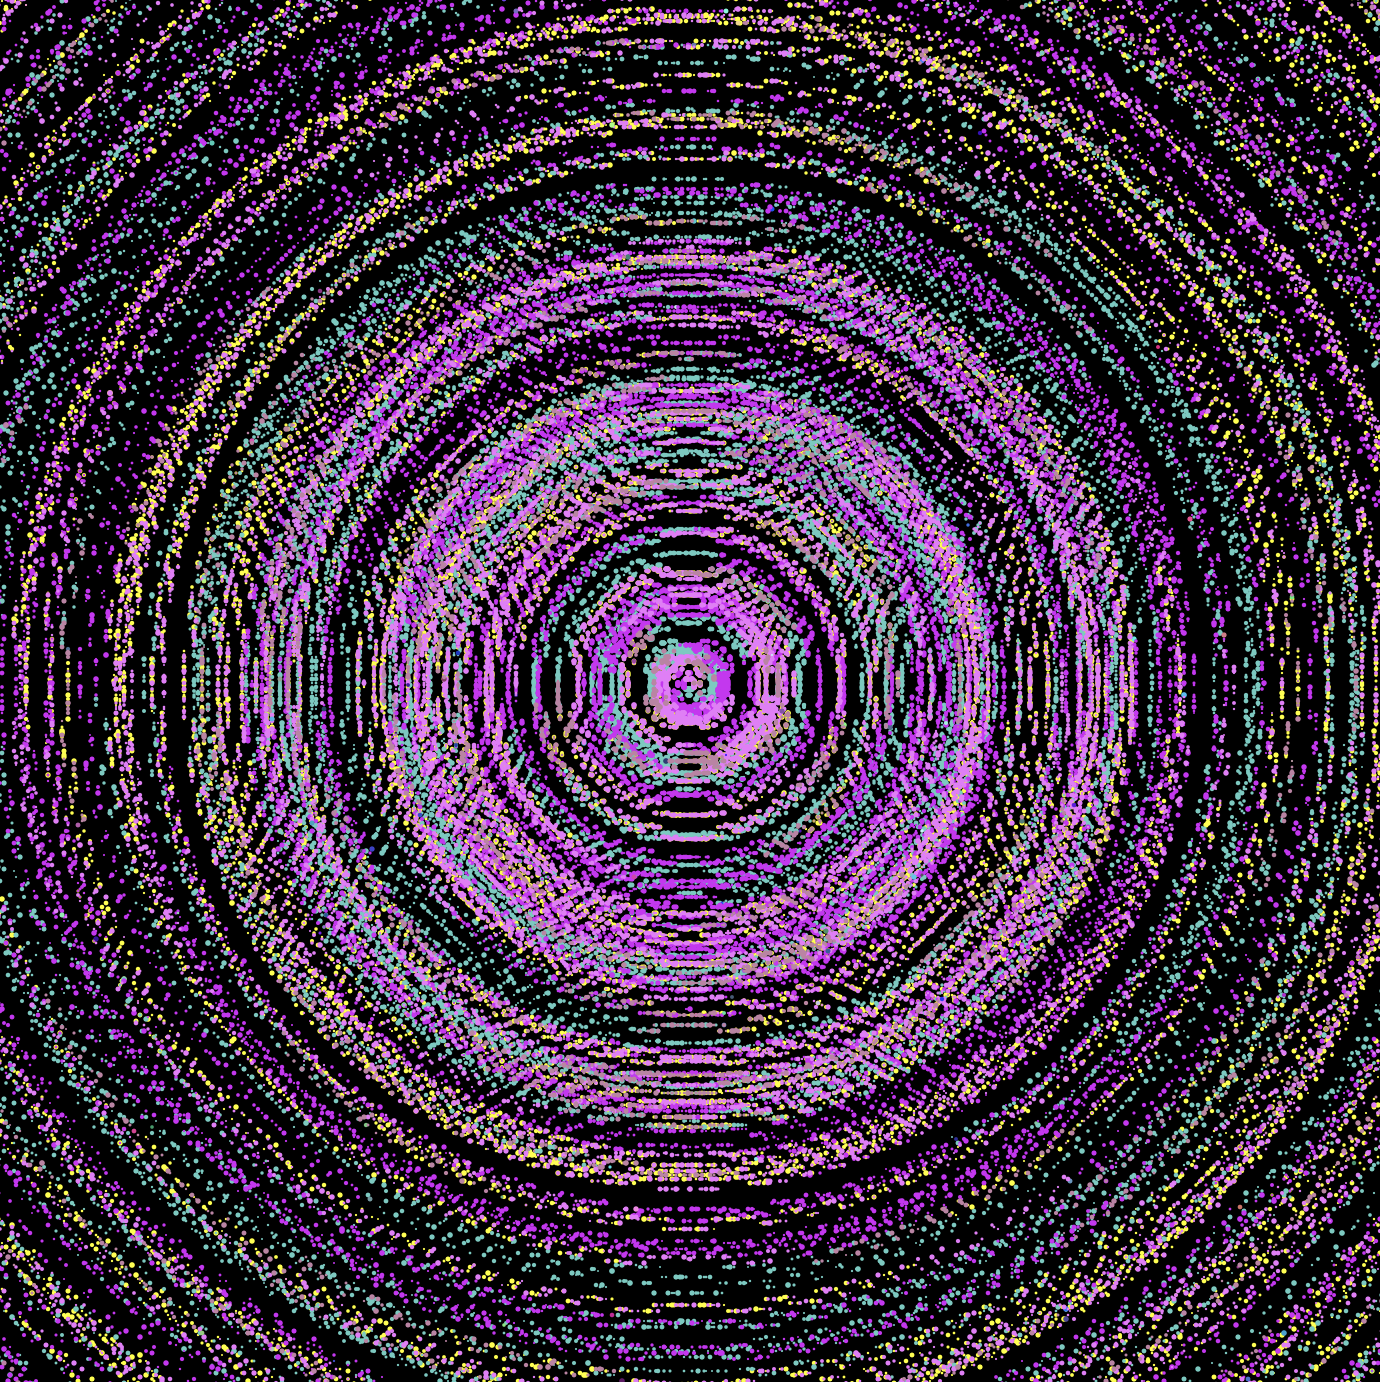
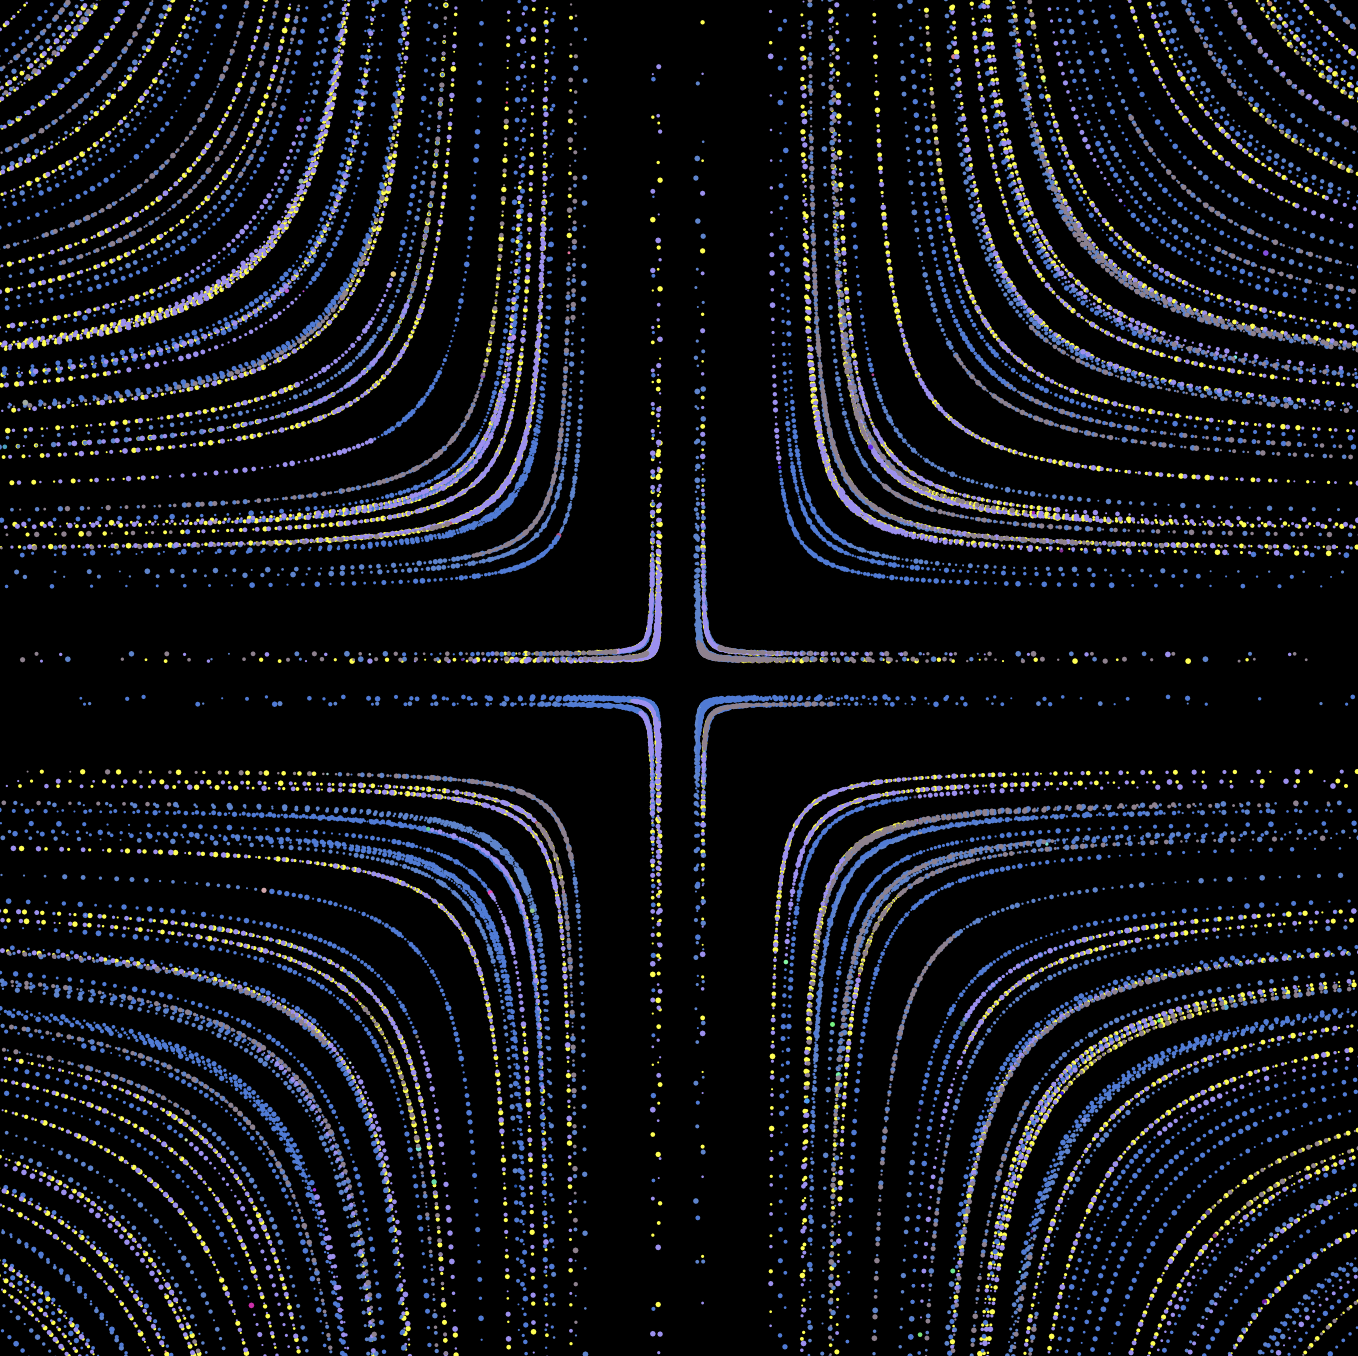
I tried to mimic the movement of the edges as in the original, but it proved to be very difficult. I smoothened the movement with the use of noise, and rotated the objects so that we get varied shapes and images.

Notice that the rotate_() function rotates the objects only if the mouse is not pressed. If we press the mouse, the shapes stop rotating and start jittering. The shape changes its shape randomly. This random movement comes from the combination of noise and random functions with a change in the sign of the movement. If the sign is negative, the points would move left or up, and if the sign is positive, the points would move right or down. However, this movement is restricted to certain extent, such that the shapes do not move too far away from the visible part of the canvas. This was implemented with the following limit_point function.

function limit_point(i) {
    // limits the movement of the point. It keeps the shape with in a random range of 100 to 200 pixels of the canvas. In other words, it does not let the corners of the shape go beyond the canvas width or height plus some pixels in the range 100 to 200.
    if ((shapes[i].x1 > width + random(100, 200)) || (shapes[i].x1 < 0  - random(100, 200))) {
      sign_x1 *= (-1);
    }
    if ((shapes[i].y1 > height + random(100, 200)) || (shapes[i].y1 < 0 - random(100, 200))) {
      sign_y1 *= (-1);
    }
    
    // does the same random movement for another point/corner of the shape
    shapes[i].x2 += noise(random(-jitter+93, jitter+88)) * sign_x2;
    shapes[i].y2 += noise(random(-jitter+10, jitter)) * sign_x2;
    if ((shapes[i].x1 > width + random(100, 200)) || (shapes[i].x2 < 0 - random(100, 200))) {
      sign_x2 *= (-1);
    }
    if ((shapes[i].y1 > height + random(100, 200)) || (shapes[i].y2 < 0 - random(100, 200))) {
      sign_y2 *= (-1);
    }
    
    // does the same random movement for another point/corner of the shape
    shapes[i].x3 += noise(random(-jitter+89, jitter+23)) * sign_x3;
    shapes[i].y3 += noise(random(-jitter+45, jitter+48)) * sign_y3;
    if ((shapes[i].x1 > width + random(100, 200)) || (shapes[i].x3 < 0 - random(100, 200))) {
      sign_x3 *= (-1);
    }
    if ((shapes[i].y1 > height + random(100, 200)) || (shapes[i].y3 < 0 - random(100, 200))) {
      sign_y3 *= (-1);
    }
    
    // does the same random movement for another point/corner of the shape
    shapes[i].x4 += noise(random(-jitter+5, jitter+88)) * sign_x4;
    shapes[i].y4 += noise(random(-jitter+76, jitter+34)) * sign_y4;
    if ((shapes[i].x1 > width + random(100, 200)) || (shapes[i].x4 < 0 - random(100, 200))) {
      sign_x4 *= (-1);
    }
    if ((shapes[i].y1 > height + random(100, 200)) || (shapes[i].y4 < 0 - random(100, 200))) {
      sign_y4 *= (-1);
    }
}

This function takes in the index of the shapes array as an argument and limits the points of a quadrilateral with in a random range of 100 to 200 pixels from the edges of the canvas.

The draw function then simply runs all the functions on the shapes created in the setup function.

function draw() {
  background(123);
  
  for (let i = 0; i < shapes.length; i++) {
    
    // displays all the shapes
    shapes[i].display();
    
    // rotates all the shape with respect to (0,0)
    shapes[i].rotate_();
    
    // limit the movement of the points of a shape
    limit_point(i);
  }
}

The background was chosen such that the shapes would pop out and as an aesthetic measure. As part of the interactivity in the project, I added the functionality of adding new shape whenever a mouse click is registered. The shape created has a random position and might not be visible on the canvas right away but is created and is visible when the canvas rotates.

function mouseClicked() {
  // creating a new shape when the mouse is clicked
  shapes[shapes.length] = new Shape();
}

Further improvements

While I was trying to rotate the objects, I tried to rotate them such that all the shapes rotated with a different axis. However, the implementation using the push() and pop() function did not work as expected. This could be one of the improvements I could make in the future.

The inspiration for the project had very smooth movements, while mine is not as smooth. I could work on the smoothness as well.

Week 2: Generative Art

Concept

The idea of the project was to simulate stars in the night sky. Due to the rotation of the Earth, if we were to point a camera at a clear night sky full of stars, we would capture the movements of the stars. This movement resembles a circle with the centre at the North Star. I proceeded with the image of multiple concentric yellow circles which transformed to become more colourful as I wrote the code. The final image also resembled the rings on a heavenly body, such as Saturn. Also, if one were to look at it closely, it also appears to resemble an impressionist version of mandala art.

Code

Tracing the path of hundreds of stars was the most critical and the most difficult process in the project. In order to do it, I had to move the stars independently of one another. The simplest solution was to make each of the star as a single object. Thus, I made a class called Star and added attributes to it.

class Star {
  constructor() {
    // each star will have a random distance from the center
    this.radius = random(width);
    
    // each star has a random co-ordinate relative to the center
    this.xpos = center_x + random(-this.radius, this.radius);
    this.ypos = center_y + random(-this.radius, this.radius);
    
    // Calculating the angle of the star relative to the center.
    // A random constant is multiplied because without it the stars seems to only assume angle between -90 and 90 degrees. Try running the draw() function without this constant only once.
    this.angle = atan((center_y - this.ypos)/(center_x - this.xpos))*random(4, 9);
  }
  
  // function to display the star
  show() {
    noStroke();
    // changing color with respect to the count variable
    if (count % 100 === 0) {
      fill(color(random(10, 255), random(10, 255), random(100, 255)));
    }
    
    // star has a random diameter.
    circle(this.xpos, this.ypos, random(1, 3));
  }
}

This way, each star would have its own x-position, y-postition, radius and angle which can be modified independently of the others.

I proceeded to create hundreds of stars which would be displayed onto the canvas.

// count will change the color of the path traced by the stars.
let count = 1;

let num_of_stars = 200;

// co-ordinates of the center from where the stars will trace a circle
let center_x, center_y;

// will contain all the star objects.
let all_stars = [];

function setup() {
  createCanvas(700, 700);
  background(0);
  
  // centering the stars on the geometric center of the canvas
  center_x = width/2;
  center_y = height/2;
  
  // creating stars and appending it to the array
  let i = 0;
  while (i < num_of_stars) {
    all_stars[i] = new Star();
    i++;
  }
  
  // always start the trace with yellow.
  fill("yellow");
}

The while loop would create new stars and append it to the all_stars array.

function draw() {
  // modifying the attributes of each star, one at a time
  for (let i = 0; i < all_stars.length; i++) {
    let current_star = all_stars[i];
    
    // tracing a circle from center using the radius and the cosine and sine function
    current_star.xpos = center_x + current_star.radius * cos(current_star.angle);
    current_star.ypos = center_y + current_star.radius * sin(current_star.angle);
    
    // displaying the star onto the canvas
    current_star.show();
    
    // varying the angle to trace a circle
    current_star.angle += 0.01;
  }
  
  // incrementing count which is used in changing the color of the stars.
  count += 0.5;
}

The for loop will loop through all the stars, changes their attributes (essentially their position which traces a circle) and display them onto the canvas. The stars made a circle, as I implemented the change in x and y position through their polar co-ordinates counterpart in terms of radius and angle.

current_star.xpos = center_x + current_star.radius * cos(current_star.angle);
current_star.ypos = center_y + current_star.radius * sin(current_star.angle);

These two lines of code can be modified to create various other patterns and curves. For example, if we square the cos and sin in the function, we would receive a thicker circle, almost pixelated.

This looks almost like a mandala art (but not quite). Similarly, if we invert the cos and sin function (power -1), we would get something that resembles a top-down view of a well lit road junction.

Future Improvement

While I was messing around with the functions, I realised that there were many combinations that could be form with it. The two aforementioned modifications were two of the most noticeable ones. This called upon an improvement into the code, which has to do with the interactivity of the art. The idea would be to allow user to chose the function they would want to use. For instance, have a button to change the function from a cosine to a tangent.

Week 1: Self-Portrait

For this assignment, we were to use p5js online editor to create a self portrait. It did seem like a daunting task, given my incompetence in art and drawings. However, as I played around with the code and different shapes, I put together my face and some of its traits to the best of my ability.

Creating Me

Starting with a blank canvas, I divided the project into various parts to compartmentalise my work. This allowed me to focus on one aspect of the project at time. I created functions to draw different parts of my portrait, which would provide a modular structure to the code as well as help me slowly develop my portrait.

function draw() {
  background(color("#0977f6"));
  
  drawEars();
  drawBody();
  drawNeck();
  drawFace();
  drawStrawHat();
  drawBlush();
  drawSpecs();
}

Note: The drawFace() function draws every element in my face.

I started with the outline of my face. Since, my face is oval-shaped, I opted to using an ellipse to achieve this. The parameters I used to make the outline of my face (ellipse) would later be used in every other shapes and objects. In order to achieve this, I made the parameters for the ellipse global variables by declaring them at the top of the code outside any function. I initialised their values inside the setup() function since it would only be run once. I use this global variables as such:

let f_x, f_y;

function setup() {
  createCanvas(500, 500);
  f_x = width/2;
  f_y = height/2 - 40;
  
  textSize(30);
  textAlign(CENTER, CENTER);
}

f_x and f_y refer to face x-coordinate and face y-coordinate respectively. All the shapes in the portrait is drawn with respect to these variables. In other words, the shapes are drawn with positions corresponding to some manipulation of the aforementioned global variables. Here is an example:

// Eyes
  stroke(10);
  fill("#eeeeee");
  ellipse(f_x - 25, f_y + 10, 20, 7);
  ellipse(f_x + 25, f_y + 10, 20, 7);

The above code snippet creates the two eyes. Notice that the positions of the ellipses uses f_x and f_y. Basing all the shapes in my portrait, I created a digital image of myself.

Notable Traits:
  1. Straw Hat: The hat is inspired by one of my favourite fictional characters, Monkey D. Luffy.
  2. Rosy Cheeks: I have perpetually red cheeks. Although its shape is not exactly an ellipse, making it an ellipse was the only way it did not look off.
  3. Shadows: The shadow of my head on the neck was made by duplicating the head ellipse and translating it down. The width of the ellipse was then adjusted.

Future Improvements

While I was making my portrait, I noticed that making it dynamic was a challenge. The creation and implementation of global variables, f_x and f_y, did make it sort of dynamic as the portrait would still be intact even if we change the size of the canvas, it would be more dynamic if the shapes would also change size with respect to the canvas. This is something that I could work on to improve the customisability of the portrait.