Link to sketch: https://editor.p5js.org/Hazpaz/full/1zy63dQBC
Concept
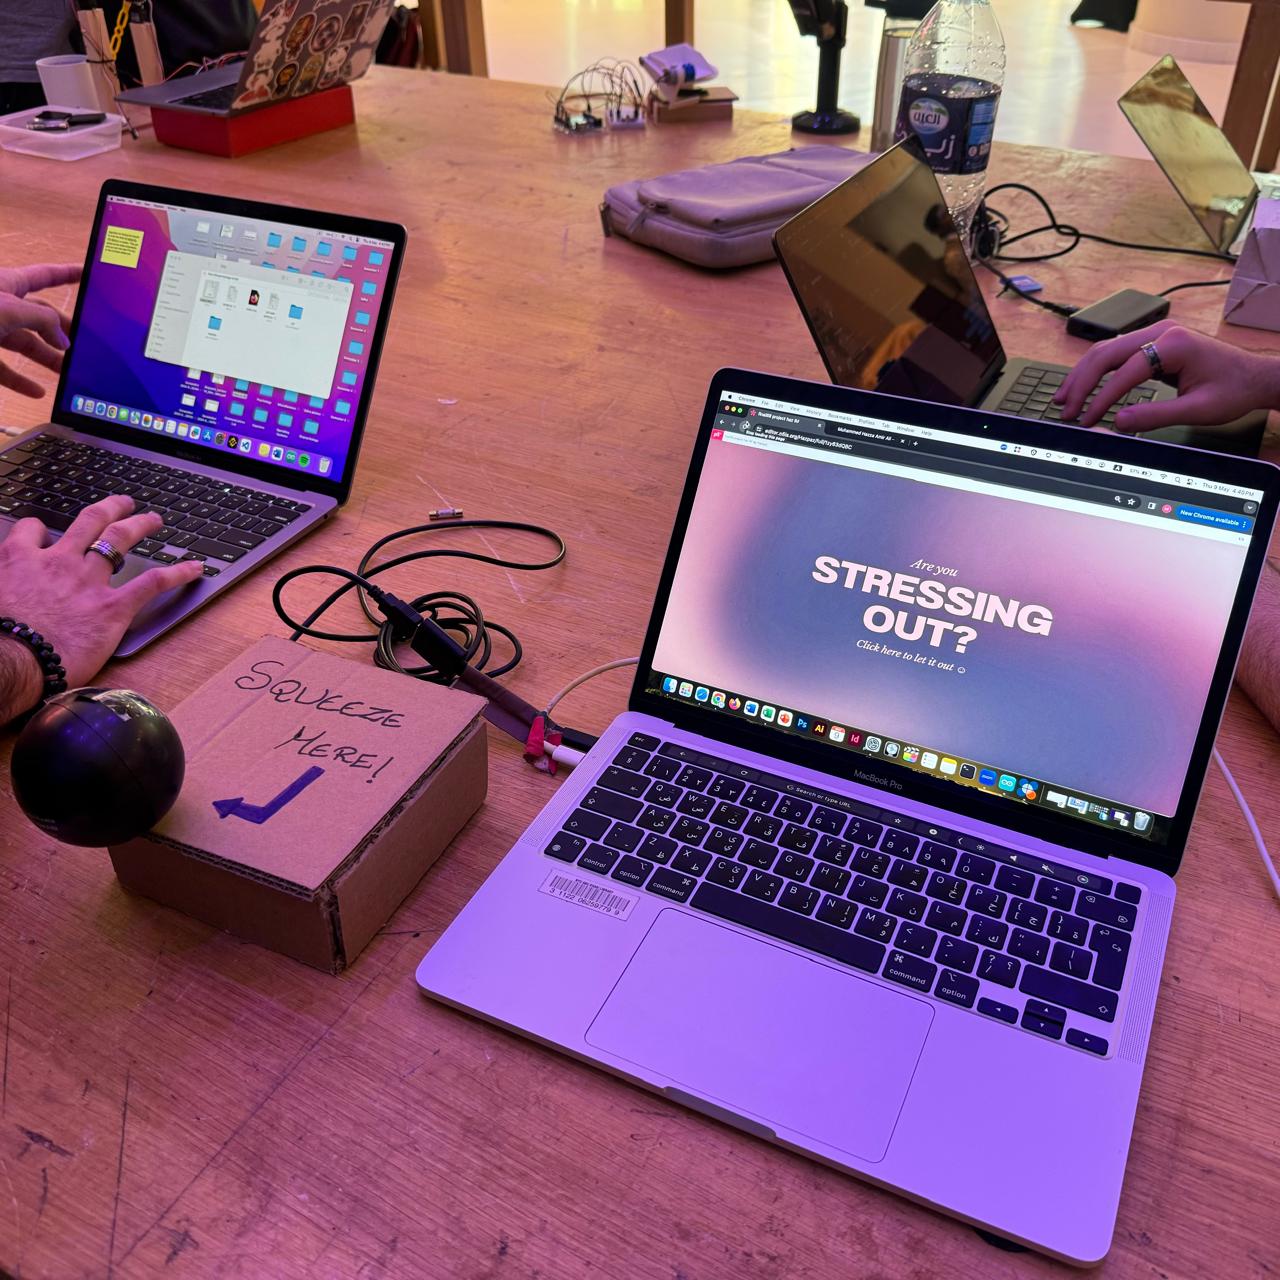
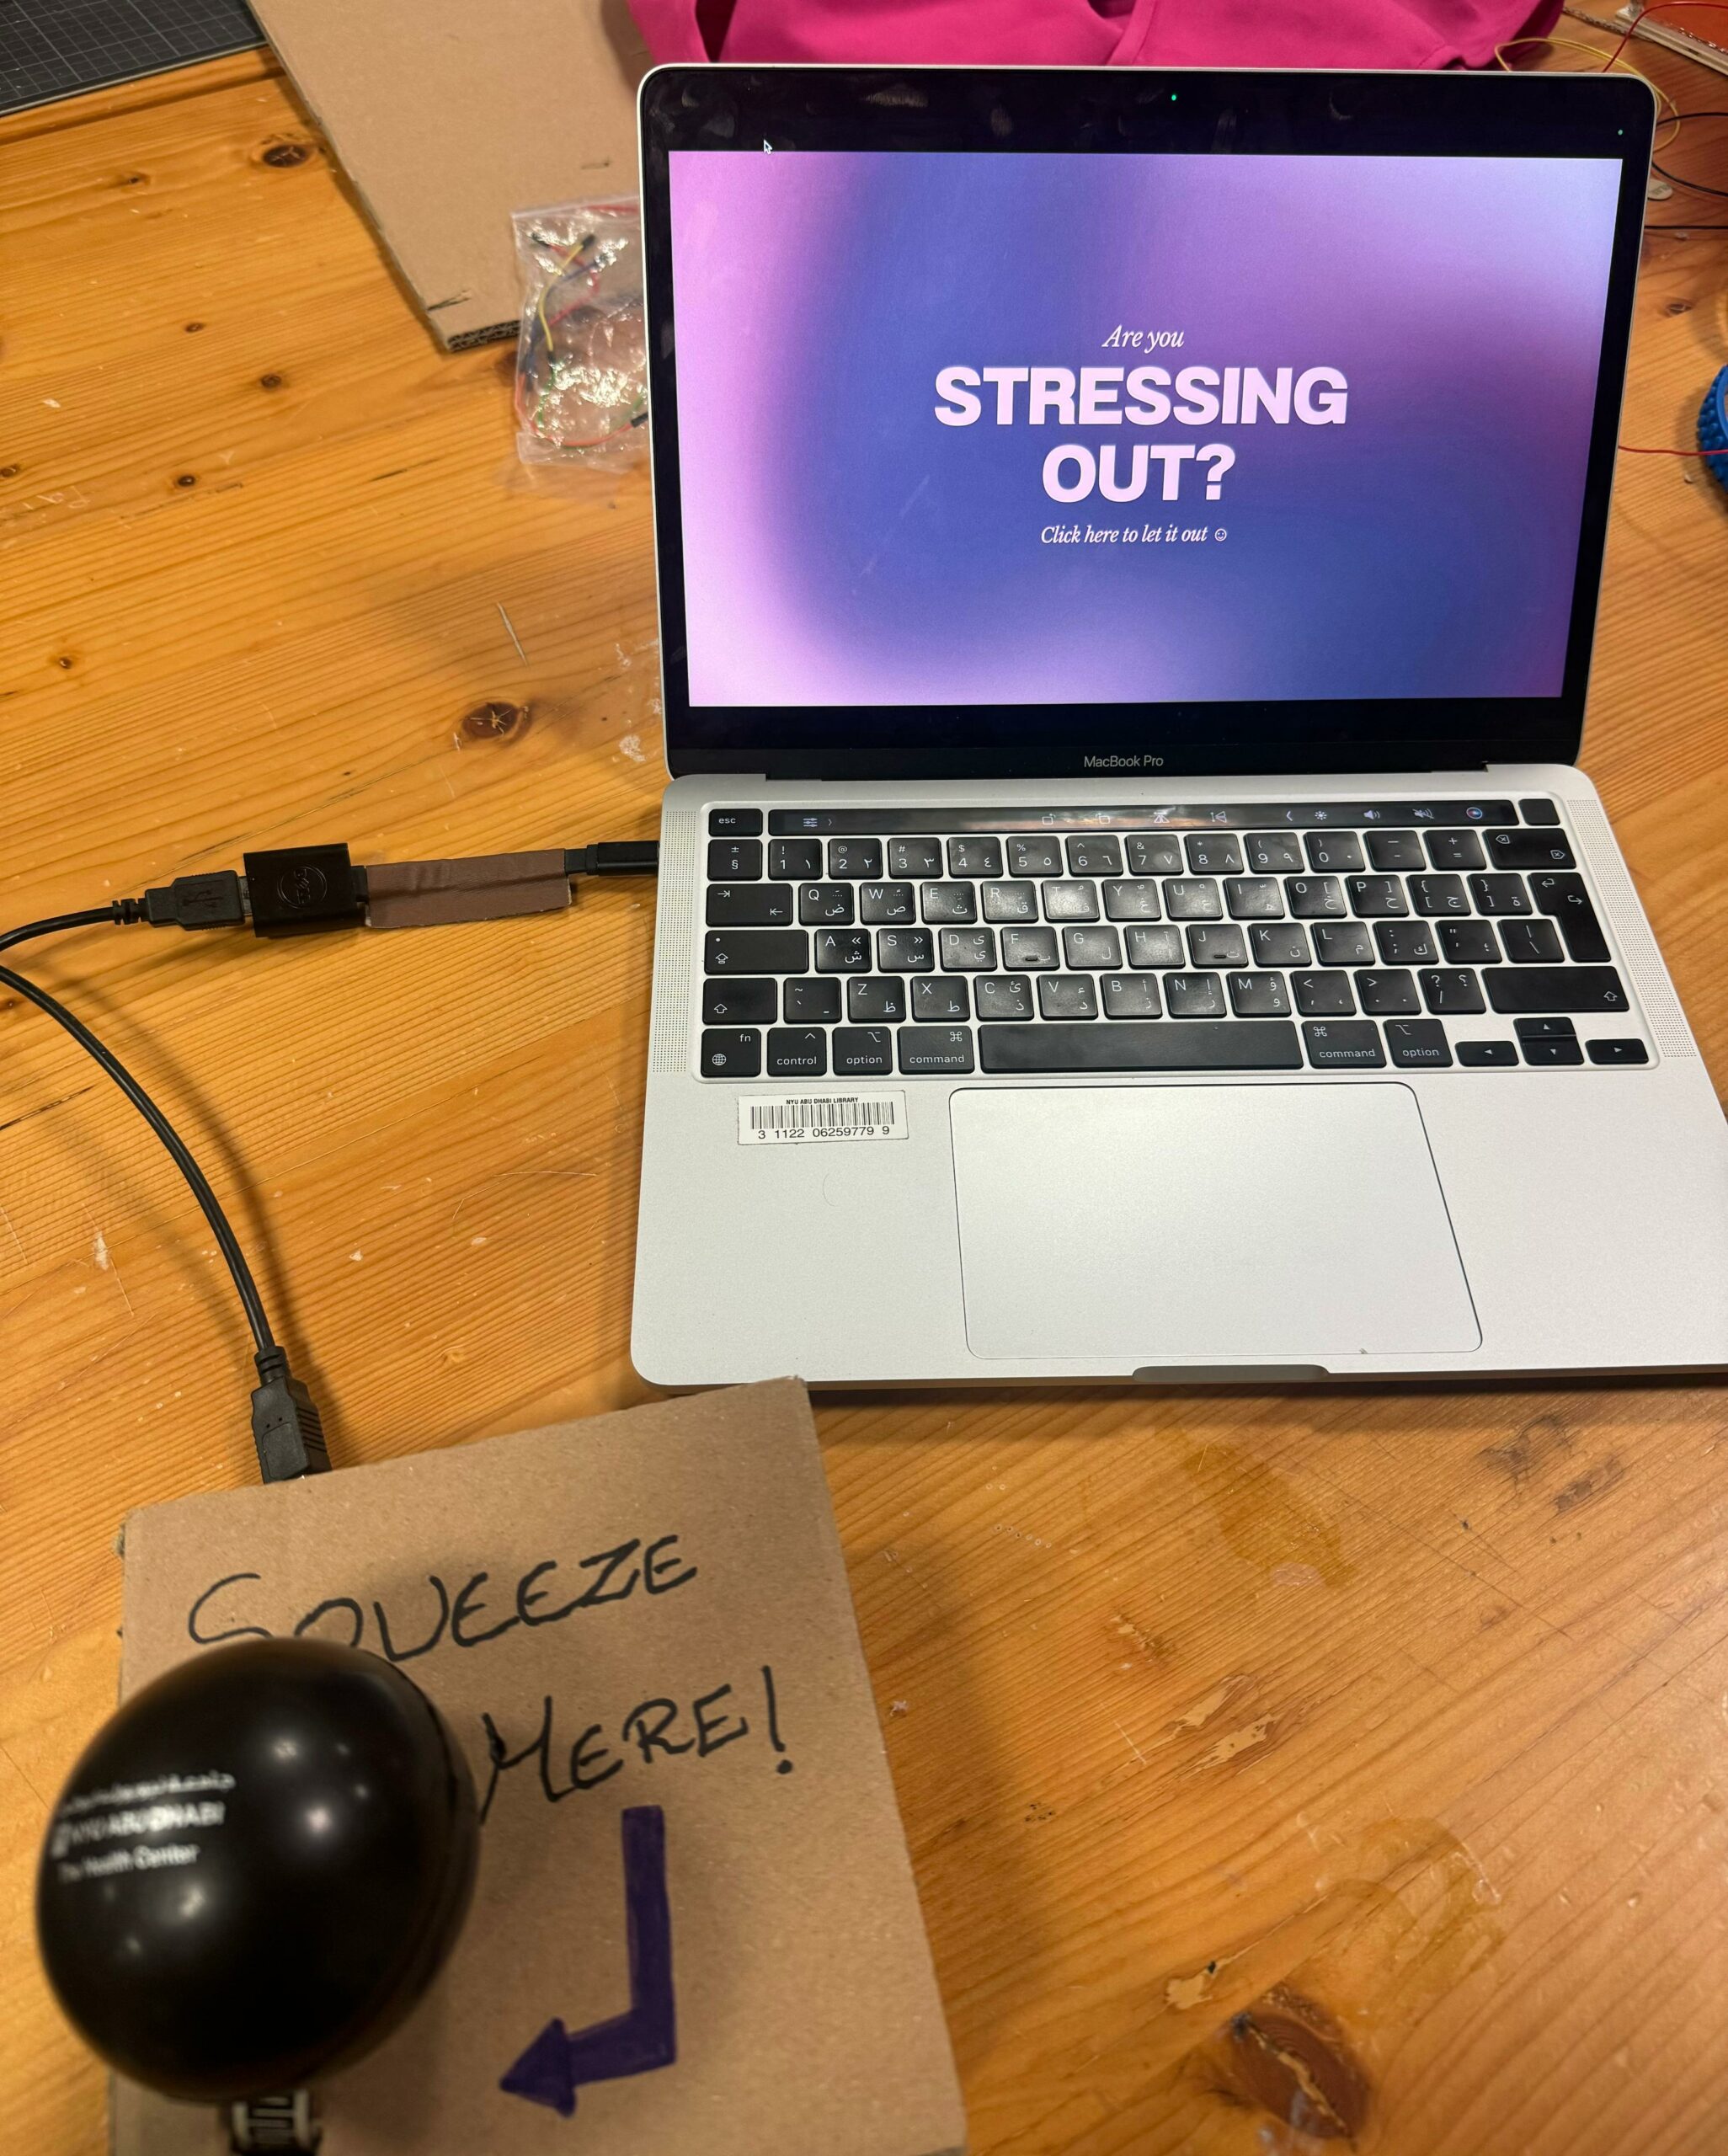
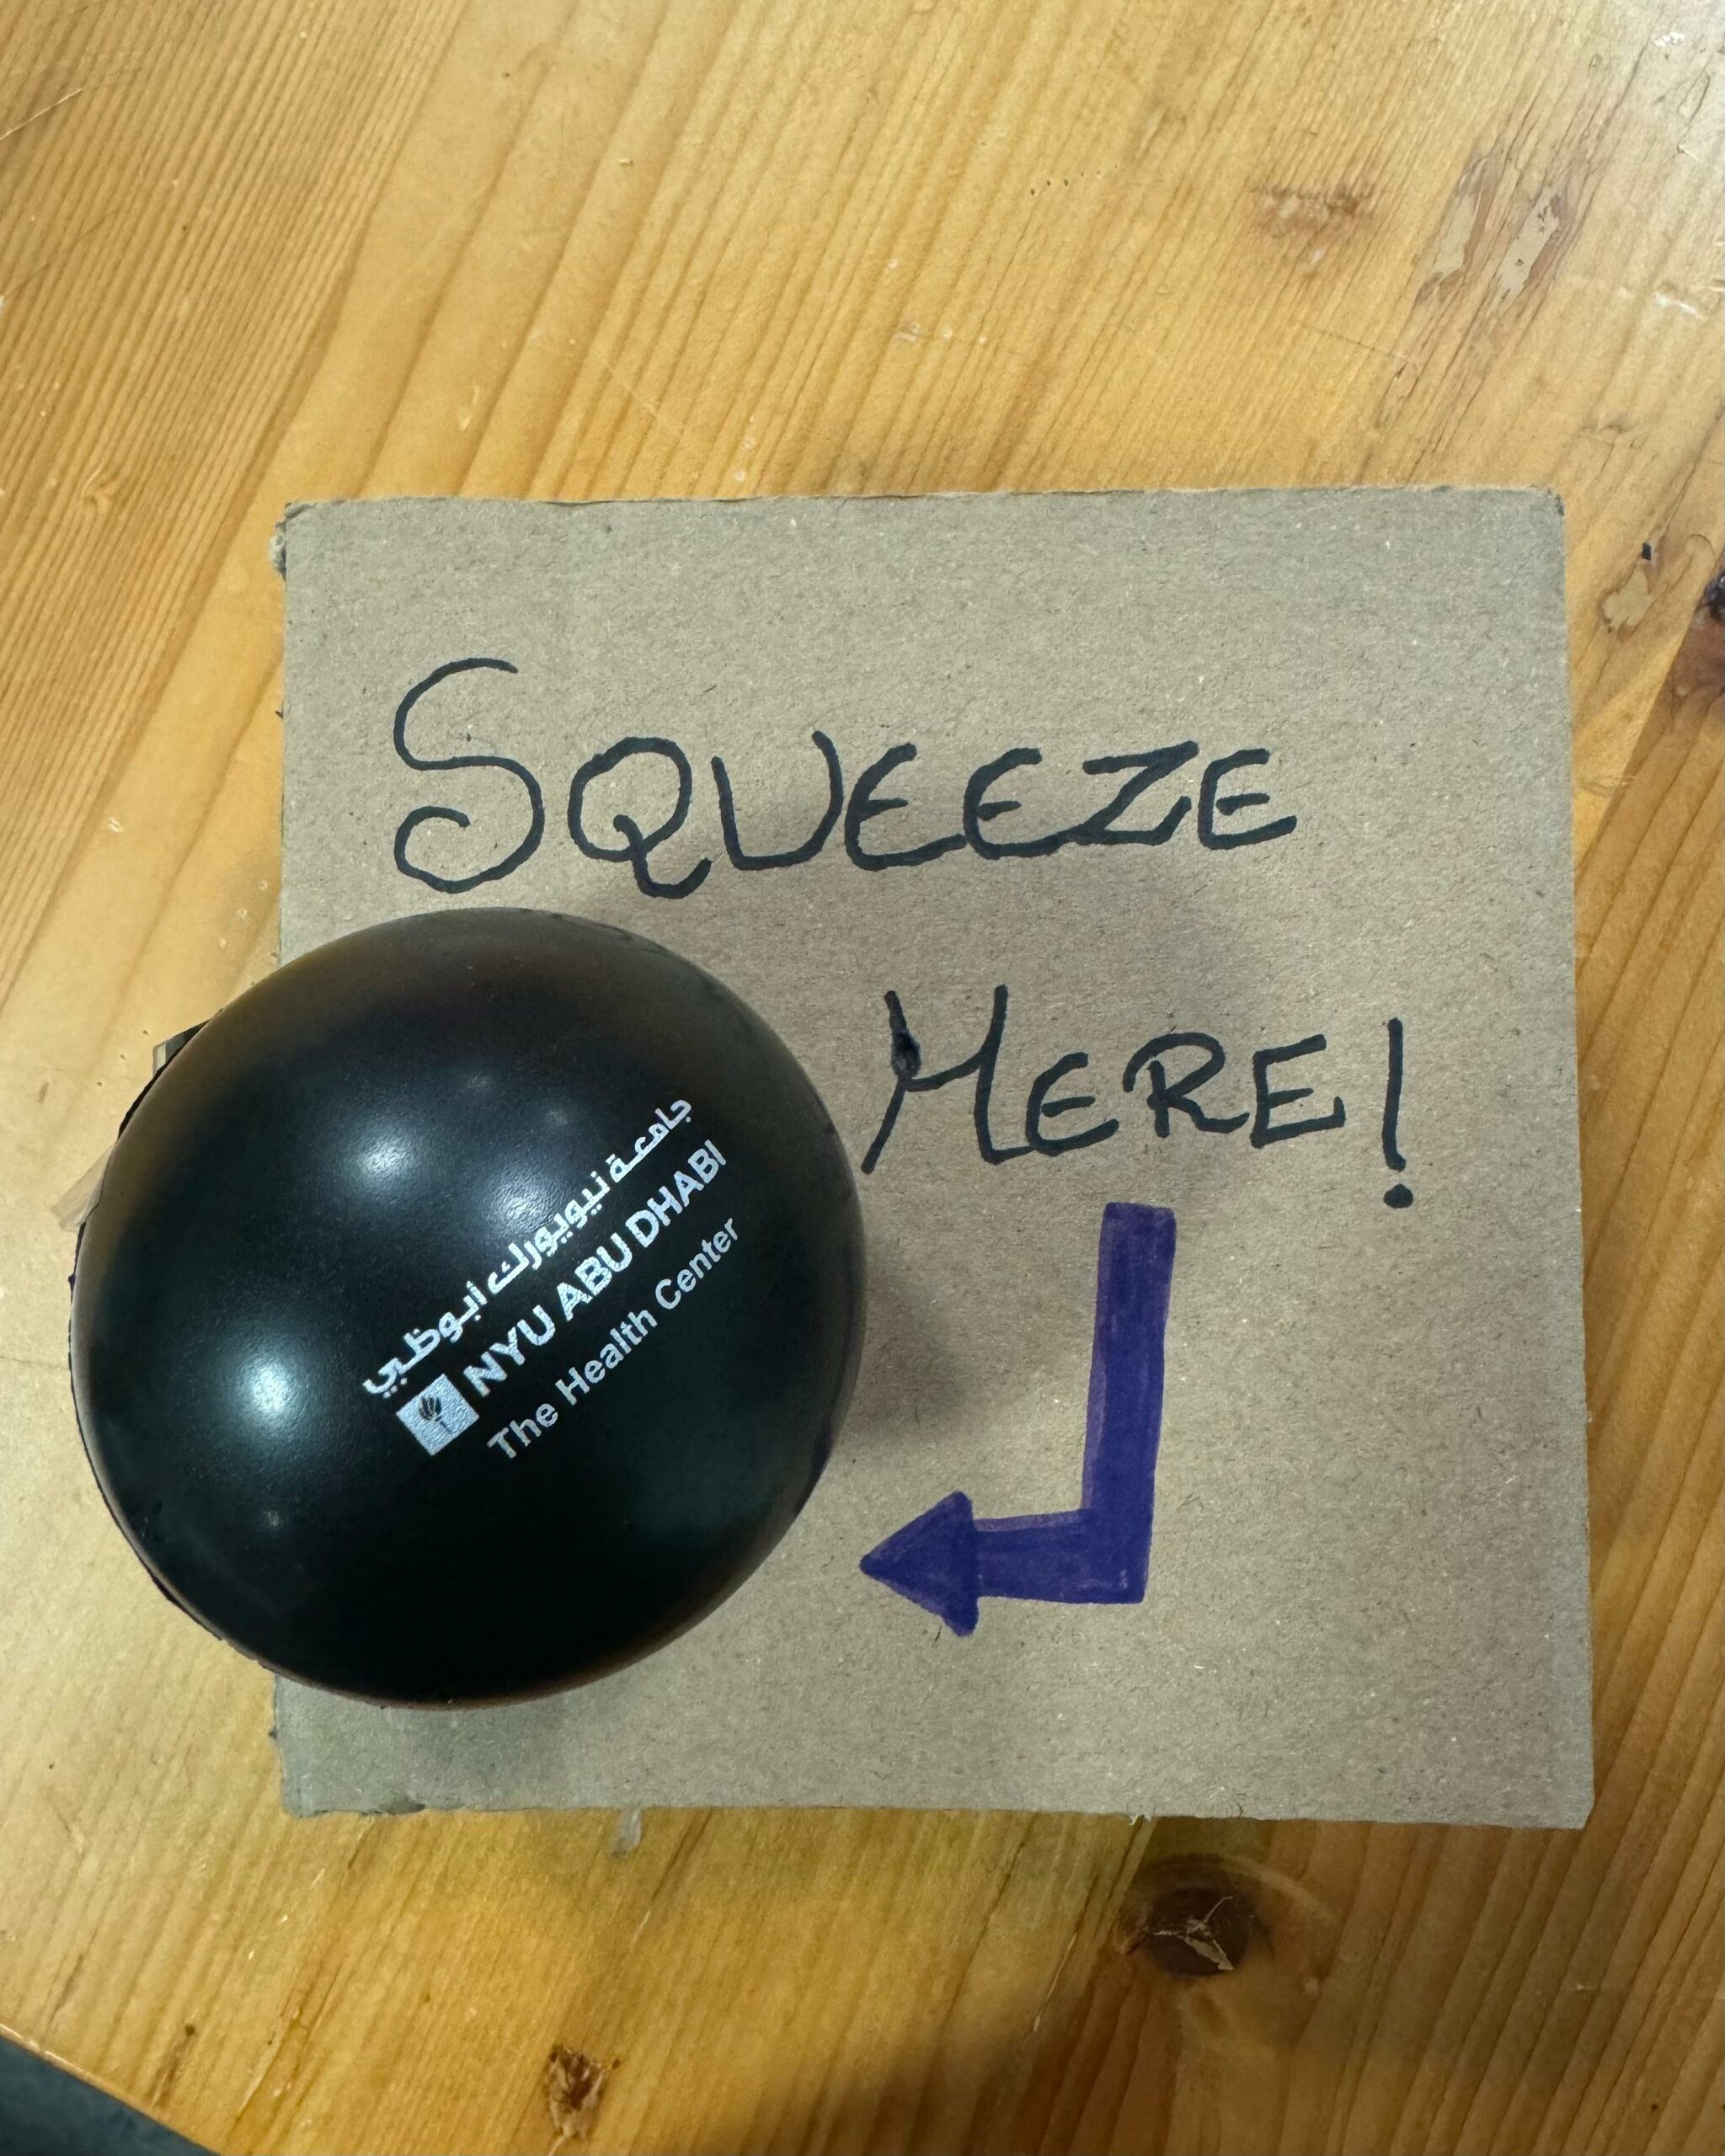
The finals week is here and stress is something that comes along with it. To soothe everyone’s nerves, I have come up with this project through which anyone can unleash their stress. Simple yet powerful. Inspired by one of the previous works related to stress done by previous students, I’ve decided to take advantage of the stress and anger of the students to create beautiful patterns. The idea is to use a stress ball to measure stress levels. When you squeeze the ball, it tells you how much stress you’re letting out. The project then shows a spiral pattern in action according to the pressure applied.
Images
User testing Video
How does the implementation work
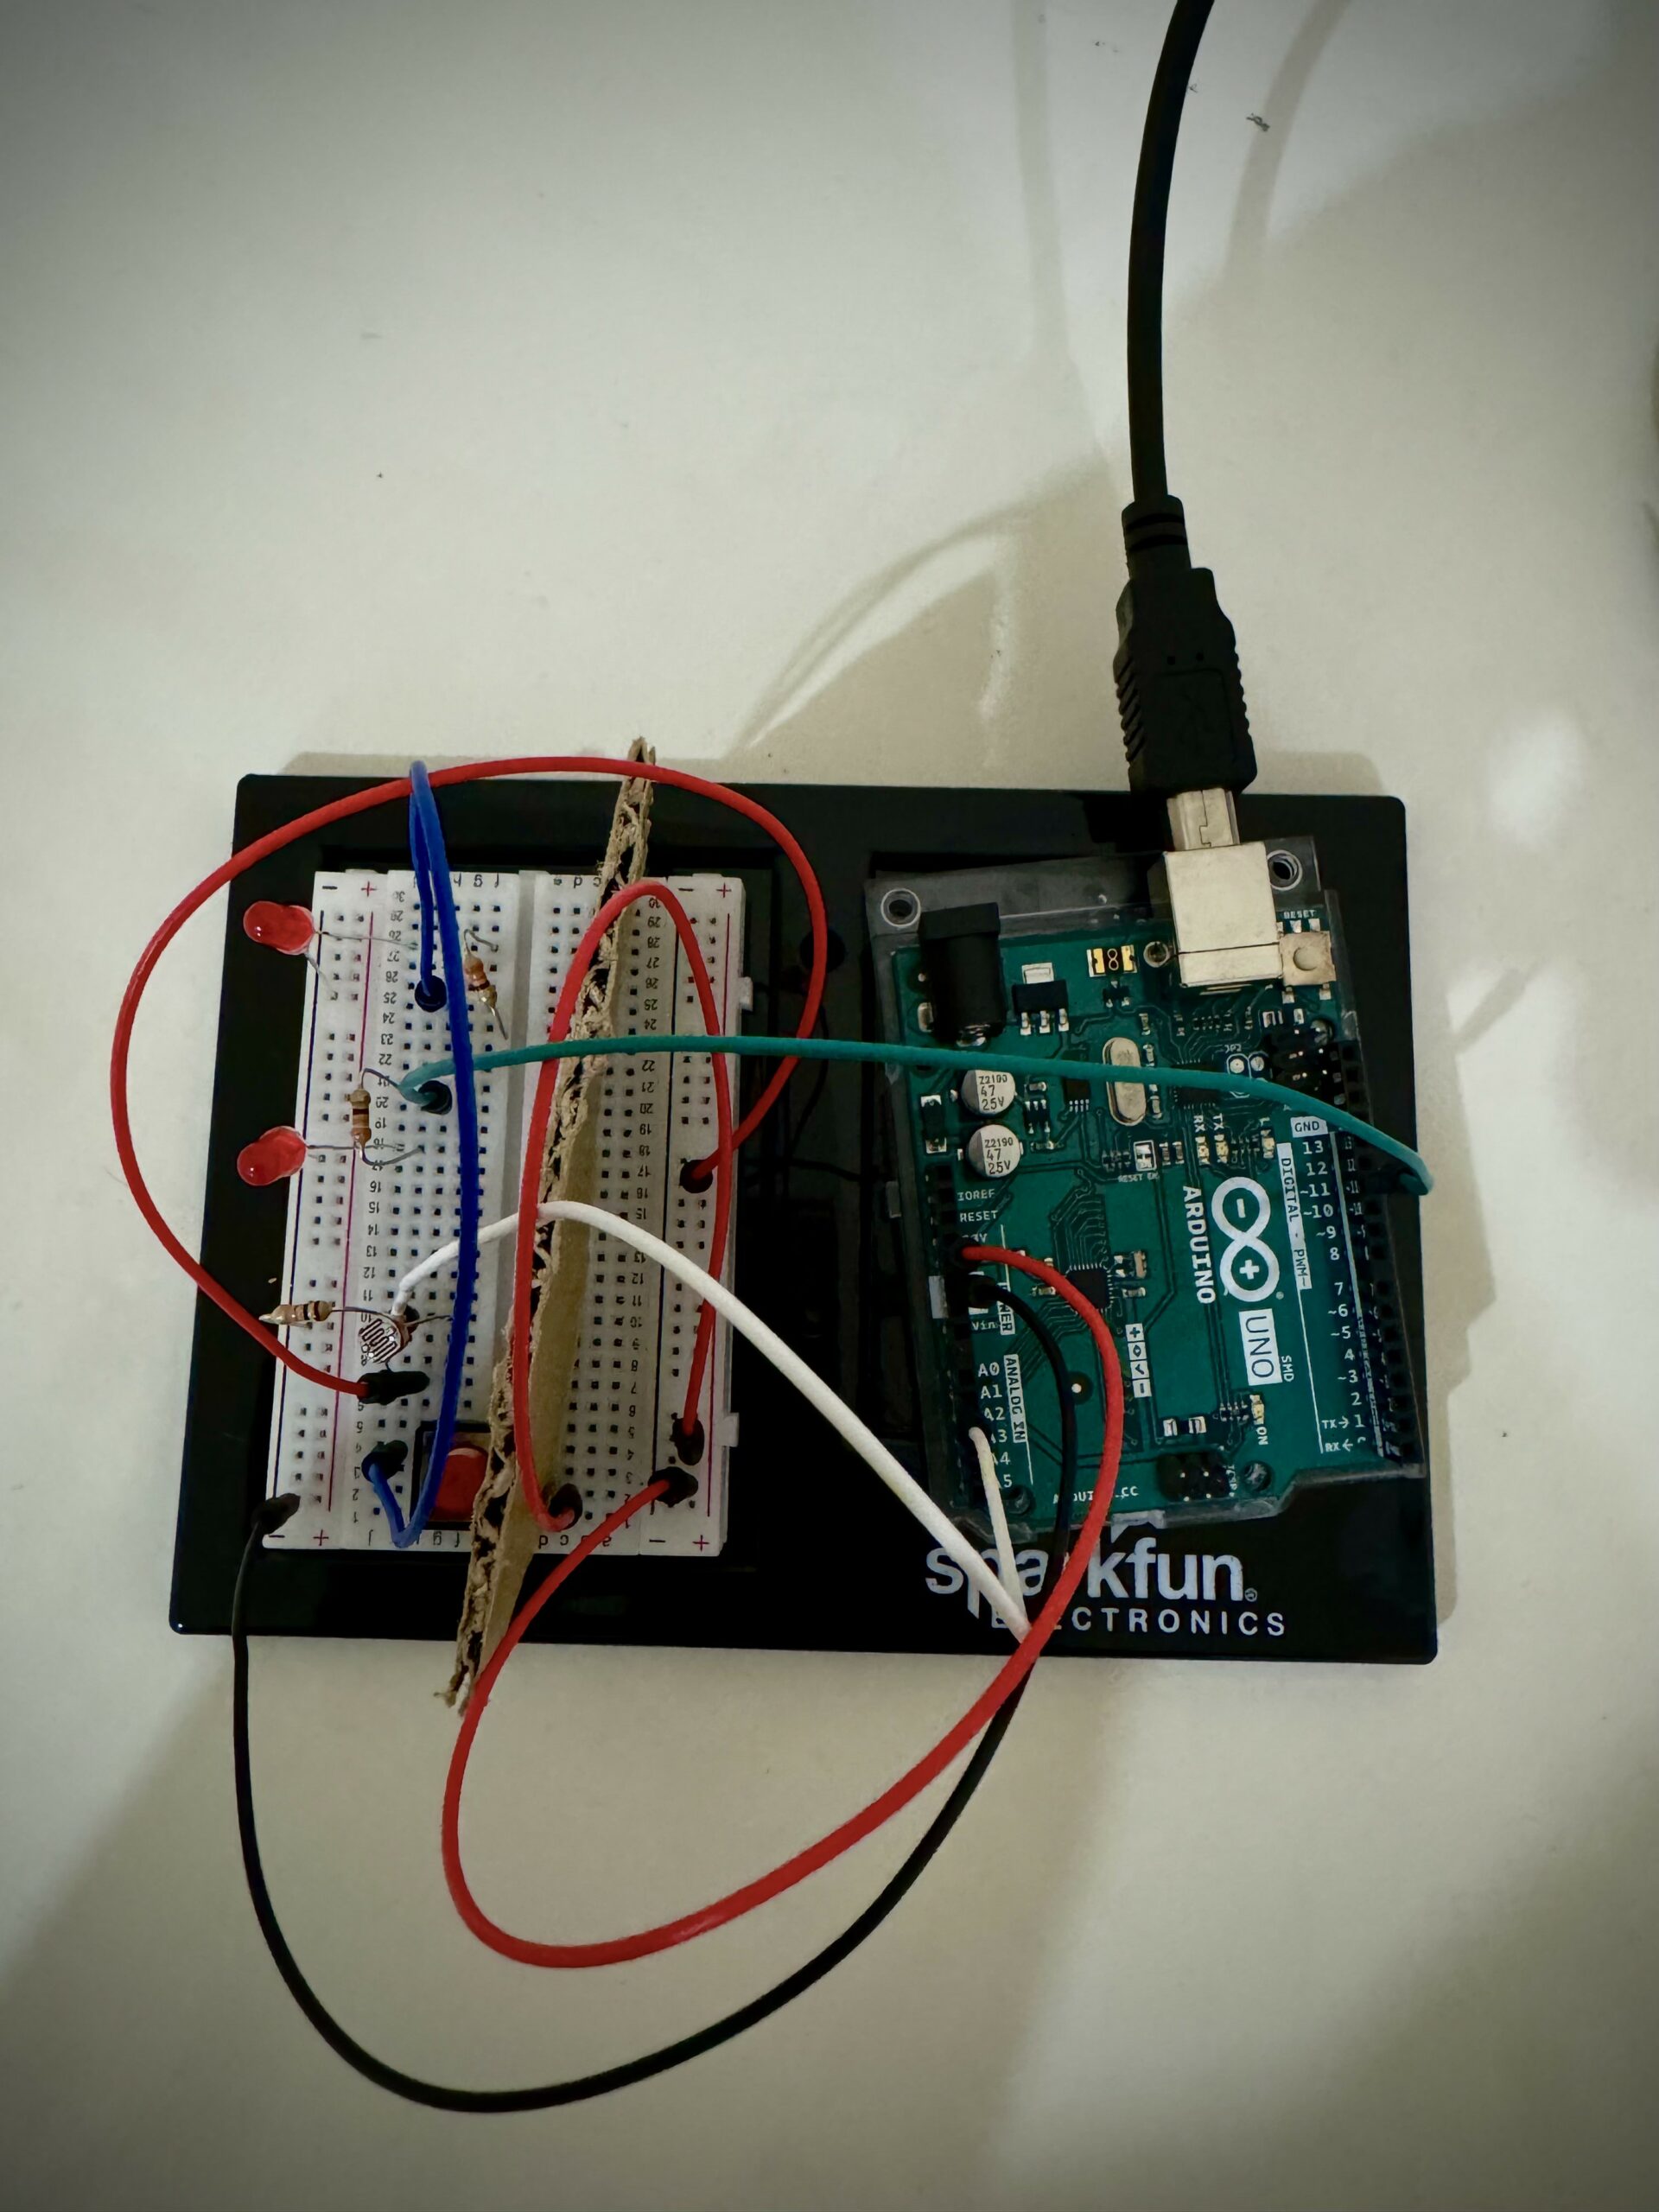
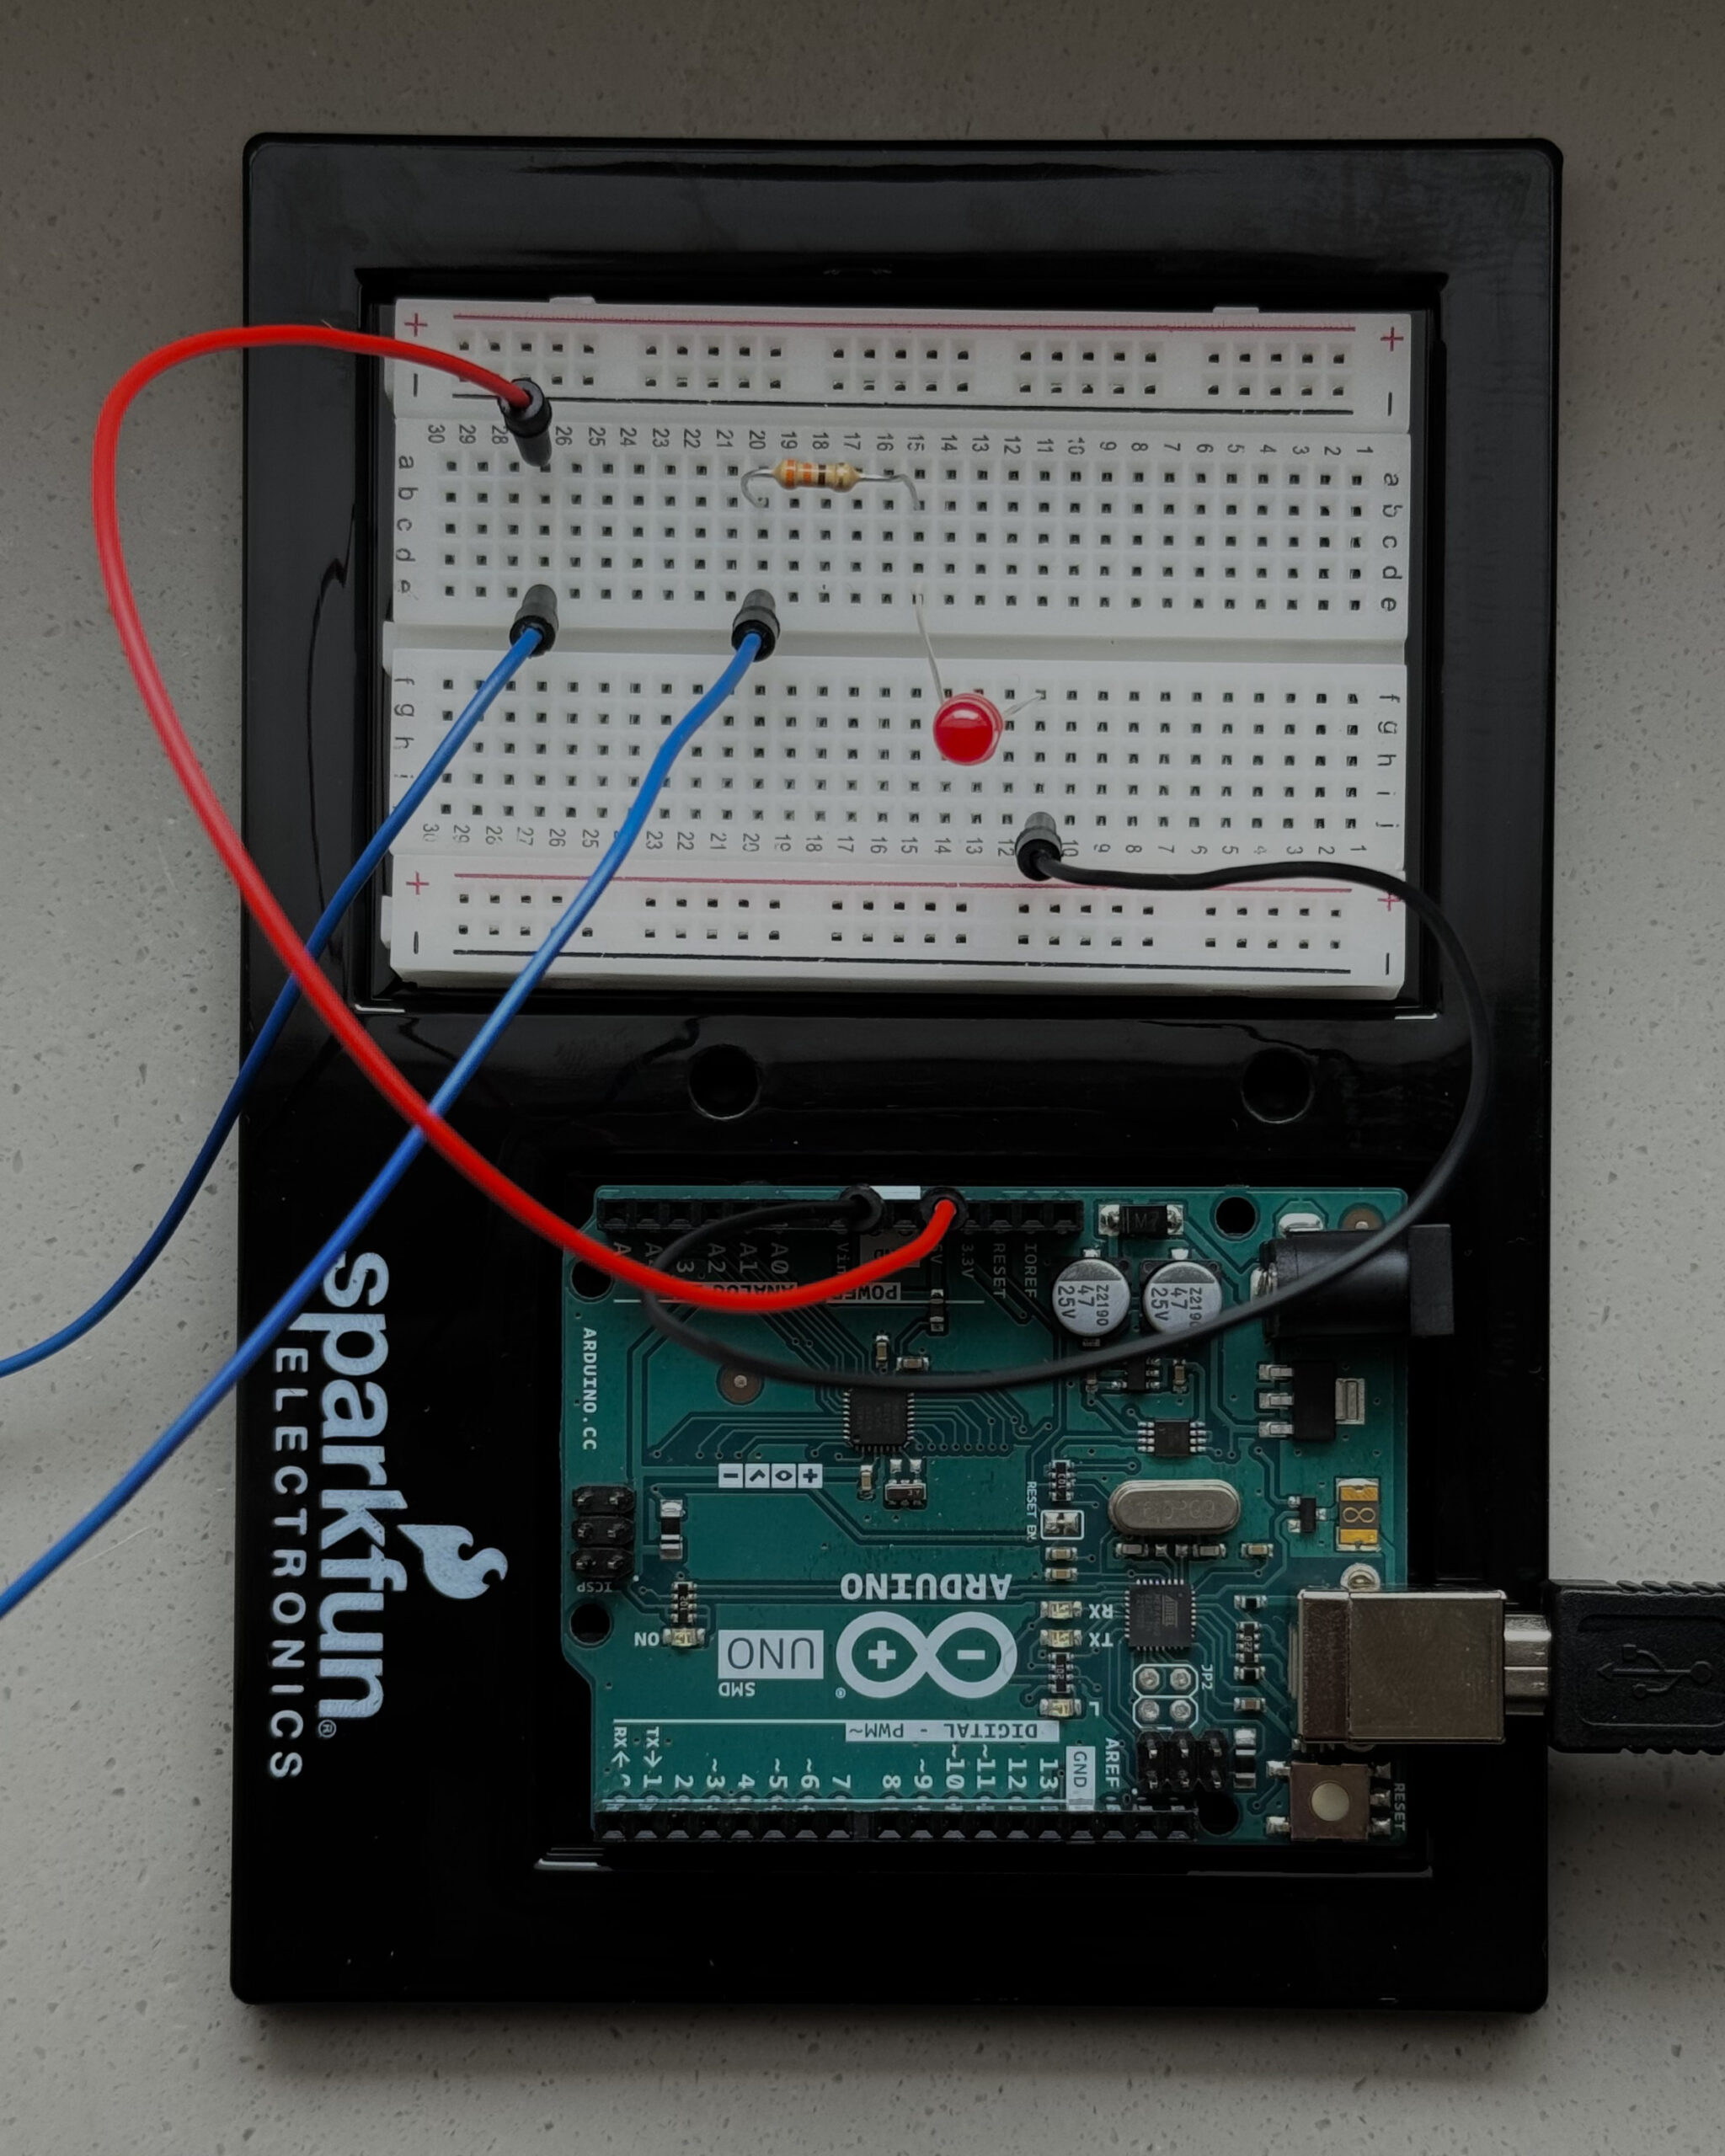
Materials Used
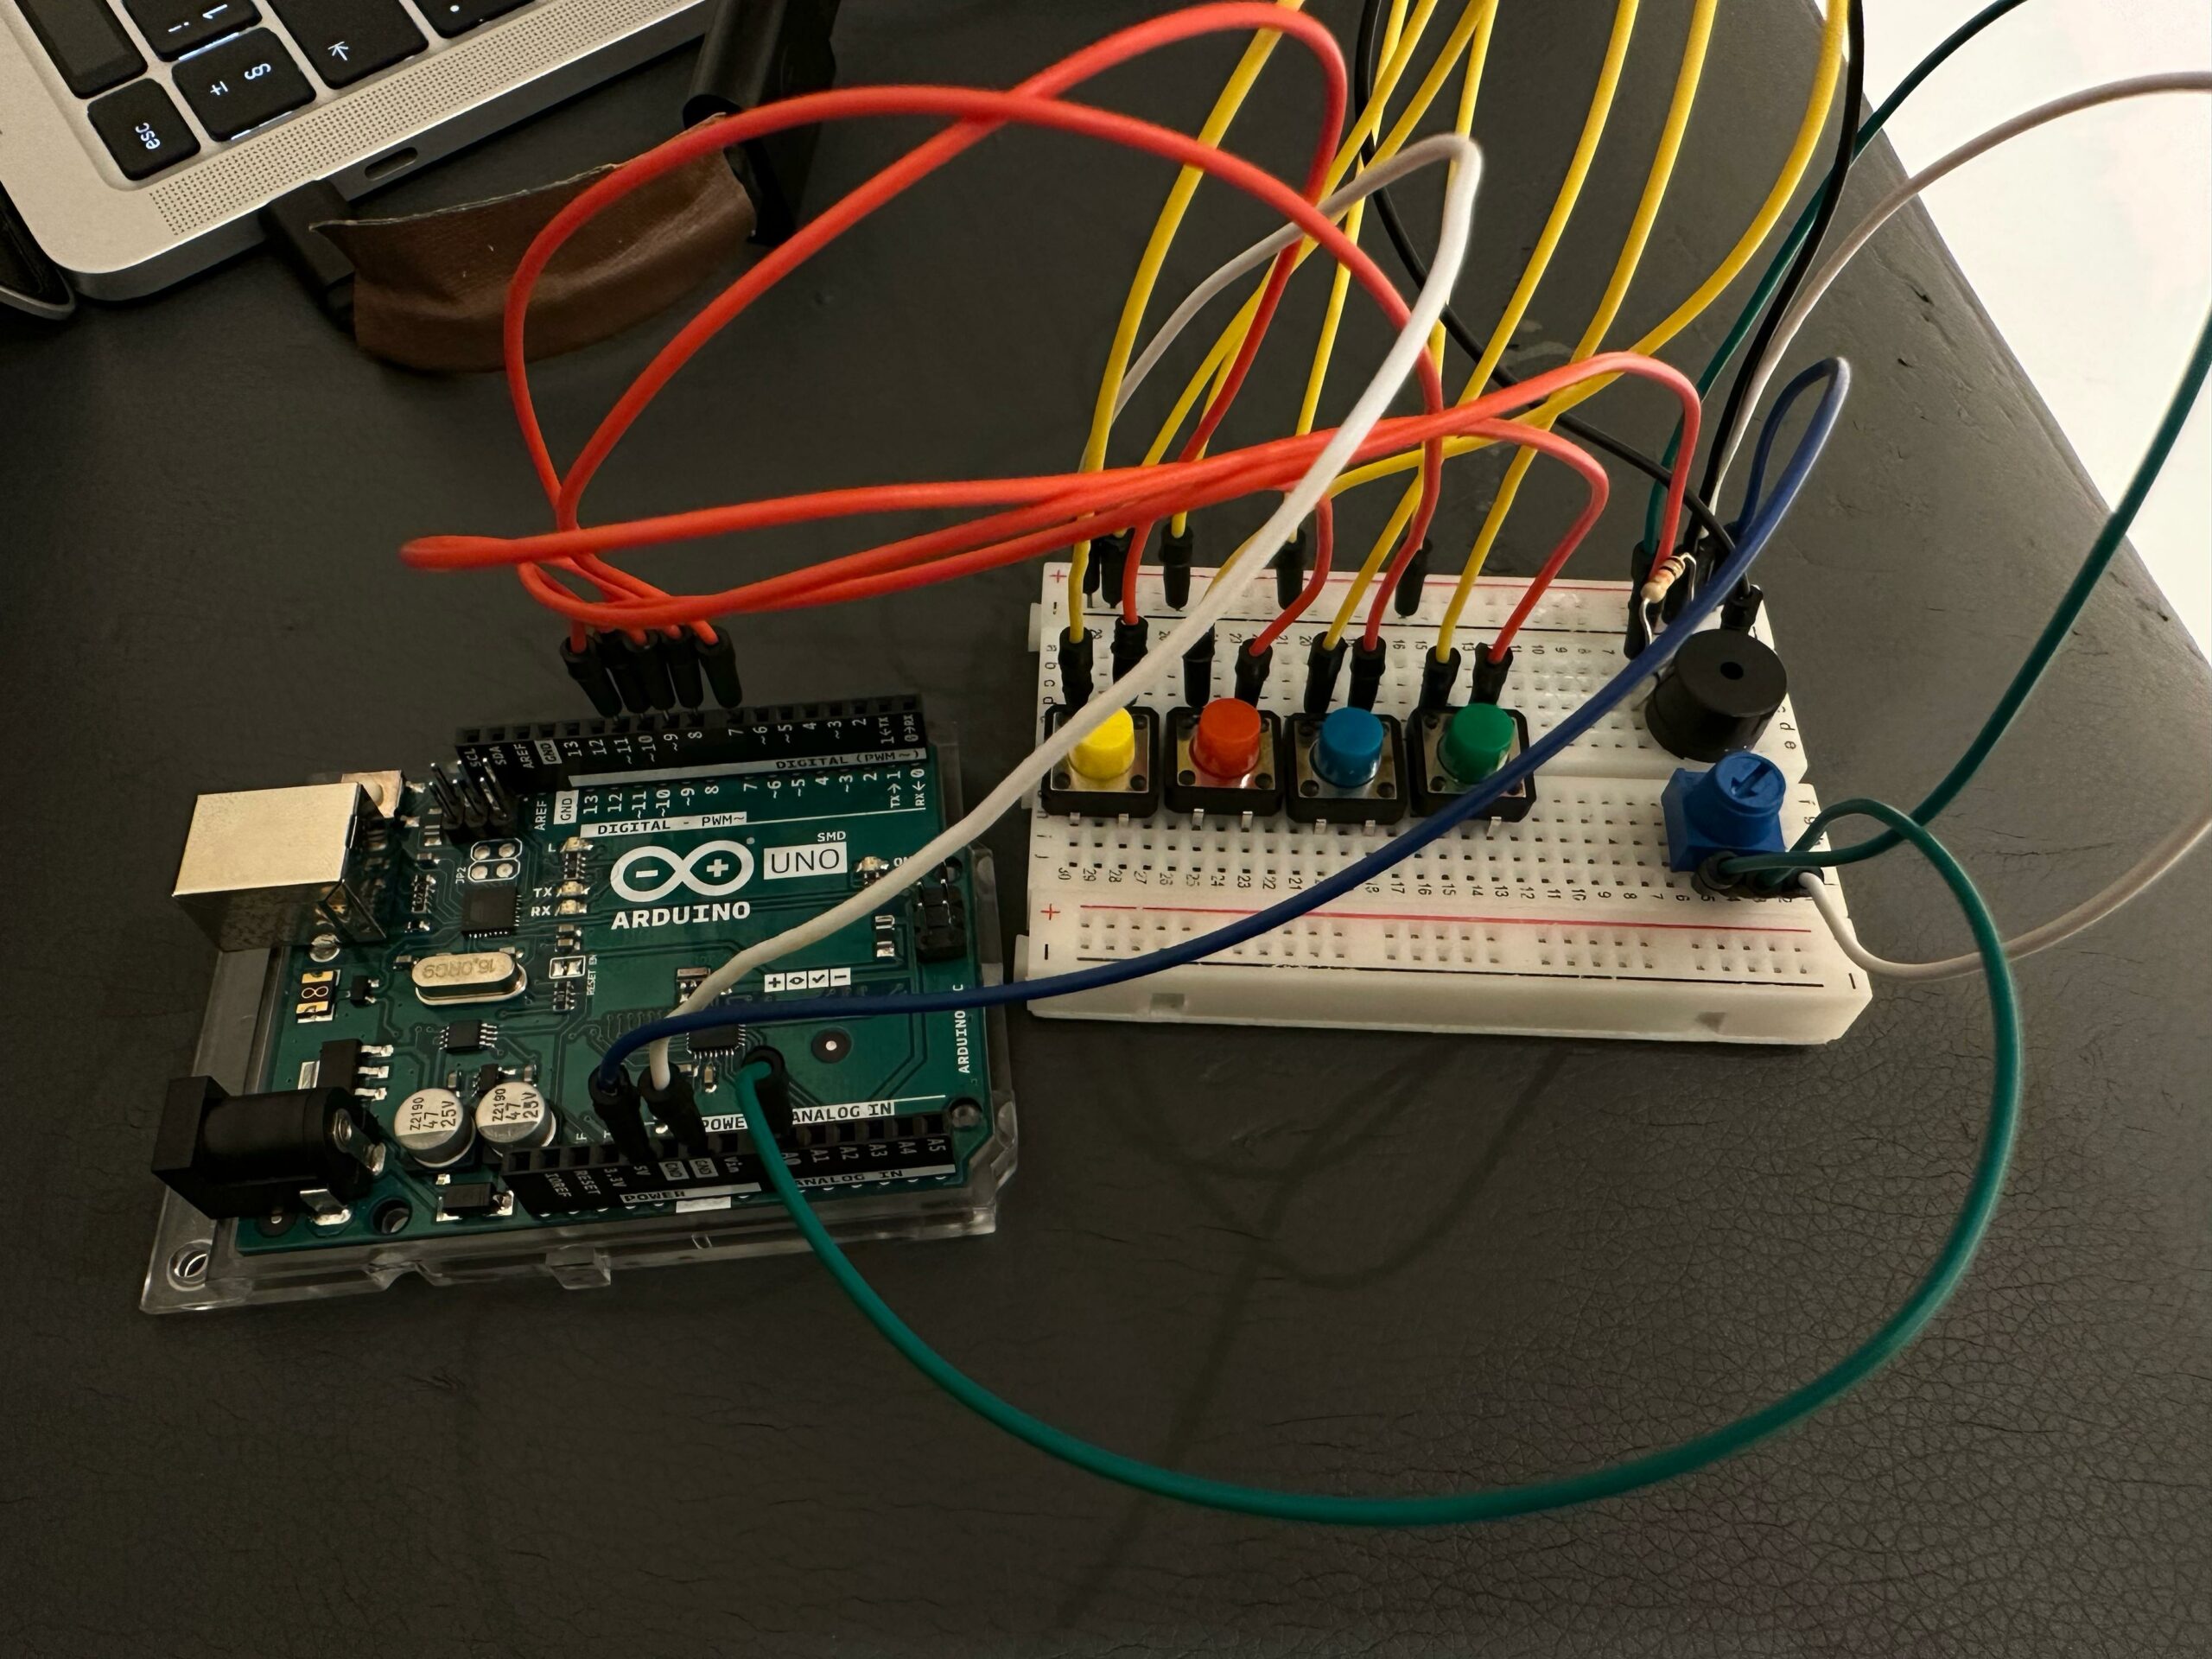
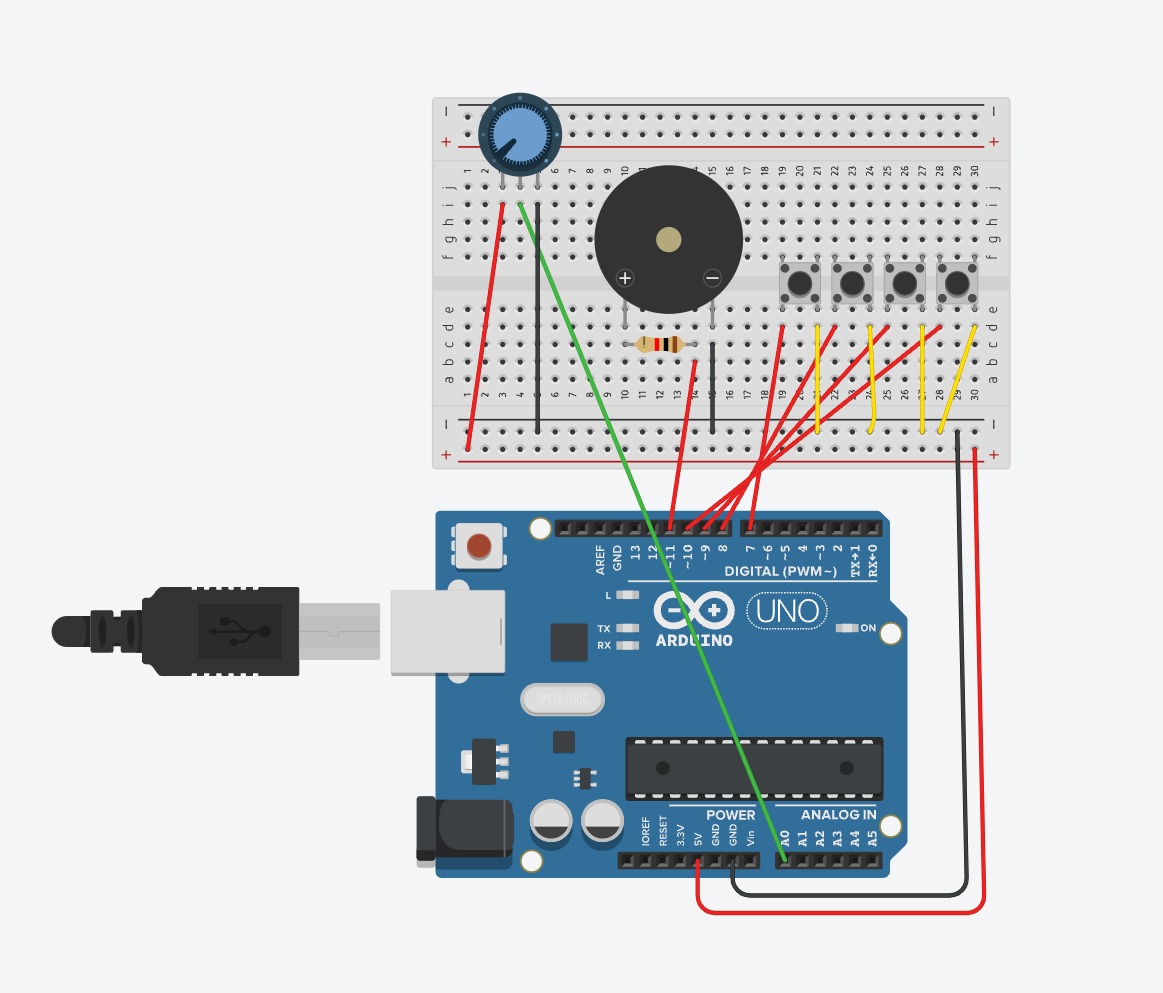
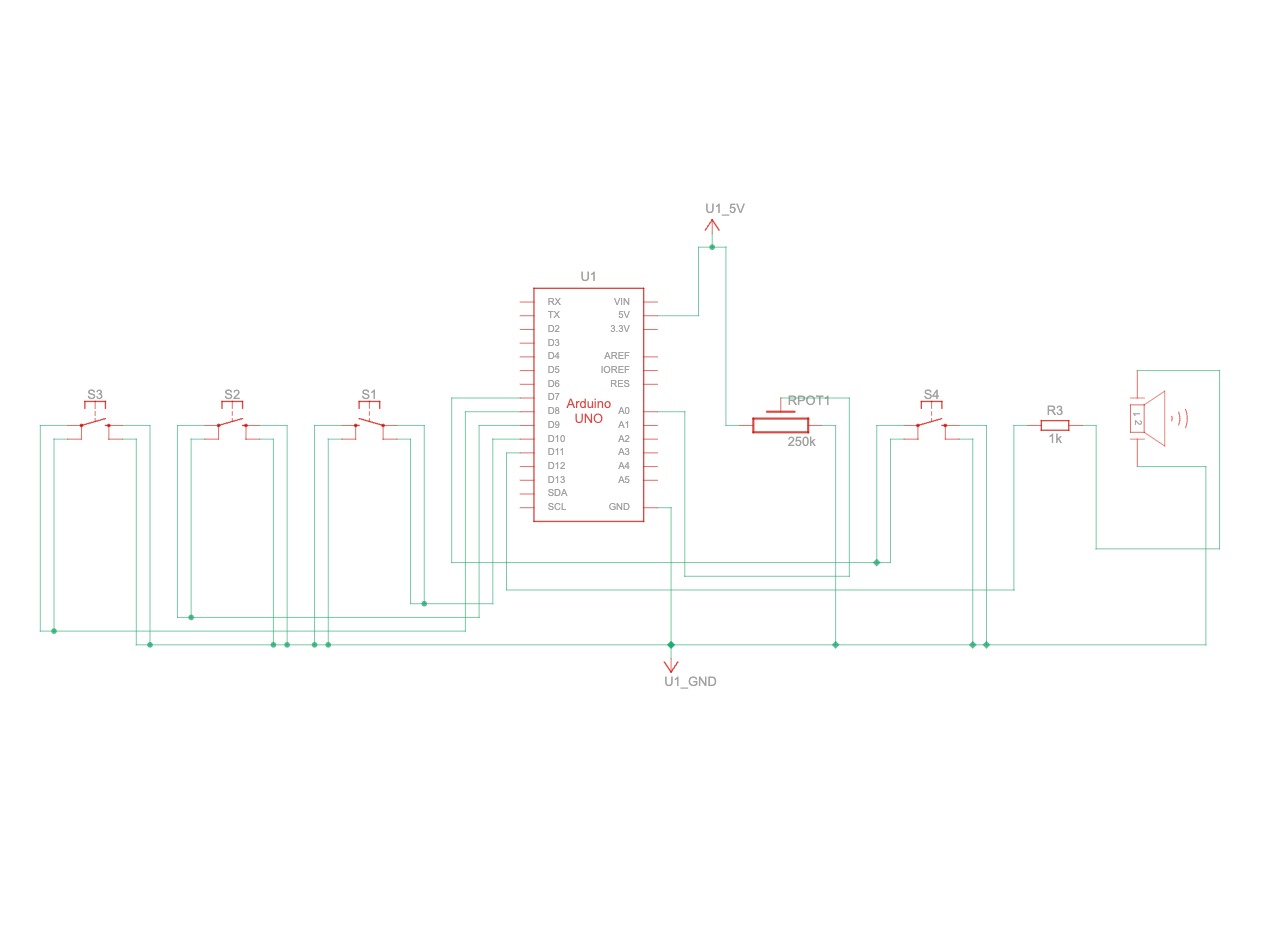
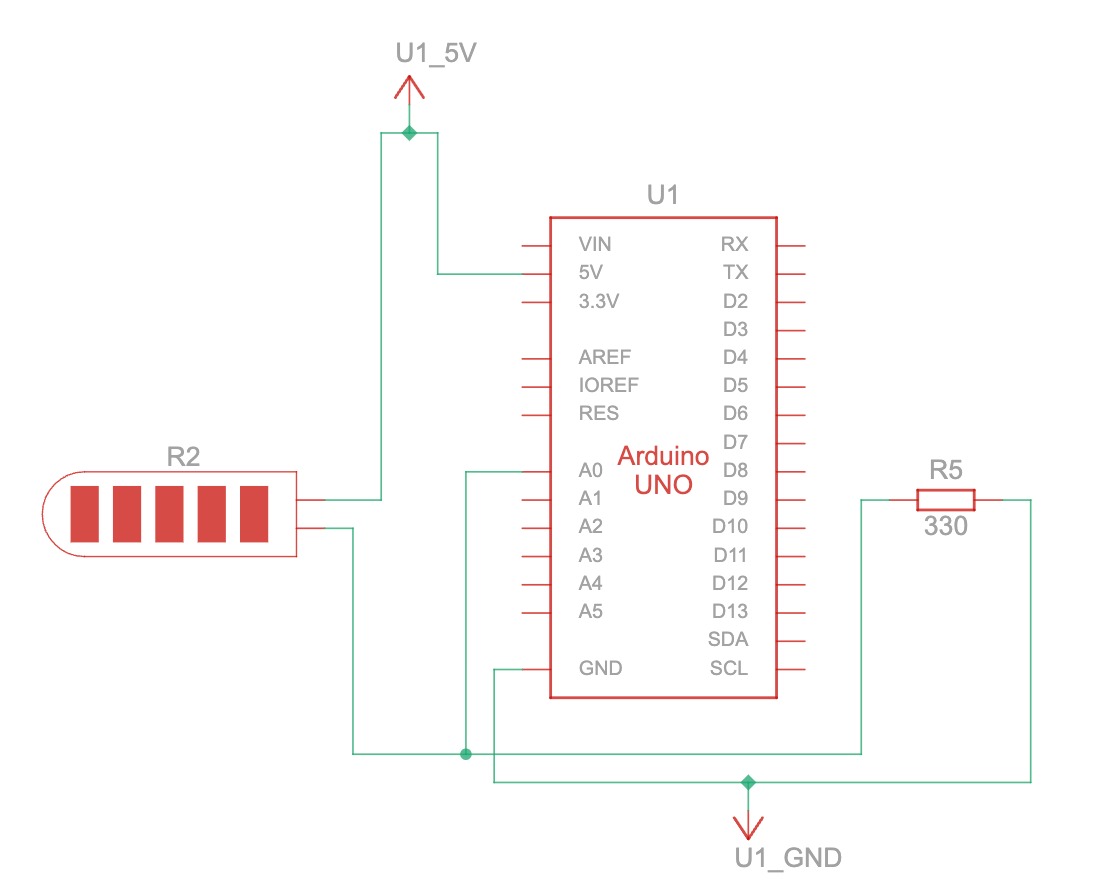
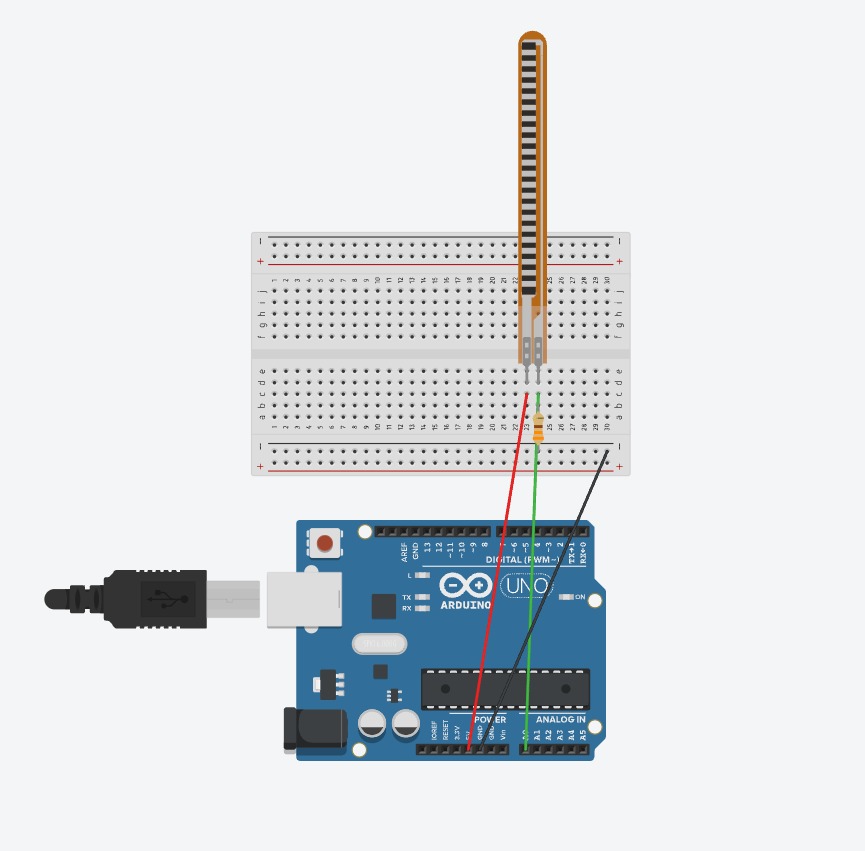
- Arduino Uno
- Breadboard
- flex sensor
- jumper wires
- 330 ohms resistors
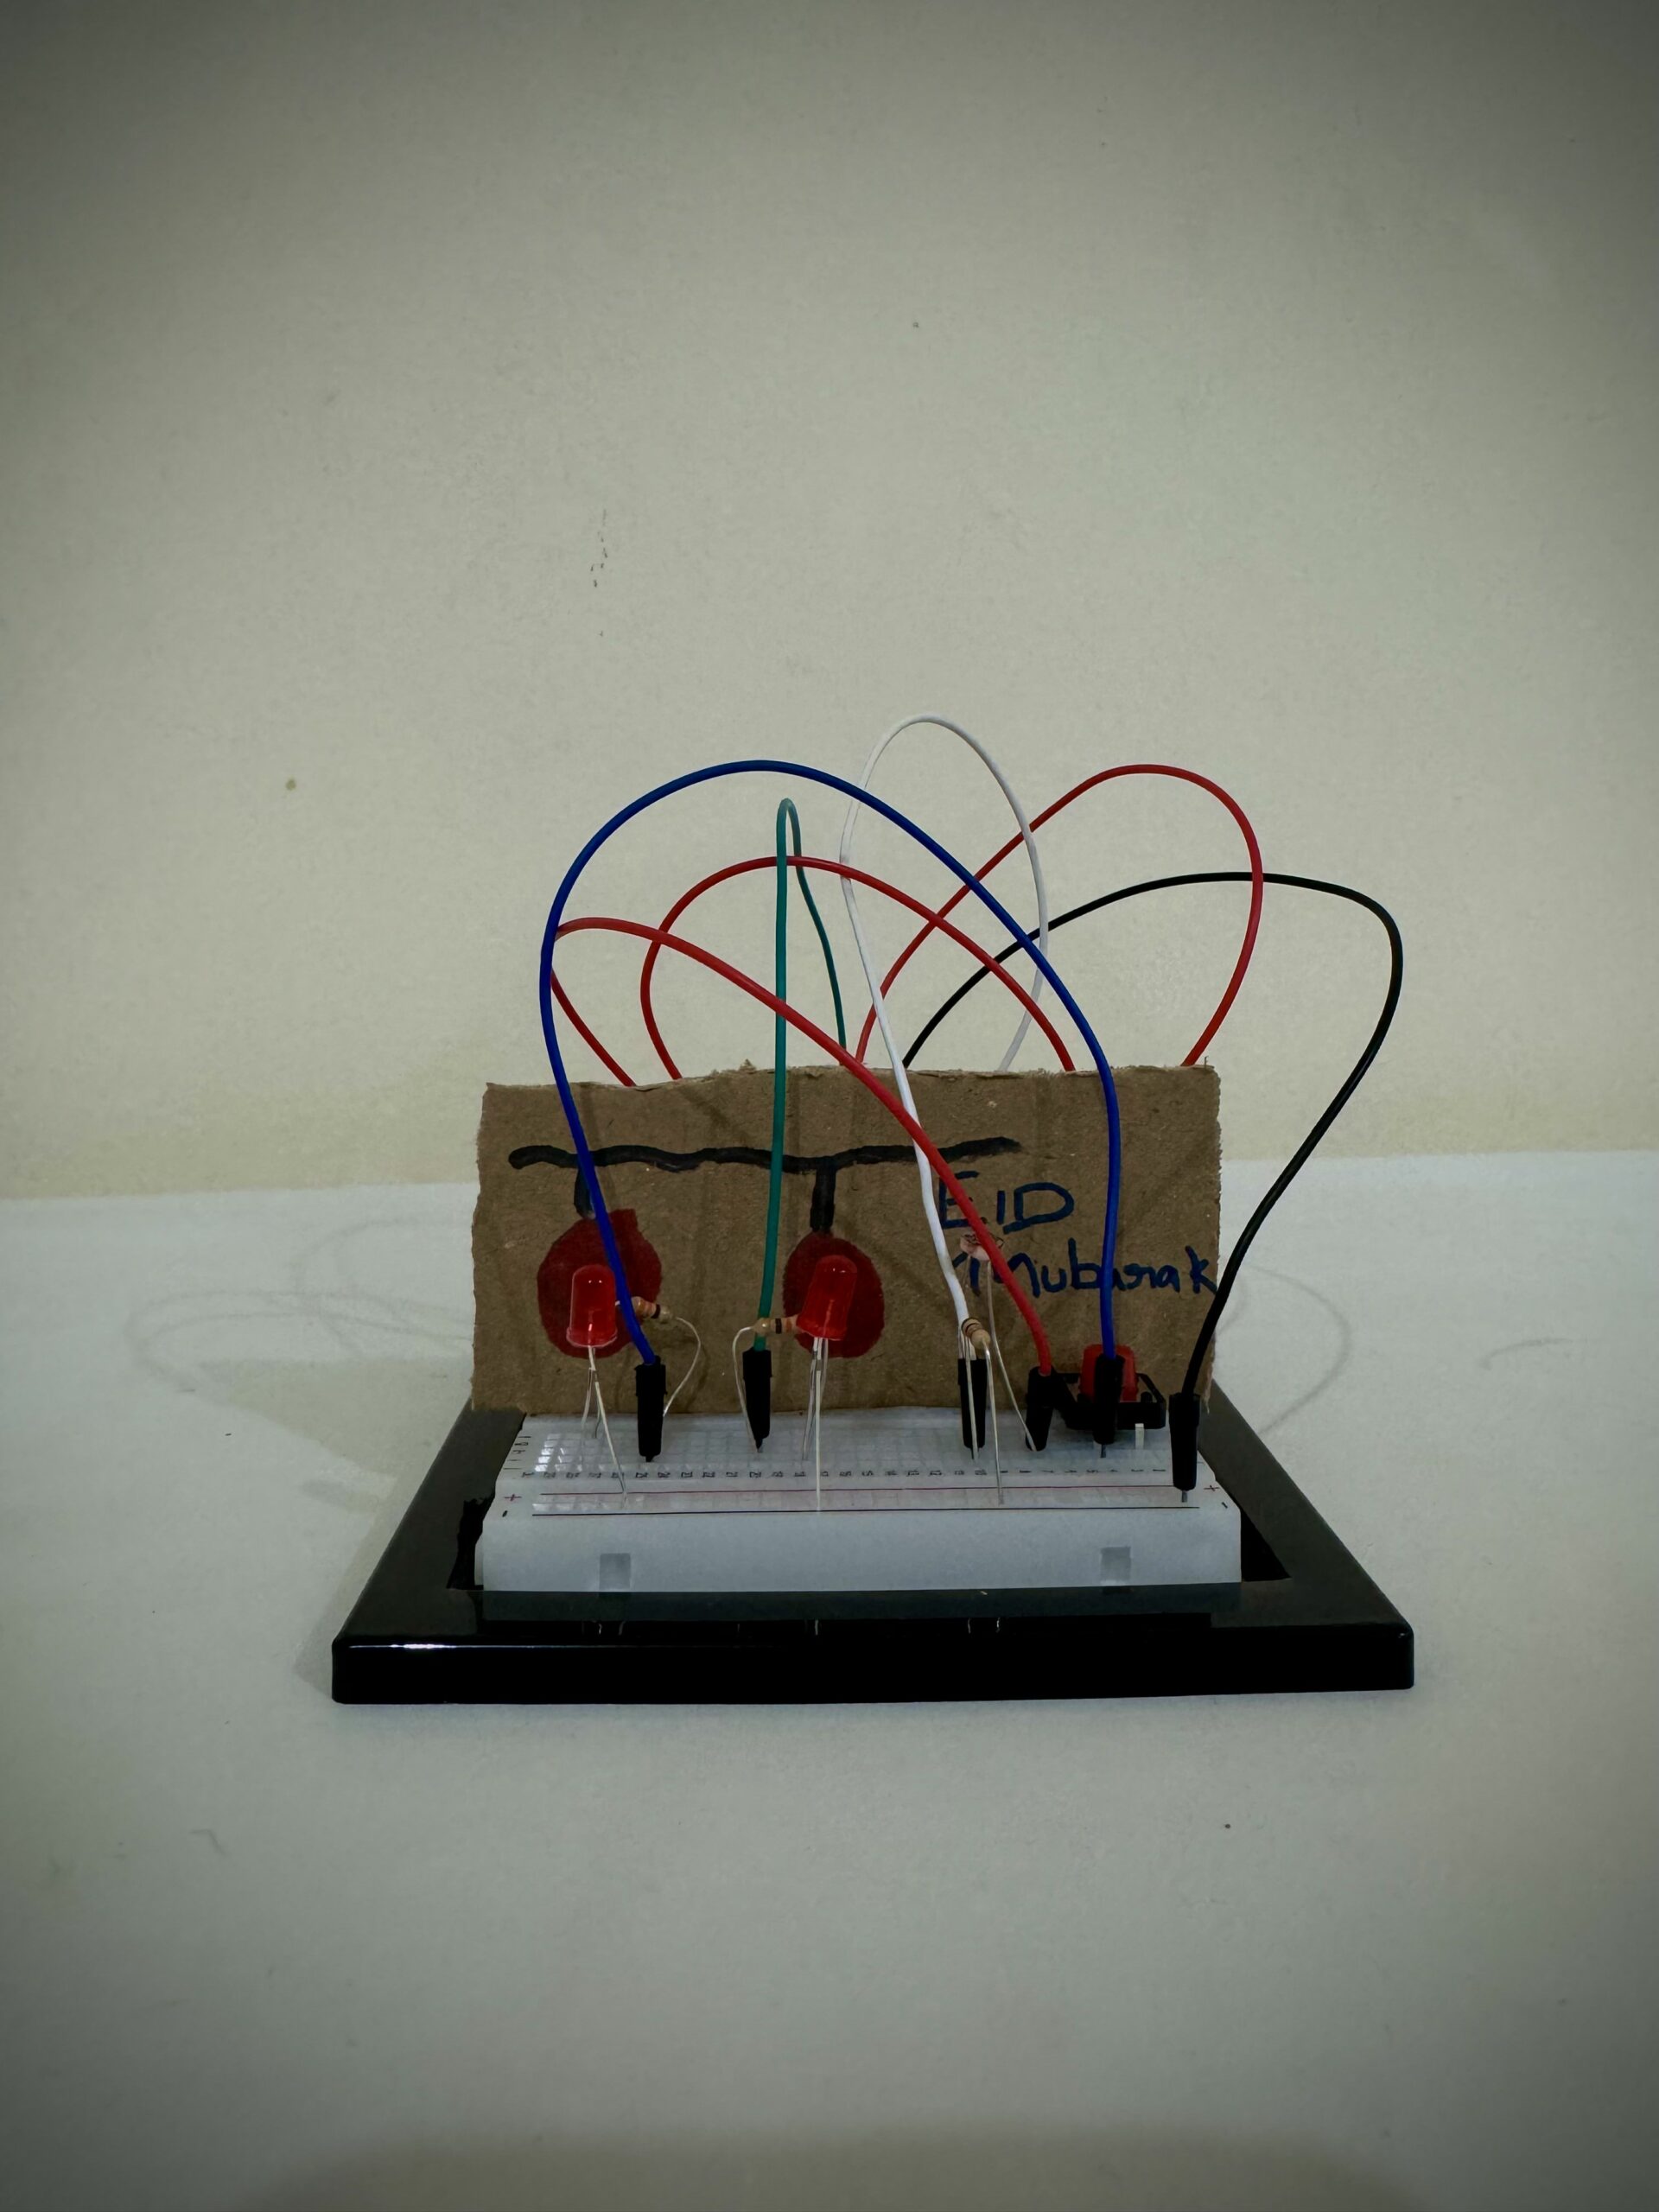
- Cardboards
Description of interaction design
When you squeeze the the stress ball, the spiral pattern in p5 starts animating and when the pressure applied on the stress ball increases, the Arduino reads it using the flex sensor and the speed of the spiral animation increases and the color changes to a dark red from a soft color, thus making it feel intense.
Arduino code
const int flexPin = A0;  // Analog pin for the flex sensor

int flexValue = 0; // Variable to store flex sensor value
int pressure = 0;  // Variable to store pressure level (mapped from flex sensor value)
int pressureMin = 10; // Minimum pressure value
int pressureMax = 1023; // Maximum pressure value

void setup() {
  Serial.begin(9600);
}

void loop() {
  // Read flex sensor value
  flexValue = analogRead(flexPin);

  // Map flex sensor value to pressure scale (0-100)
  pressure = map(flexValue, pressureMin, pressureMax, 0, 100);

  // Send pressure value to p5.js
  Serial.println(pressure);


  delay(100); // Adjust delay as needed
}
The A0 pin is used as the analog pin for the flex sensor.
// Map flex sensor value to pressure scale (0-100)
pressure = map(flexValue, pressureMin, pressureMax, 0, 100);
This code maps the flex sensor reading to a range between 0-100.
// Send pressure value to p5.js
Serial.println(pressure);
the above code is the communication from Arduino to p5.
p5.js code
function draw() {

  if (!patternsPage) {

    // Display starting page
    image(startingPage, 0, 0, windowWidth, windowHeight);

  } else {

    // Display patterns page
    image(bg, 0, 0, windowWidth, windowHeight); // Background image

    // Update and draw circles
    for (let i = 0; i < cols; i++) {

      for (let j = 0; j < rows; j++) {

        circles[i][j].display();
        circles[i][j].move(circleSpeed * pressure); // Update speed based on pressure

      }
    }


    // Draw pressure scales
    pressureMeterLeft.draw(pressure);
    pressureMeterRight.draw(pressure);


    // Draw texts
    fill('#704402'); // Set text color
    textAlign(CENTER, CENTER); // Align text to center
    text("Pressure: " + pressure, width / 2, 30); // Display pressure value


    // Display connection status
    if (!serialActive) { // If serial connection is not active
      fill('red'); // Set text color to red
      text("Press Space Bar to select Serial Port", windowWidth / 2, windowHeight - 20); // Display message to select serial port
    }
    else {

      // If serial connection is active
      fill(0, 255, 0); // Set text color to green
      text("Connected", windowWidth / 2, windowHeight - 20); // Display connected message

    }
  }
}
This function controls the visualization and text elements. If on the starting page, it displays the `startingPage` image, and if on the patterns page, it shows the `bg` image. It updates and draws stress-relief circles, adjusting their movement speed according to the pressure level. Pressure scales are drawn on the left and right sides using `pressureMeterLeft` and `pressureMeterRight`, representing the pressure level visually. The pressure value is displayed at the top center, and a message about the status of the serial port connection is shown at the bottom center. If the serial connection is inactive, it prompts the user to press the space bar to select the serial port; otherwise, it indicates that the connection is established.
// Circle class for moving circles
class Circle {

  constructor(cx, cy, angle) {

    this.angle = angle;
    this.cx = cx;
    this.cy = cy;
    this.baseColor = color('#F0D6B0'); // Green color for low pressure
    this.highPressureColor = color('rgb(179,1,1)'); // Red color for high pressure/

  }

  display() {

    push();
    translate(this.cx, this.cy);
    noFill();
    let c = map(abs(this.angle % TWO_PI), 0, TWO_PI, 0, 255);
    c -= map(pressure, 0, maxPressure, 0, 100); // Darken color based on pressure
    c = constrain(c, 0, 255);
    let currentColor = lerpColor(this.baseColor, this.highPressureColor, pressure / maxPressure); // Interpolate between green and red based on pressure

    noStroke();
    fill(currentColor);
    let x = r * cos(this.angle);
    let y = r * sin(this.angle);
    arc(x, y, size, size, this.angle, this.angle + PI / 2);
    pop();

  }

  move(speed) {

    this.angle -= speed;

  }
}
The `Circle` class defines the behavior and appearance of the patterns. Each circle is constructed with parameters for its center position (`cx` and `cy`) and its starting angle (`angle`). It has properties for colors representing low and high pressure, where green indicates low pressure and red indicates high pressure. The `display()` method draws the circle, adjusting its color based on the current pressure level. The circle’s position is translated to its center, and its color is determined by interpolating between the base color and high pressure color. The `move()` method updates the angle of the circle, causing it to rotate at a speed determined by the pressure level.
// PressureMeter class for the pressure scale
class PressureMeter {

  constructor(x, y, width, height) {

    this.x = x; // X position
    this.y = y; // Y position
    this.width = width; // Width
    this.height = height; // Height

  }

  draw(pressure) {

    // Draw pressure scale box
    noFill();
    stroke(10);
    rect(this.x, this.y, this.width, this.height); // Draw the rectangle outline\


    // Fill the pressure scale rectangle based on pressure
    let fillAmount = map(pressure, 0, maxPressure, 0, this.height); // Map pressure to the height of the rectangle

    fill('#985B00'); // Set fill color to brown
    noStroke();
    rect(this.x, this.y + this.height - fillAmount, this.width, fillAmount); // Draw the filled rectangle

  }
}
The `PressureMeter` class contains the visual representation of the pressure scale. It is initialized with parameters for its position (`x` and `y`), as well as its width and height. The `draw()` method is responsible for rendering the pressure scale on the canvas. It first draws the outline of the pressure scale box using the provided position, width, and height. Then, it calculates the fill amount based on the current pressure level, mapping it to the height of the rectangle. The fill color is set to brown, and a filled rectangle is drawn inside the outline, representing the current pressure level.
Embedded sketch
Description of communication between Arduino and p5.js
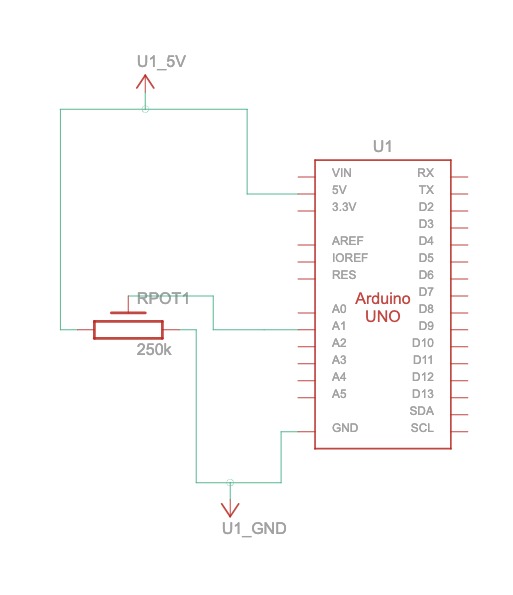
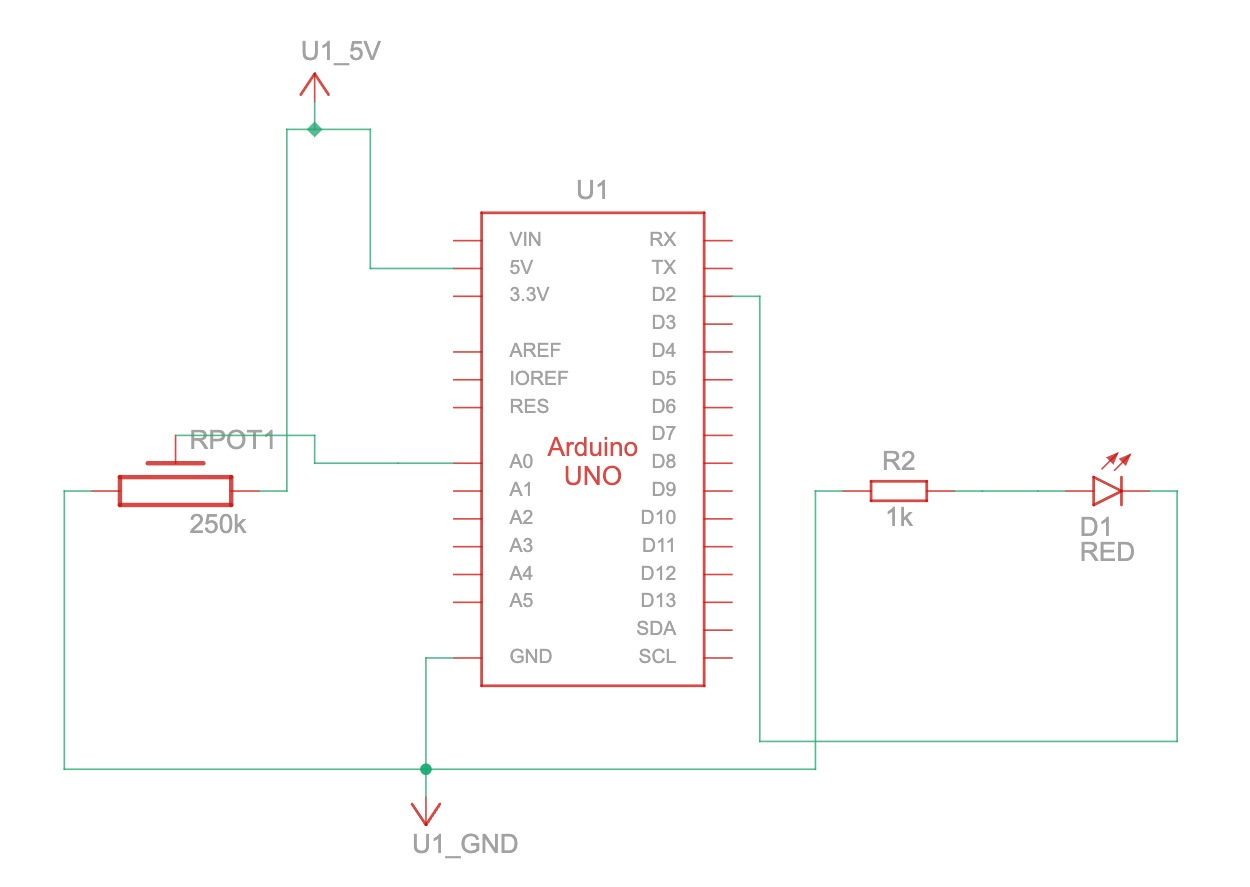
A stress ball is connected to a flex sensor, which is connected to A0 pin in Arduino Uno. The Arduino is connected to p5 using serial connection. When the stress ball is squeezed, the Arduino reads it with the help of the flex sensor and then maps the sensor reading between 0-100. The Arduino sends this mapped sensor readings to p5 through serial connection and the p5 uses this sensor readings to adjust the speed and color of the animation of the spiral pattern.
// Send pressure value to p5.js
Serial.println(pressure);
the above code is the communication from Arduino to p5.
Aspects of the project I’m proud of
resources used
Challenges faced and overcoming them
I’ve faced a number of challenges with this project.