Shoot and Score- Assignment 8

This week’s assignment involved creating a unique switch using the Arduino board. To be more specific, we needed to design a switch that could be activated without using our hands and without any additional coding. My idea for this project was to trigger an LED by completing a circuit through indirect user interaction, making it appear as if hands were not involved. Inspired by my love for football, I decided to take on this challenge because playing football doesn’t involve using your hands. I wanted to see how I could bring this concept to life.

This project presented a bit of a challenge for me since I am more comfortable with the software side of computing than the physical aspects. It felt like I was delving into a completely new subject. Below, you can see the initial sketch of my project, which outlines my concept.

I planned to connect the LED in a way similar to what we learned in class, but with a parallel setup to distribute resistance to both sides of the board. Additionally, I intended to set up a parallel connection for the 5V supply to ensure it reached both sides of the board. In this setup, when an aluminum ball was kicked into the “goal post,” the circuit would be short-circuited or completed, causing the LED to illuminate. A picture of my project is inserted below along with the link to my project video.

Circuit Diagram:

Picture of my project:

IMG_4043

Reflection and Future Improvements:

In terms of future improvements, I would like to focus on making the game more user-friendly by eliminating wires and creating a more efficient gaming space. I might also consider adding another LED to each team’s goal post to differentiate them. Nevertheless, I am proud of what I achieved in this assignment, and I look forward to facing more challenges in the upcoming projects.

Just Do It- Week 8 Reading Reflection

This week’s readings from Donald A. Norman, including “Emotions and Attractive” and “Her Code Got Humans on the Moon—And Invented Software Itself,” resonated with me and left me with some valuable insights. On one hand, the story of Margret Hamilton stands out as an inspiring example, not just for me, but for countless young women aspiring to make their mark in a predominantly male-dominated field. Her journey began without a clear goal or ulterior motive, yet it ultimately led to the creation of software that played a pivotal role in the Apollo missions at NASA, laying the foundation for modern computer software. Her story embodies the timeless principle of “just do it.”

Sometimes, self-doubt can creep in when we feel we’re not good enough or lack a full grasp of the subject matter. We might question whether we truly belong in certain spaces, especially when we don’t see others who look like us or have similar backgrounds. However, Hamilton’s remarkable journey serves as a powerful reminder that we can carve our own path and enter spaces we aspire to be in, regardless of the current occupants. You never know who might be watching or following in your footsteps.

Her journey, from starting something with no clear plan to creating an industry worth $400 billion, illustrates the incredible results that can emerge from hard work and dedication. This also connects with Norman’s readings because Hamilton didn’t create something for the sake of it; her work was both functional and aesthetically appealing, leaving an indelible mark on history. It emphasizes that our focus should not solely be on usability or aesthetics but on striking a balance with intention and purpose.

Margret Hamilton didn’t stumble upon the code that we now recognize as software; she crafted it with usability and a form of beauty that only programmers of her time could appreciate. Her deliberate approach propelled her to the position she holds today, serving as a true source of inspiration for me in my own career aspirations. Her story encourages me to follow a path that combines functionality and artistry, much like she did in her groundbreaking work.

Iron Knock- Midterm Project

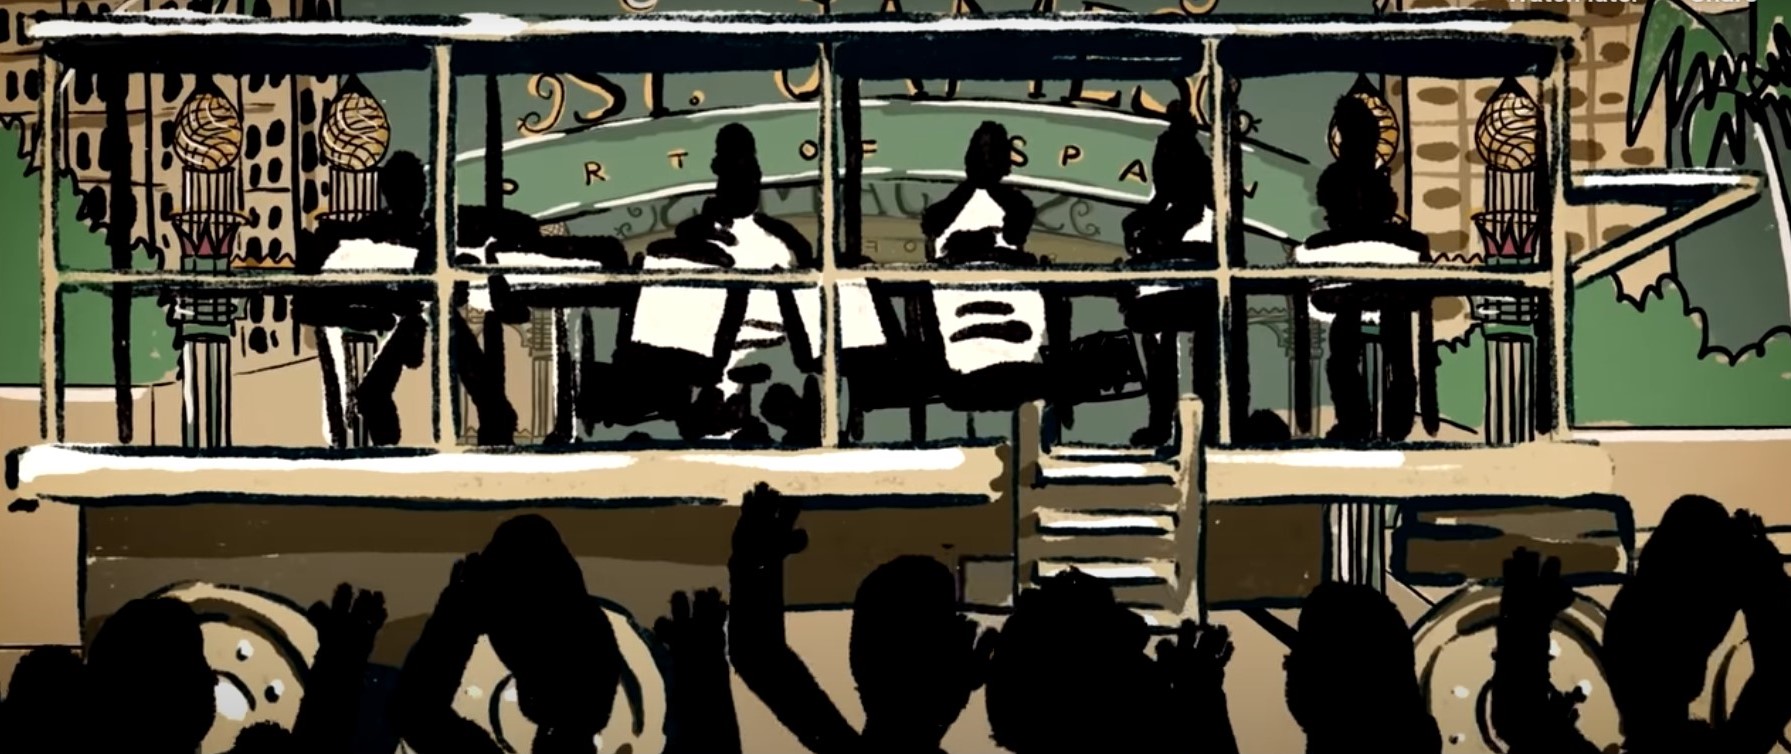
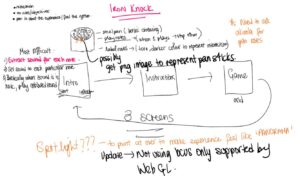
The name of my project originated from a saying back home used to describe the sounds of the steelpan being played, or the steel pan being tuned.

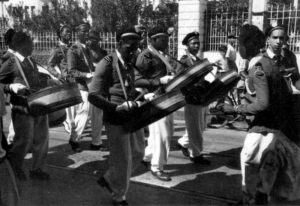
My project aimed to introduce users to the steelpan, the national instrument of Trinidad and Tobago, and provide them with an immersive experience of this unique musical creation. The steelpan’s distinct melodic, tonal, and rhythmic qualities have garnered global fascination and serve as a prominent cultural symbol of Trinidad and Tobago. Originally crafted from items like frying pans, dustbin lids, and oil drums in the 1930s, the steelpan has evolved into finely tuned sheet metal instruments.

Listening to the steelpan evokes a childlike sense of wonder, in me, and I think every other Trinbagonian. While it may sound like a cliché description of the emotional connection to music, it holds a profound truth, especially for Trinbagonians. The steelpan’s significance extends beyond its musical charm, intertwining with the cultural heritage and historical resistance against slavery in Trinidad and Tobago.


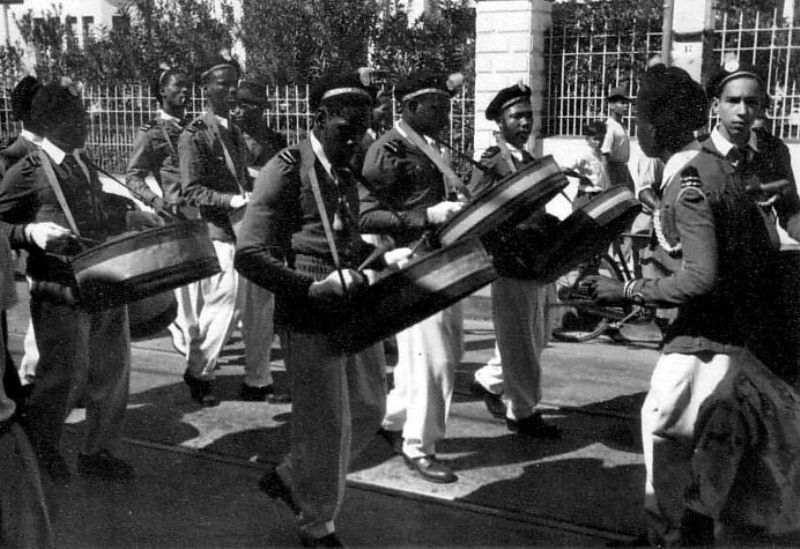
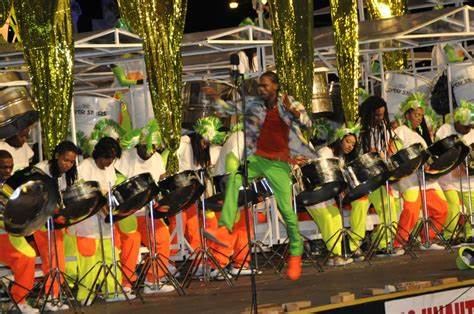
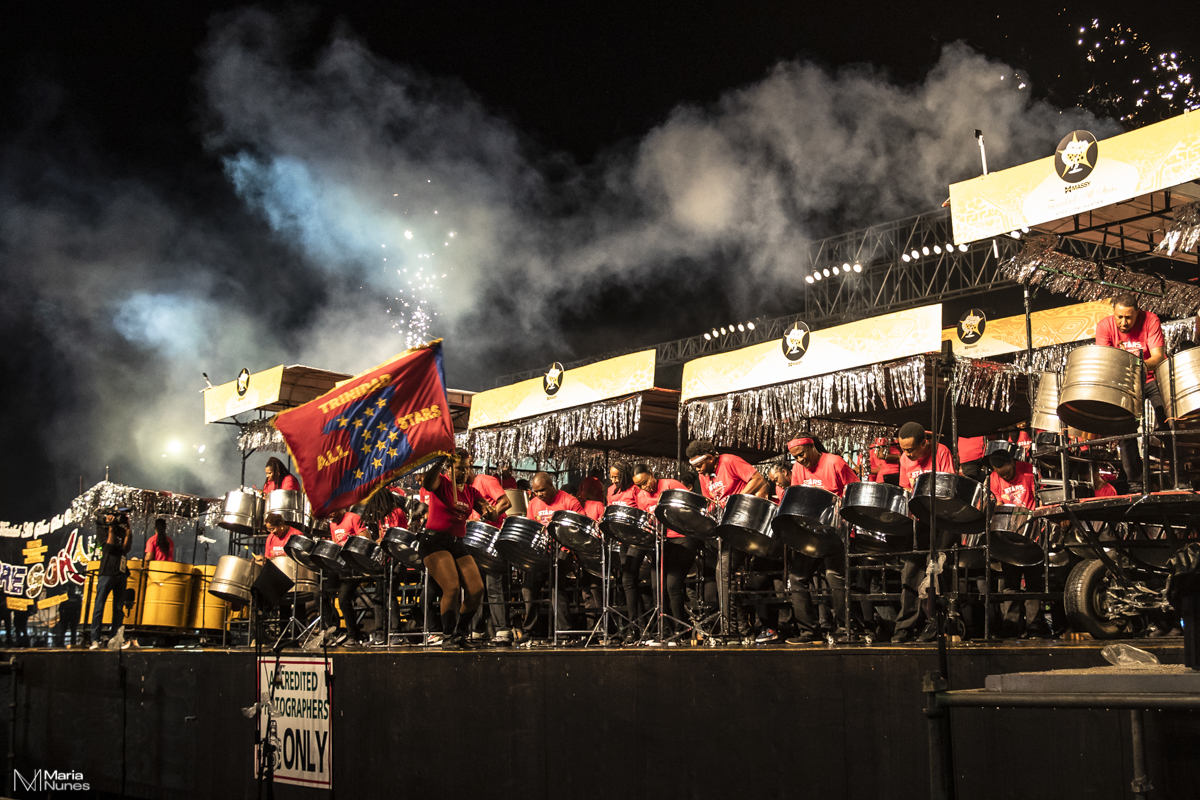
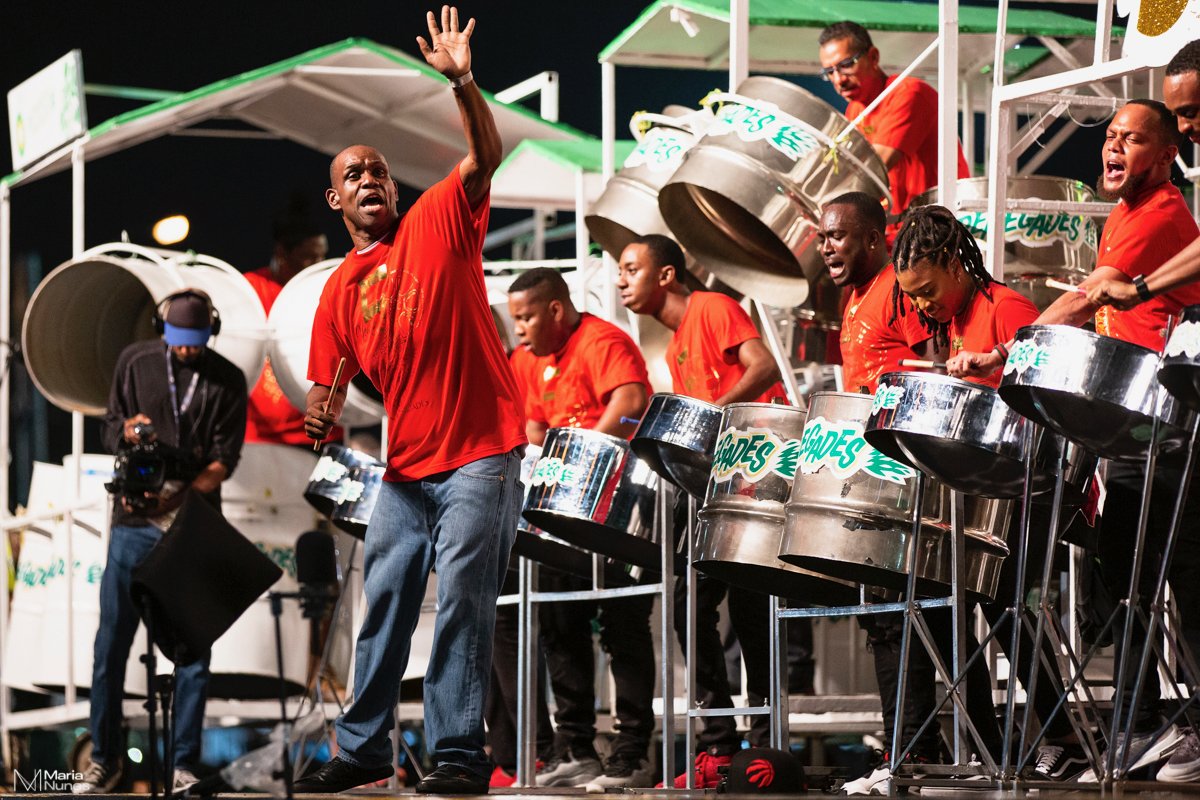
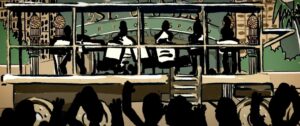
The vibrant chaos witnessed at events like Panorama captures the essence of steelpan music. It’s a beautiful chaos where everyone, regardless of age, is in motion. Steelpan is an integral part of the Trinbagonian identity, and I sought to convey this dynamic energy through the moving background, creating an immersive feeling that aligns with the live performances involving this extraordinary instrument.

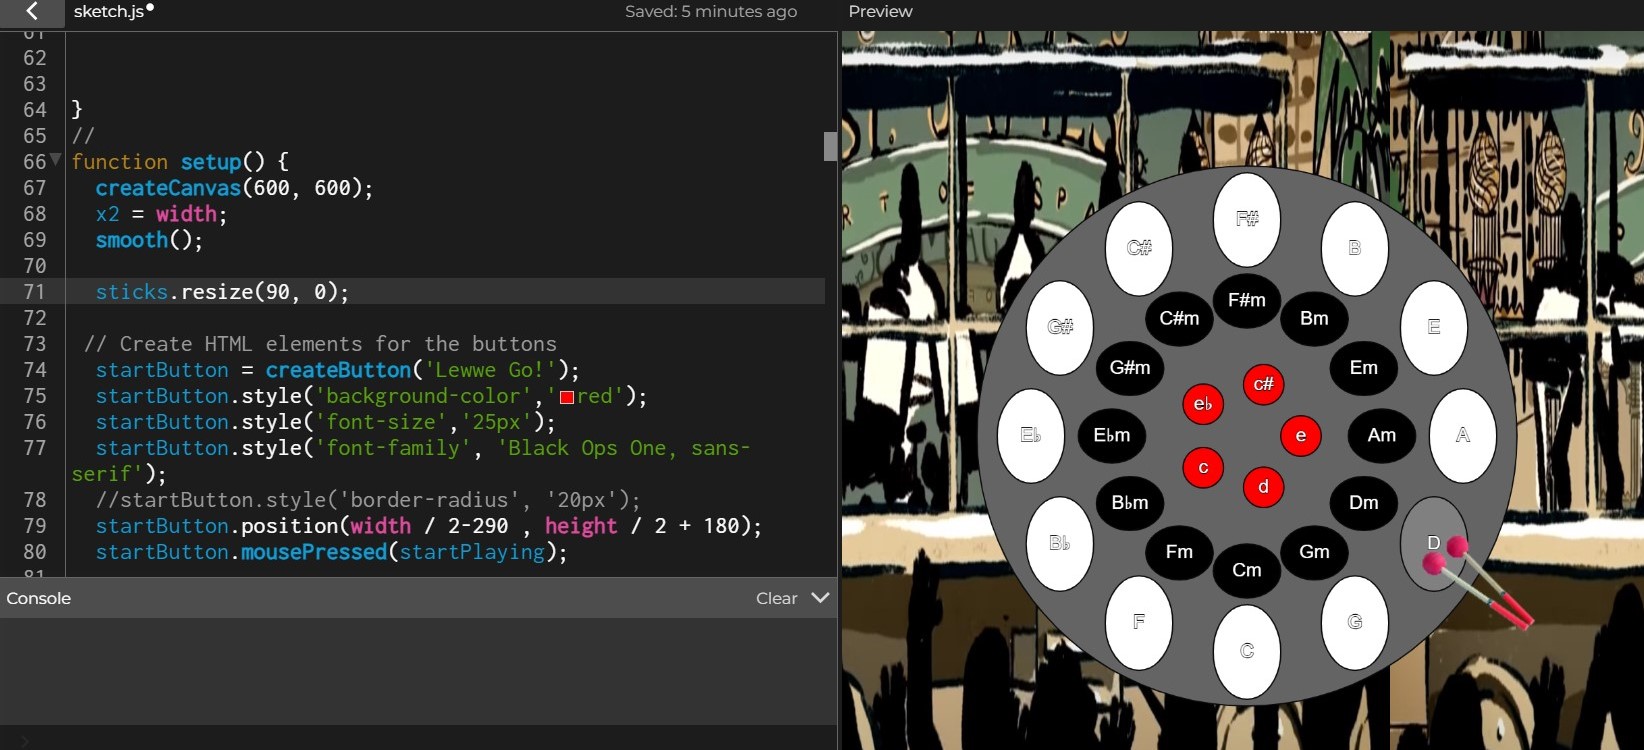
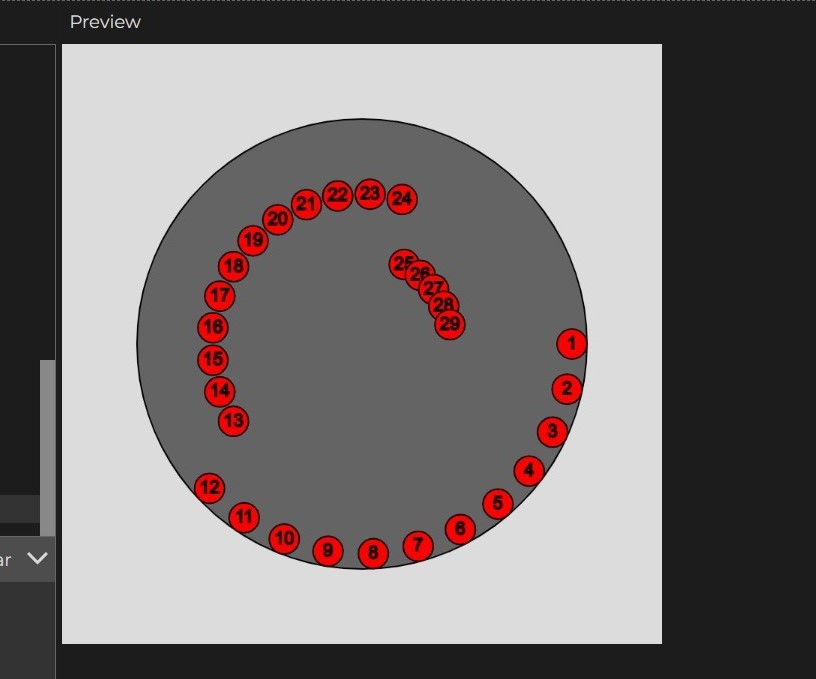
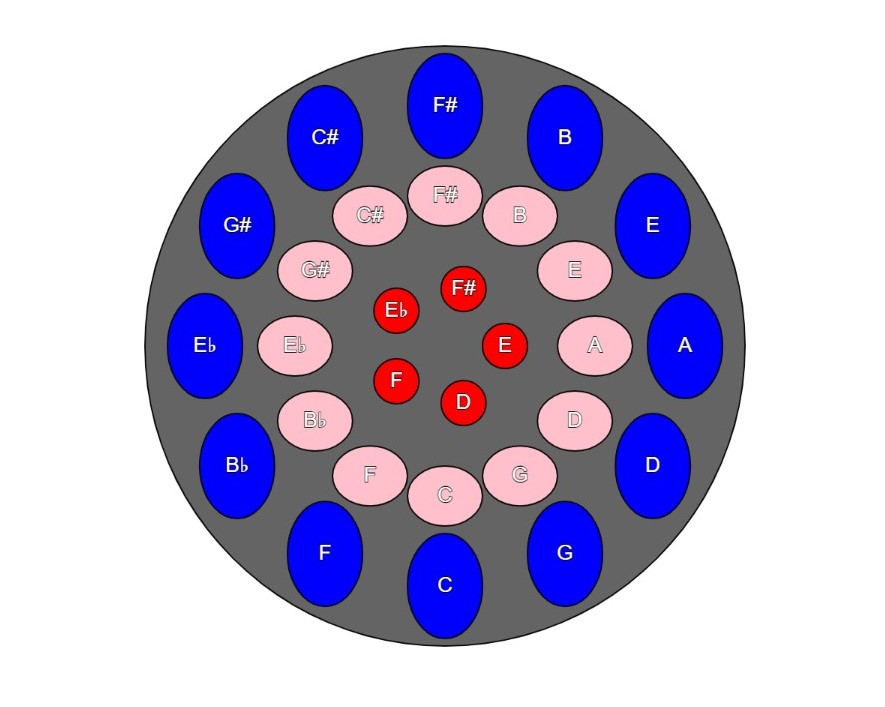
The sketch revolves around a steelpan instrument and is divided into an introduction screen, instructions screen and a game screen. The introduction screen offers options to start, end, or view instructions. Transitions between these states are controlled through flags (isIntroduction, isInstructions, isPlaying). In the game screen, there’s a scrolling background, and users can click on different segments of the steelpan to produce sounds. The instrument comprises three rows, and each row, represents the pitch, with the outer row, being the lowest, and the inner row, being the highest as these notes are smaller. The code checks the mouse’s proximity to trigger sound playback, and this is essentially how the user utilizes the sketch.

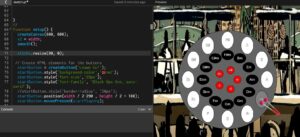
The part I’m most proud of is the Steelpan class in the p5.js sketch. It plays a vital role in managing and rendering the steelpan instrument, handling data about rows, labels, angles, and radii. The draw method takes care of the visual representation, managing row iteration, position calculation, and segment colour changes upon mouse hover. This class adheres to object-oriented principles, ensuring well-structured and maintainable code for the steelpan instrument.

class SteelPan {
  constructor(outerCount, middleCount, coreCount, outerRadius, middleRadius, coreRadius) {
    this.outerCount = outerCount;
    this.middleCount = middleCount;
    this.coreCount = coreCount;
    this.totalNotes = outerCount + middleCount + coreCount;
    this.outerLabels = ["A", "D", "G", "C", "F", "B♭", "E♭", "G#", "C#", "F#", "B", "E"];
    this.middleLabels = ["Am", "Dm", "Gm", "Cm", "Fm", "B♭m", "E♭m", "G#m", "C#m", "F#m", "Bm", "Em"];
    this.coreLabels = ["e", "d", "c", "e♭", "c#"];
    this.angleIncrementOuter = TWO_PI / outerCount;
    this.angleIncrementMiddle = TWO_PI / middleCount;
    this.angleIncrementCore = TWO_PI / coreCount;
    this.outerRadius = outerRadius;
    this.middleRadius = middleRadius;
    this.coreRadius = coreRadius;
  }

  draw() {
    fill(100, 100, 100);
    stroke(10);
    ellipse(width / 2, height / 2, 400, 400);

    // Draw the outer row
    for (let i = 0; i < this.outerCount; i++) {
      let angleOuter = i * this.angleIncrementOuter;
      let x = width / 2 + cos(angleOuter) * this.outerRadius;
      let y = height / 2 + sin(angleOuter) * this.outerRadius;
      let circleSize = 50;

      if (dist(mouseX, mouseY, x, y) < circleSize / 2) {
        fill('grey'); // Change to a darker color when hovering
      } else {
        fill('white'); // Default color
      }

      ellipse(x, y, circleSize, 70);
      fill(255);
      textSize(14);
      textAlign(CENTER, CENTER);
      text(this.outerLabels[i], x, y);
    }

    // Draw the middle row
    for (let i = 0; i < this.middleCount; i++) {
      let angleMiddle = i * this.angleIncrementMiddle;
      let x = width / 2 + cos(angleMiddle) * this.middleRadius;
      let y = height / 2 + sin(angleMiddle) * this.middleRadius;
      let circleSize = 50;

      if (dist(mouseX, mouseY, x, y) < circleSize / 2) {
        fill('darkgrey'); // Change to a darker color when hovering
      } else {
        fill('black'); // Default color
      }

      ellipse(x, y, circleSize, 40);
      fill(255);
      textSize(14);
      textAlign(CENTER, CENTER);
      text(this.middleLabels[i], x, y);
    }

    // Draw the core row
    for (let i = 0; i < this.coreCount; i++) {
      let angleCore = i * this.angleIncrementCore;
      let x = width / 2 + cos(angleCore) * this.coreRadius;
      let y = height / 2 + sin(angleCore) * this.coreRadius;
      let circleSize = 30;

      if (dist(mouseX, mouseY, x, y) < circleSize / 2) {
        fill('darkred'); // Change to a darker color when hovering
      } else {
        fill(255, 0, 0); // Default color
      }

      ellipse(x, y, circleSize, circleSize);
      fill(255);
      textSize(14);
      textAlign(CENTER, CENTER);
      text(this.coreLabels[i], x, y);
    }
  }
}

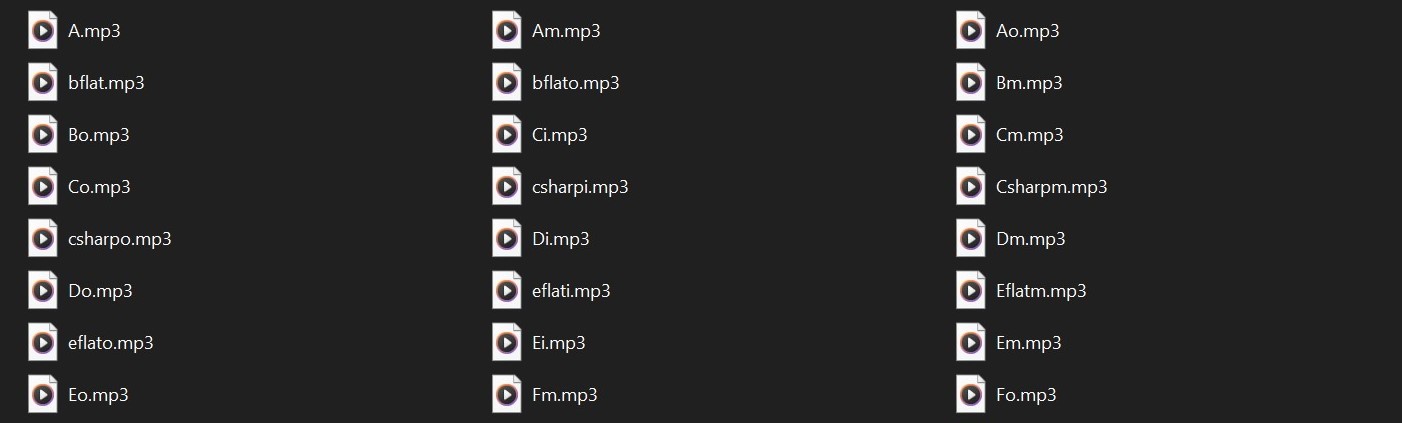
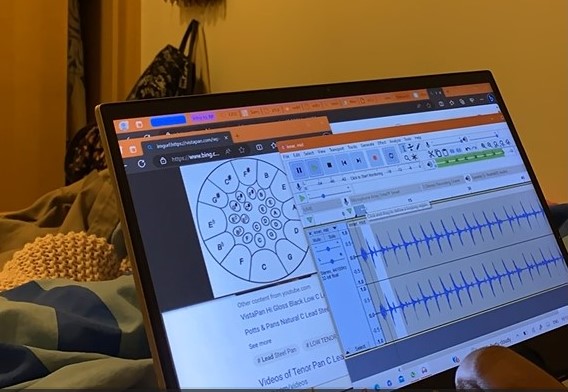
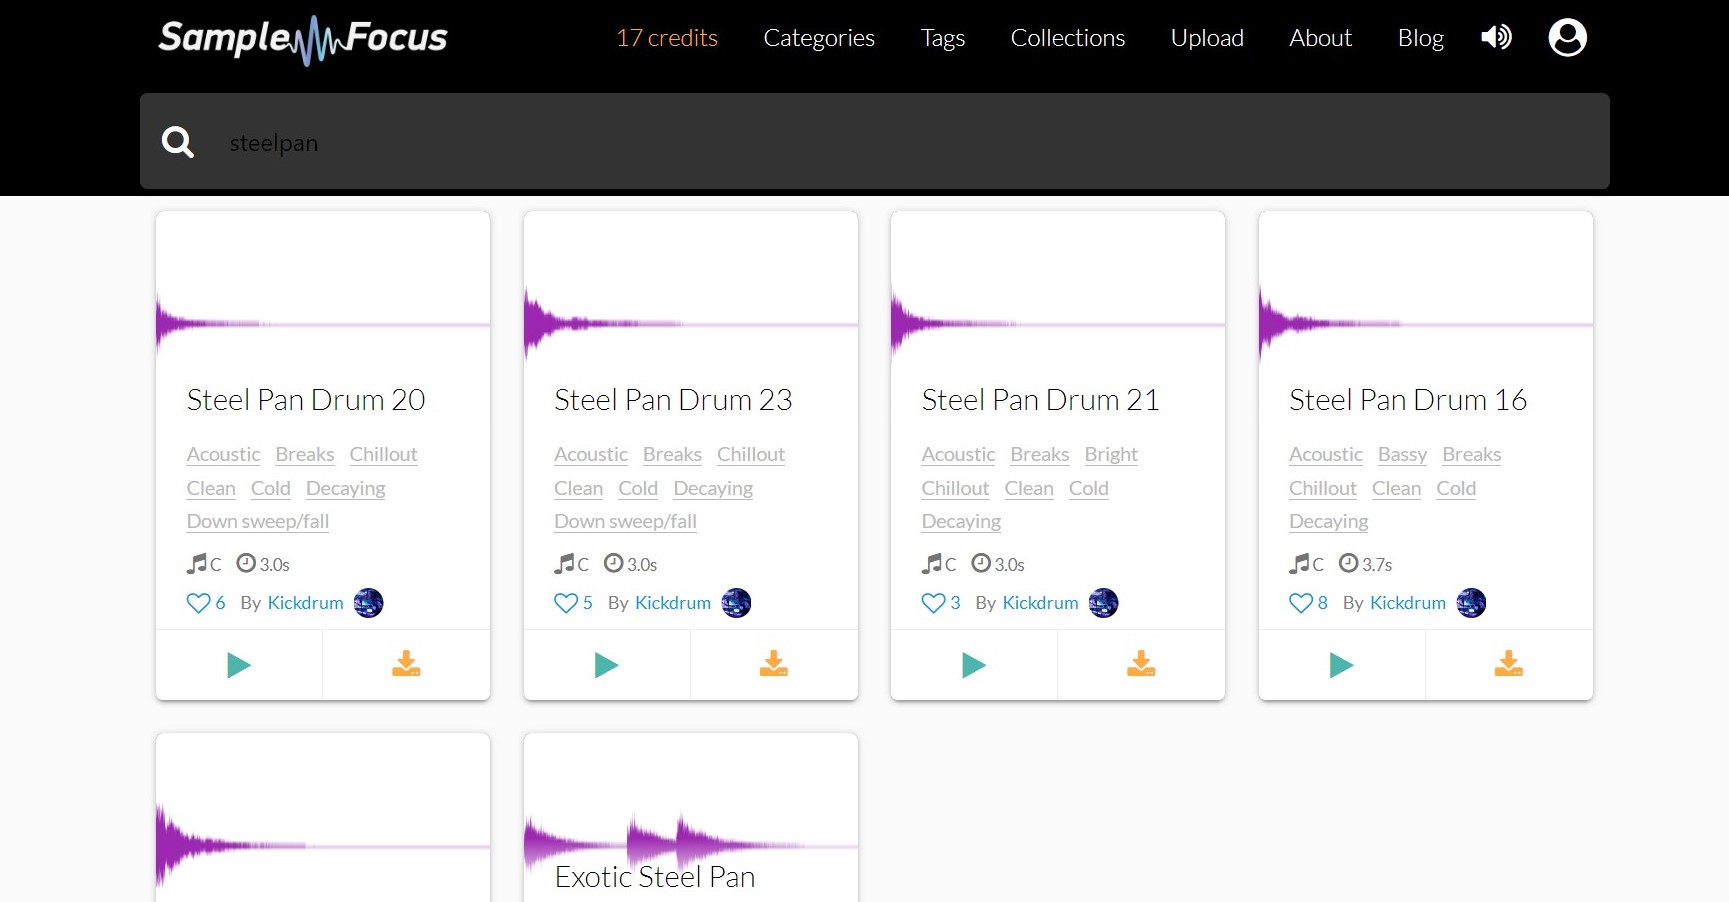
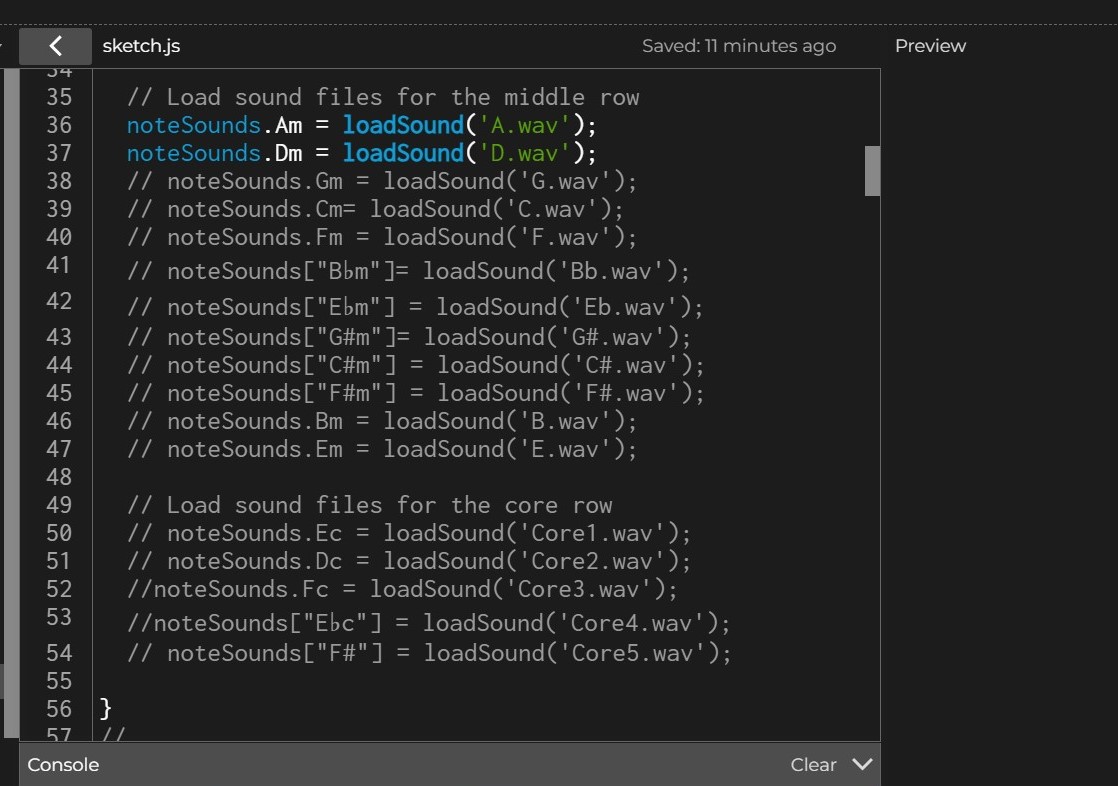
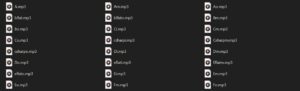
Moreover, I take pride in successfully managing the specific sounds assigned to each note in the steelpan. Proper labelling and space allocation were crucial, and the effort put into uploading each note and linking it to the sketch brought the project to life, achieving the desired outcome. This, however, was by far the most tedious process, and the most challenging, because my initial plan to source the notes via an online website failed. So instead, I had a family member play each individual note on the steelpan, record it and send it to me.

To enhance this project, I have several goals in mind. Firstly, I aim to refine the note playing functionality to allow for overlapping sounds, ensuring a seamless musical experience. This will enable me to capture the authentic rhythm and intricacies of the steelpan, encompassing elements like melody, rhythm, and harmony. Additionally, I want to introduce a multiplayer aspect by using the steelpan class to create multiple pans. This would provide users with a glimpse into the dynamics of a real Steelpan band.

Despite the challenges, I take pride in the outcome of this project. It served as a combination of the knowledge I’ve acquired over the past seven week, plus some. It highlights my integration of various concepts and techniques and reflects my dedication to my home, Trinidad, and Tobago. Below is the embedded sketch.

Iron Knock- Midterm Assignment Progress Report 2

So, Far…

During this week’s progress report on my midterm project, I focused on a crucial aspect: integrating sound into my steelpan simulation. To achieve this, I created a specialized “object” within my code to neatly organize the sound files for each note. This object, named “noteSounds” in the code, serves as a sort of playlist where I store all the distinct sounds I intend to use. Just like individual songs in a playlist, each sound file is stored separately for easy access.

To ensure precision and avoid any mix-up between notes, I carefully assigned notes to their respective rows on the steelpan. This separation of notes into rows played a key role in achieving accuracy. In essence, rather than directly assigning a sound to a note, I associated it with a specific position on the canvas.

The process involved loading these sound files before using them, much like preparing a playlist before listening to songs. When you click on a note, the code identifies which note you’ve clicked and plays the corresponding sound file. Think of it as striking a key on a piano to produce a sound.

Admittedly, grasping this concept and implementing it did consume a significant amount of time. However, breaking down my code and attaching sound to one row at a time proved to be an effective strategy. It allowed me to avoid overwhelming complexity and troubleshoot more efficiently.

One challenge I encountered was the limited availability of sound files for the steelpan notes on the website I initially used as a source. So, while I downloaded all the available files, they were incomplete and did not correctly represent the notes of the steelpan.

To overcome this, I reached out to a family member who is skilled in playing the steelpan. They played each note and sent me the sound files directly. This resourcefulness enabled me to continue progressing with my project.

For the outer row of notes, I have successfully integrated sound using the available sound files. However, for the middle and core rows, I’ve temporarily included placeholder values. These will be replaced once I receive the sound files from my uncle, who is assisting with this aspect.

Essentially the code works but, for the moment I have commented out the sound objects until the correct sound files are in my possession.

Future Additions:

Looking ahead, my future additions to the project include refining the instructions screen to ensure its functionality and user-friendliness. This should take approximately one day to complete. Subsequently, I will focus on enhancing the overall aesthetics of my project, bringing it closer to completion.

My ultimate goal is to create an engaging and immersive steelpan experience, reminiscent of Trinidad and Tobago’s renowned “Panorama” event, where Steelband compete passionately. I aspire to replicate this cultural experience within my sketch to offer users a genuine taste of the Trinidad and Tobago steelpan tradition.

Below is an embedded sketch of my work:

<iframe “width: 640px; height: 360px; overflow: hidden;” src=”https://editor.p5js.org/KhaleeqaAasiyah/full/pXR0hhpH4″>

Iron Knock-Midterm Assignment Progress Report 1

Concept:

The Steelpan is an integral part of Trinidad and Tobago’s cultural identity, serving as our national instrument and an emblem of our unique spirit. It transcends being a mere musical instrument; it’s a symbol of the heart and soul of our vibrant Caribbean culture. The Steelpan’s roots trace back to the early 20th century when resourceful Trinidadians ingeniously transformed discarded oil drums into melodic instruments. This innovation birthed a distinctive musical tradition that has not only captured the essence of our culture but has also resonated globally. And so, my project is a heartfelt celebration of this rich cultural heritage. I have decided to craft an engaging digital Steelpan experience that invites users to play the instrument through interacting with the mouse. (This might be changed to the keys).

Classes and Functions:

Steelpan Class: At the core of my project lies the steelpan class, an embodiment of the instrument itself within the digital realm. It comprises three rows – the outer, middle, and core – each adorned with circles representing the musical notes. The steelpan class is responsible for the visual representation of the steelpan and labelling each note seen on the pan that would be a direct instruction as to which note the user should play or click, to trigger the actual sound for this note.

I have already created numerous functions that perform major functions like operating the start and end buttons and the draw function that brings everything together.

Below is a snippet of the steelpan class.

draw() {
    // Draw the outer body of the steel pan
    fill(100, 100, 100);
    stroke(10);
    ellipse(width / 2, height / 2, 400, 400);

    // Draw the circles for the outer row with labels and hover effect
    for (let i = 0; i < this.outerCount; i++) {
      let angleOuter = i * this.angleIncrementOuter;
      let x = width / 2 + cos(angleOuter) * this.outerRadius;
      let y = height / 2 + sin(angleOuter) * this.outerRadius;
      let circleSize = 50;

      // Check if the mouse is inside the circle
      if (dist(mouseX, mouseY, x, y) < circleSize / 2) {
        fill('darkblue'); // Change to a darker color when hovering
      } else {
        fill('blue'); // Default color
      }

      ellipse(x, y, circleSize, 70);
      fill(255);
      textSize(14);
      textAlign(CENTER, CENTER);
      text(this.outerLabels[i], x, y); // Display the label for the circle
    }

    // Draw the circles for the middle row with labels and hover effect
    for (let i = 0; i < this.middleCount; i++) {
      let angleMiddle = i * this.angleIncrementMiddle;
      let x = width / 2 + cos(angleMiddle) * this.middleRadius;
      let y = height / 2 + sin(angleMiddle) * this.middleRadius;
      let circleSize = 50;

      // Check if the mouse is inside the circle
      if (dist(mouseX, mouseY, x, y) < circleSize / 2) {
        fill('darkpink'); // Change to a darker color when hovering
      } else {
        fill('pink'); // Default color
      }

      ellipse(x, y, circleSize, 40);
      fill(255);
      textSize(14);
      textAlign(CENTER, CENTER);
      text(this.middleLabels[i], x, y); // Display the label for the circle
    }

    // Draw the circles for the core row with labels and hover effect
    for (let i = 0; i < this.coreCount; i++) {
      let angleCore = i * this.angleIncrementCore;
      let x = width / 2 + cos(angleCore) * this.coreRadius;
      let y = height / 2 + sin(angleCore) * this.coreRadius;
      let circleSize = 30;

      // Check if the mouse is inside the circle
      if (dist(mouseX, mouseY, x, y) < circleSize / 2) {
        fill('darkred'); // Change to a darker color when hovering
      } else {
        fill(255, 0, 0); // Default color
      }

      ellipse(x, y, circleSize, circleSize);
      fill(255);
      textSize(14);
      textAlign(CENTER, CENTER);
      text(this.coreLabels[i], x, y); // Display the label for the circle
    }
  }
}


Challenges Faced:

Already I encountered many challenges but a particularly difficult one, was the assignment of notes to each circle within the Steelpan, and the position of these notes. The notes at the beginning formed half of a circle instead of a full circle, and to fix this I had to play with angle increment and ensure that it was suited to each row of circles and not the entire pan. So, I had to break each row into different for loops and then I was able to get the look I was initially going for.

Before:


After:


Another challenge I foresee for the future is then using arrays to assign a specific sound for each note on the pan. After watching a few videos on how to assign sound to more than one object when the mouse is pressed, I realized that I would have to use an array to store the sounds for each row, and then allocate these sounds to the individual circles with each respective row. I want to reduce the risk of misalignment, so I have to be especially careful when assigning the sound to each note.

Next Steps:

Nevertheless, this is just the beginning. My focus in the next phase of this project is to source the audio for each note, from (WEBSITE) and save them accordingly. After this I would be solely working on ensuring that the sound and the notes align correctly as this is the only way the users would have an opportunity to delve deeper into the rich culture of Trinidad and Tobago.

Below is an embedded sketch of my work:

Computer Aided Vision 4 Artists n Designers.

Golan Levin’s article, “Computer Vision for Artists and Designers: Pedagogic Tools and Techniques for Novice Programmers,” introduces us to the world of computer vision, which involves computer algorithms that enable computers to understand images and videos. In the past, this field was primarily the domain of experts in fields like signal processing and artificial intelligence. However, things have changed, and computer vision is now becoming more accessible to regular people, especially students and artists, thanks to improved software tools and open-source communities. This accessibility has led to a surge in the use of computer vision for creating art and interactive experiences that bridge the gap between humans and computers.

One notable example mentioned in the article is the “SuicideBox” installation by Natalie Jeremijenko and Kate Rich. This installation serves as a thought-provoking exploration of technology, surveillance, and social issues. It was designed to measure the hypothetical “Despondency Index” of a location but inadvertently captured real data related to suicide jumpers from the Golden Gate Bridge. This project vividly illustrates the power of technology, particularly machine-vision-based surveillance, in revealing hidden aspects of society. It raises ethical questions about recording such events and underscores the unique role of artists in addressing sensitive, often overlooked issues.

What struck me most in the article was how computer vision, initially perceived as something artistic and cool, can be used to tackle complex real-world problems. “Suicide Box” serves as a powerful reminder of the intricate moral and ethical dilemmas that can arise at the intersection of art, technology, and sensitive real-world issues.

Levin also provides insights into the technical aspects of computer vision, explaining how components like Background Subtraction work. This ties in with the “SuicideBox” project, as it used this technique to trigger recording when a vertically moving object was detected while ignoring stationary objects. It piqued my interest in seeing how technical terms in the interactive world can be applied to solve real-world problems and make human life more manageable, which is the essence of what technology should achieve.

The Psychopathology of Everyday Things.

In the first chapter of “The Design of Everyday Things” by Donald A. Norman, he talks about how the design of everyday things can sometimes make us feel like we’re going crazy. It’s interesting how he points out that it’s not us who are the problem but the things we use. He calls this “the psychopathology of everyday things,” which is a fancy way of saying that sometimes everyday objects are just designed poorly.

I totally agree with Norman when he says that good design should be all about making things easy for us, regular people. It shouldn’t be about designers showing off how clever they are. Who wants to struggle with a door handle or a confusing remote control? It’s frustrating!

One big takeaway from the chapter is that designers need to think about how people actually use things in their daily lives. They can’t just dream up fancy ideas without considering how those ideas will work in the real world. Design should be all about making our lives easier and more convenient, not more complicated. This is emphasized in this passage where he mentions Human-Centered Design, that essentially takes into consideration the user. This type of design is made for the people by the people, and it enhances the lives of its users and produces positive results.

So, in a nutshell, I think Norman’s point about designing things for the way people are, not the way designers wish they were, is spot on. Good design is all about making our lives simpler, not adding unnecessary complexity. It’s a reminder that when things are hard to use, it’s not our fault – it’s bad design. And that’s something we can all relate to!

Temperature Trends- Assignment 4

For this week’s assignment, I had to choose between creating data visualizations or generating text output. I decided to work on data visualization because I thought it was interesting to be able to represent data in any way I choose. My first challenge was finding the right dataset to work with. There were so many options, and I needed to make sure the data could be effectively represented. Eventually, I settled on using weather data from the United States, which I found interesting because it included dates spanning over two years, along with average, maximum, and minimum temperatures recorded each day, as well as historical record temperatures.

To visualize this data, I created a simple line graph. The graph had a title, a legend, and labels to represent the average maximum and minimum temperatures recorded over the years. The graph displayed two distinct lines, one in purple for minimum temperatures and one in pink for maximum temperatures. Below, you can see a sketch of my graph:

I faced several challenges while working on this project. First, I had to figure out how to smooth out the curves in the graph to make it look more polished. Without this adjustment, the graph had sharp and jagged edges that didn’t look right.

Another issue I encountered was related to the coloring of the graph lines. I initially set specific colors for the stroke lines but didn’t realize that the beginShape and endShape functions had built-in fill settings, causing the graph to be filled with black, which didn’t go well with the sharp edges.

Additionally, I struggled with setting the margins correctly. Initially, I used regular height and width functions and assumed the graph would fit within those parameters, but it extended beyond the canvas boundaries. By setting a standard margin value and subtracting it from the height and width, I was able to ensure the graph was drawn appropriately and to the scale of the canvas.

The part of my code that I’m most proud of is the function I created to draw the temperature lines. This function allowed me to input values from the CSV file and determine whether it was for maximum or minimum temperatures. Below is an insert of that code.

function drawTemperatureLine(temperatures, tempMin, tempMax, lineColor) {
  noFill();
  stroke(lineColor);
  strokeWeight(2);
  beginShape();
  
  // Loop through each data point (temperature)
  for (let i = 0; i < temperatures.length; i++) {
    // Map the data point's position to the canvas coordinates
    let x = map(i, 0, temperatures.length - 1, margin, width - margin);
    let y = map(temperatures[i], tempMin, tempMax, height - margin, margin);
    
    // Add a curve vertex at the mapped position
    curveVertex(x, y);
  }
  endShape();
}

I separated most of my code into functions. This code is responsible for drawing the temperature lines and looping through each data point in the csv file and mapping this point onto the canvas. This function is then called inside of the drawLineGraph function, that then draws the entire graph that is inclusive of labels, legend, and titles.

Overall, this project was a relatively simple generative art piece in terms of design, but it was also the most challenging one I’ve worked on. I had to apply a lot of theoretical knowledge and do some research to overcome various obstacles. For future improvements, I would like to create separate line graphs for each dataset or column. I also want to represent the highest and lowest record temperatures for each day and add interactivity so that when you hover over the lines, the corresponding date and temperature information appear. This assignment was both exciting and challenging, and it truly tested my Interactive Media skills.


FlowFields- Assignment 3

This week’s assignment delved into the world of object-oriented programming and arrays. My inspiration for this project stemmed from my previous encounter with Perlin noise and flow fields. Initially, I found the code for implementing these concepts somewhat complex. However, this week’s lessons on noise, arrays, and classes made things clearer. This video by “The Coding Train”, about Perlin noise really put things into perspective for me, and this is how I stumbled upon my artwork.

The artwork I created is essentially a flow field, which consists of an array of points moving in response to their positions relative to where the mouse was clicked. Firstly, I wanted to create a Perlin noise piece, but I also wanted to have a high level of interactivity in my piece. Searching “moving Perlin noise” led me to achieve this.

I utilized a class called “point” and developed functions to display and update these particles. When the mouse was clicked, the “push” function was invoked to relocate the particle randomly, resulting in an interactive field when the user interacted with the mouse.

The most challenging aspect of this project was the “update” function. It was responsible for moving the particles to random positions on the screen and recalculating noise values based on their positions. The difficulty arose from the new concept of noise scale, which I struggled to grasp accurately. Additionally, handling particles that went out of bounds and ensuring they returned to random positions proved to be a complex task. However, by drawing on the bouncing ball problem we studied in class, I eventually overcame this challenge. Below is the snippet of code I take most pride in:

//update particles position based on the noise
update() {
  //calculate noise value based on position
  let n = noise(
    this.position.x * noiseScale,
    this.position.y * noiseScale,
    frameCount * noiseScale * noiseScale
  );
  
  //Map noise to an angle
  let a = TAU * n;
  
  //Update particles position based on the angle
  this.position.x += cos(a);
  this.position.y += sin(a);

  //if particle is off-screen, reset to random location
  if (!this.onScreen()) {
    this.position.x = random(width);
    this.position.y = random(height);
  }
}

For future improvements, I aspire to introduce a gradient shift in the flow fields, dynamically changing colors as they traverse the canvas. As I reflect on this assignment, I take pride in the progress I made in understanding these intricate concepts. Looking ahead, I am eager to continue refining my work, with plans to enhance the visual impact of the flow field. This assignment has undoubtedly been a steppingstone in my journey to mastering interactive media coding.

The Art of Interactive Design

In the first chapter of the book “The Art of Interactive Design” by Chris Crawford, titled “What Exactly is Interactivity?”, Chris talks about what interactivity means and sets the tone for the rest of the chapter. He starts by admitting that we don’t really know what interactivity is. However, he goes on to explain the basic idea of interaction and how it helps in creating interesting and meaningful interactive experiences using simple metaphors.

One of the metaphors he makes is thinking of interactivity as a conversation. He says that just like in a conversation, where people listen, speak, and think, interactivity also involves these three things. A high level of interactivity means that all three aspects are happening, and none is more important than the others.

One interesting point he makes is the difference between interaction and reaction. Interaction is when something responds to what you do or say, while reaction is when you respond to something. For example, books and movies are not interactive because they don’t respond to you; you just react to what you see or read. On the other hand, interactive media requires you to actively participate and engage with it. This is an important difference for designers because it affects how they create interactive content.

This distinction is important because it helps me think about my own work. It reminds me that for interactivity to be meaningful, it should not only involve users but also encourage them to interact actively. In doing so, my work becomes the conversation that Chris mentioned, my user essentially gets to think about, speak and listen to my work creating not only a greater sense of interactivity, but also an experience.