Idea:
In class, the professor made us an example of a procedurally generated poem which was extremely fascinating. It was almost like an AI until you understood that the professor had already stored the words in an array that the program was accessing to create unique combinations. Initially, I wanted to try something similar but with more variety. However, while researching for this assignment I came across the following video by the Coding Train on Youtube:
Coding Challenge #97: The Book of Pi – Part 1
This piqued my interest greatly and I wanted to implement something similar for my assignment.
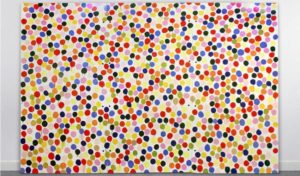
Similarly, I was also fascinated by neo-pointilist artists’ ability to make a matrix of dots into extremely satisfying art:
Process:
The first step was to find a list of digits that I could use to create my piece. My candidate was the Golden Ratio which I have been studying a lot recently, first through Professor Song’s Bioinspiration and afterward while researching bio-aesthetics. I wanted to see if there was a secret hidden pattern in the golden ratio if I visualised it similar to the video.
I used the website https://www.goldenratio.org/ to extract the first 1,000,000 digits of the Golden Ratio and put it into a text file which was uploaded to the terminal to be preloaded.
To visualize the numbers I assigned each of them from 0 to 9 to a color of the spectrum. The colors I used were purposely not the same shades to give the maximum contrast when the image was rendered. the colors were stored in an array from which the program accessed the values depending upon what digit was supposed to be represented, e.g., for 2 it would be the color in the second row, and so on.
Probably the most challenging part of the assignment was figuring out how to make the program read a continuous line of numbers and rendering them row-by-row. However, the solution was quite simple and required only the following snippet of code:
// draw a whole row of digits
for (let columnNumber = 0; columnNumber < columnsTotal; columnNumber++) {
  const Index = columnsTotal * rowNumber + columnNumber;
  const GoldenRatioDigit = int(GoldenRatioString.substring(Index, Index + 1));
  const Color = colors[GoldenRatioDigit];
In this for() loop, there are 3 key actions happening simultaneously:
- Index is being updated with the number of digits that have been already read so that the next digit may be read
- The digit of the golden ratio is being read and recorded
- The digit is being assigned its respective color values
The code ends when the rowNumber reaches the RowsTotal value; the noLoop() function stops the for() loop from repeating.
Embedded Sketch:
Problems:
There were several coding challenges I faced during this assignment but perhaps the biggest obstacle that almost cost me a few hours was the following error message:
Error: [object Arguments]is not a valid color representation.
Initially, I thought my code was not working properly or the .txt file was corrupted. I tried using random numbers instead in the .txt file which worked fine. So then I assumed its perhaps had something to do with the golden ratio. however, after a simple stackoverflow.com search, I discovered there was something in my code that was not a recognized digit. And it turned out to be the decimal point on the second position of the .txt file… Needless to say I was very happy that it took me just a few minutes to figure it out.
Reflections:
The data, although beautifully represented, did not show any semblance to a pattern nor did it do justice to the reputation of the beauty of the Golden Ratio. In the future, while choosing ways to represent my data, I will research more to find out what works best for it. Furthermore, I also discovered the expansive world of Data Visualisation in P5JS and JavaScript overall. It was very exciting for me as a budding coder since I have always wanted to explore data visualization more but was constrained by the lack of knowledge of different visualization-specific languages. By studying P5JS more I can establish a strong base on which to build my skills on.

