
The World’s Best Countries For Women, 2021
My concept: While scrolling through Kaggle, I found an article with an interesting title “The World’s Best Countries For Women”. I wanted to know the ranking of the countries and on which categories they were assessed such as women’s employability, women’s rights, women’s literacy rate, etc. Although the article doesn’t exhaustively describe these aspects, the visualization of this data was particularly interesting for me. I have been inspired by the image attached below in Fig. 1, meaning that the circles representing the countries needed to align on a circular path. Additionally, the circles should demonstrate a visible differentiation of the score of the overall assessment of each country’s performance, which could be achieved by the different radius of circles corresponding to the specific countries: the higher the score, the bigger the radius. During the coding, I decided to give a more interesting shape for the data visualization, so the circles would be in a more spiral path. Last but not least, the array of the shades of the purple colors was created because it is believed that purple is a color of feminism. I wanted to raise awareness of women’s conditions and opportunities in different countries through this data visualization.
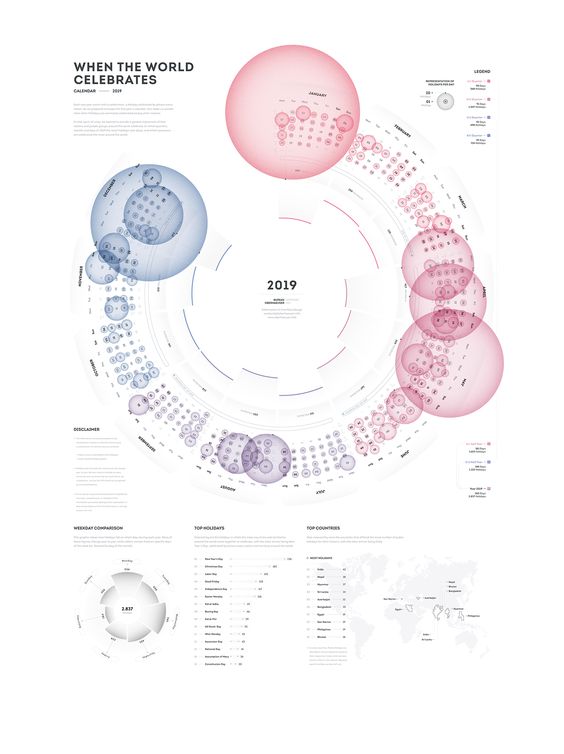
Fig 1. The data visualization I was inspired by.
A highlight of the code I am proud of is the for loop because it incorporates many functions and steps such as naming each variable in the data set, giving the size of circles to corresponding countries based on score, and the path of the spiral path according to the ranking. More specifically, I am proud of the function of the x and y coordinates of each circle because the formula used for that creates a perfectly drawn 2D spiral path I was looking for.
 for(let r=0; r<table.getRowCount();r++) {
    const name = table.getString(r, "Country");
    const rank= table.getNum(r, "Rank");
    const score = table.getNum(r, "Score");
//calculating the positions x, y of the ellipses based on the rank of each country.
    const x = 2*(180-rank)*cos(rank*5)+width/2;
    const y = 2*(180-rank)*sin(rank*5)+height/2;
//scaling the score range of (0,100) to fit the range of (0, 30) to control the size of the ellipses, so they could fit the canva.
    const scoremap = map(score, 0, 100, 0, 30);
    ellipse(x, y, scoremap);
    fill(0);

//calculating the positions of x, y of the names of the countries  based on the rank of each country.
    let xtext=2.5*(180-rank)*cos(rank*5)+width/2-19;
    let ytext=2.5*(180-rank)*sin(rank*5)+height/2;
//changing the x position of the names of the countries to specific countries in order to avoid overlapping of the names with the ellipses.
    if (rank>=97 && rank<=116){
      xtext = 2.5*(180-rank)*cos(rank*5)+width/2-35;
    }
    if (rank>=136) {
      xtext = 2.5*(180-rank)*cos(rank*5)+width/2+5;
    }
//checking the distance between the mouse and the ellipse.
    let d = dist(mouseX, mouseY, x, y);
//if the mouse is on the ellipse, the name of the country and the ellipse corresponding to that country is filled is orange color.
  if (d < scoremap/2) {
    fill(255, 95, 31);
    text(name, xtext, ytext);
    ellipse(x, y, scoremap);
  } else {
    fill(0);
    text(name, xtext, ytext);
    fill(random(colors));
    ellipse(x, y, scoremap);
    }
  }
Embedded sketch
MOVE YOUR MOUSE OVER ANY CIRCLE TO SEE WHICH COUNTRY IS REPRESENTED
Reflection and ideas for future work or improvements: Because of the small distance between the countries, some of the names overlap. Hence, it is better to resize the canvas or make the changes in a space for each of the country names so that one is closer to the circle, while the other is a bit in a distance. Additionally, for aesthetic purposes, it would be great to add more details to the sketch such as Perlin noise which appears when the mouse is clicked, or the line of the small circles going from the country circles to the center.