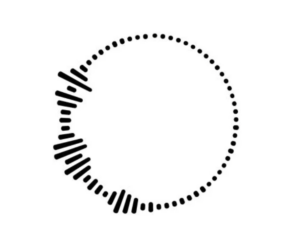
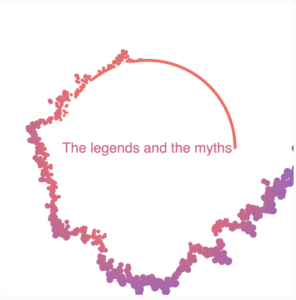
For this week’s assignment, I decided to create an audio visualizer using p5.js, exploring both data visualization and generative text. I chose one of my all-time favorite songs for this assignment because it’s filled with diverse sound effects and beats, making it perfect for visualization. This visualizer represents the audio’s amplitude as dynamic circles. Louder beats create larger and more distant circles, and the lyrics sync with the audio, causing more circles when the lyrics begin. I learnt a lot of new functions and concepts in the process of making the following.
Concept
It uses Fast Fourier Transform (FFT) analysis to break down the audio signal into its frequency components. These components are then represented as circles on the canvas. The amplitude of each frequency band determines the size and color of the corresponding circle. The analyze() returns a spectrum array of amplitude values at each. point.
Sketch
Click anywhere to begin!
(The interlude that comes after the chorus is particularly interesting to observe, as the amplitude and beats vary significantly.)
Favorite parts of code
While the way this visualizer turned out makes me happy, my favorite part of this, (and my main struggle) was working with the text. I used a csv file I found online with timestamps for each line in the lyrics and then tried to display the lyrics accordingly by first converting the string to time, calculating the next Timestamp and adding color gradients to make it visually match.
function displayLyric() {
  // check if there are lyrics data and if the current lyrics index is within the length of file
  if (lyricsData.length > 0 && currentLyricIndex < lyricsData.length) {
    // check if the song is playing and the current audio time exceeds the nextLyricTime
    if (song.isPlaying() && song.currentTime() >= nextLyricTime) {
      // display the lyric text for the current index with animation
      let lyricText = lyricsData[currentLyricIndex].split("]")[1];

      // calculating the lerp amount based on lyricTextOpacity for text animation
      let lerpAmount = lyricTextOpacity/255;

      let lerpedColor = lerpColor(color(255, 100, 100), color(100, 100, 255), lerpAmount);


      fill(lerpedColor);
      text(lyricText, width / 2, height / 2);
      lyricTextOpacity = 255;

      // move to the next lyric
      currentLyricIndex++;

      // updating nextLyricTime with the timestamp of the next lyric
      if (currentLyricIndex < lyricsData.length) {
        let nextTimestamp = lyricsData[currentLyricIndex].split("]")[0].substring(1);
        nextLyricTime = convertTimestampToSeconds(nextTimestamp);
      }
    } else {
      // if the song is not at the next lyric yet, continue displaying the text
      if (lyricTextOpacity > 0) {
        let lyricText = lyricsData[currentLyricIndex - 1].split("]")[1];

        // decrease text opacity
        lyricTextOpacity -= 2;

        let lerpAmount = lyricTextOpacity / 255;
        let lerpedColor = lerpColor(color(255, 100, 100), color(100, 100, 255), lerpAmount);
        fill(lerpedColor);
        text(lyricText, width / 2, height / 2);
      }
    }
  }
}
It looked different earlier when I had the angle mode set to degrees but when I accidentally commented it out and tried to run it, it looked prettier and more effective. This is how it looked with the angled mode set to degrees.
 Reflections and future Improvements
I learnt many new functions and found this assignment quite fun as I listened to the same song a million times. For future improvements, maybe I can make this interactive by adding multiple audios and having a click option where the users can choose the audio they want to be visualized. I can also try adding more animation to the text like creating a falling or a popout effect.
References
Tutorials: https://www.youtube.com/watch?v=uk96O7N1Yo0, https://www.youtube.com/watch?v=2O3nm0Nvbi4
Lyrics timestamps: https://www.megalobiz.com/lrc/maker/Something+just+like+this.54445587
