
Concept: 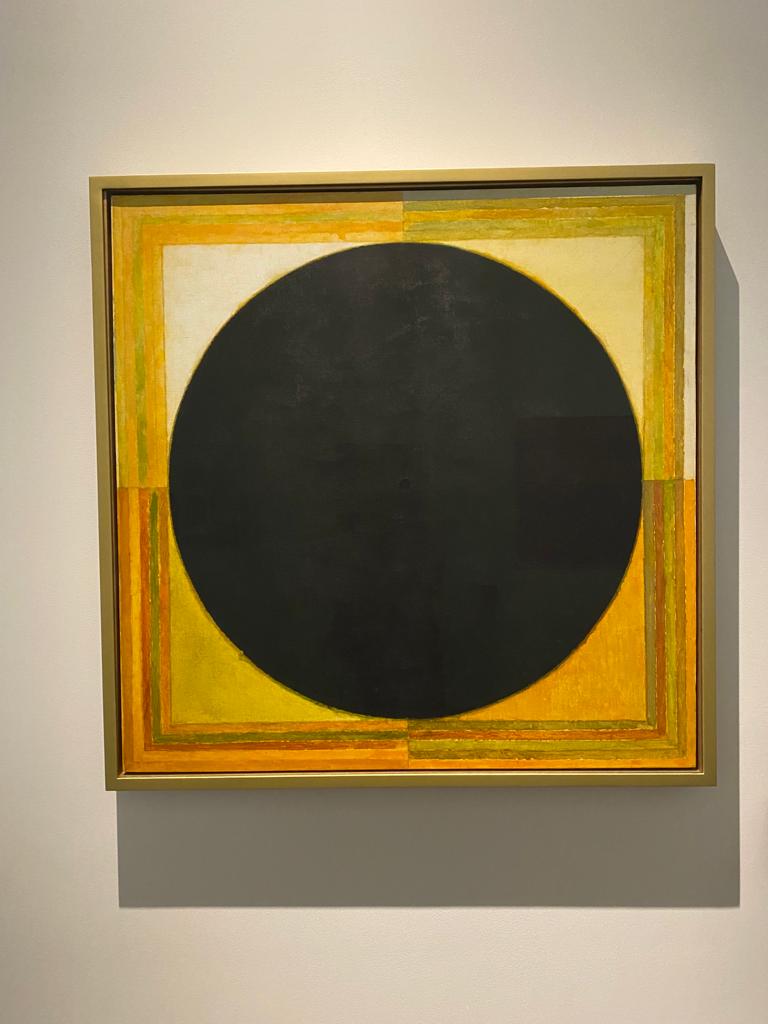 In this assignment, I wanted to do minimalist artwork inspired by my visit to Louver Abu Dhabi. I looked into many ideas before I settled into my final one. I researched L-systems in the p5js examples where one can create automated drawings based on the growth of biological structures, but I did not know what data I could use to implement it. Eventually, I decided to look into the Water Security Dashboard because it is an important issue nowadays. I got some data from the World Bank that was published in 2021. My goal was to transform this data into a simplistic art piece, leading me to the realm of minimalist art.
This type of art says “the most with the least “ (Bob Newhart).
Highlight:
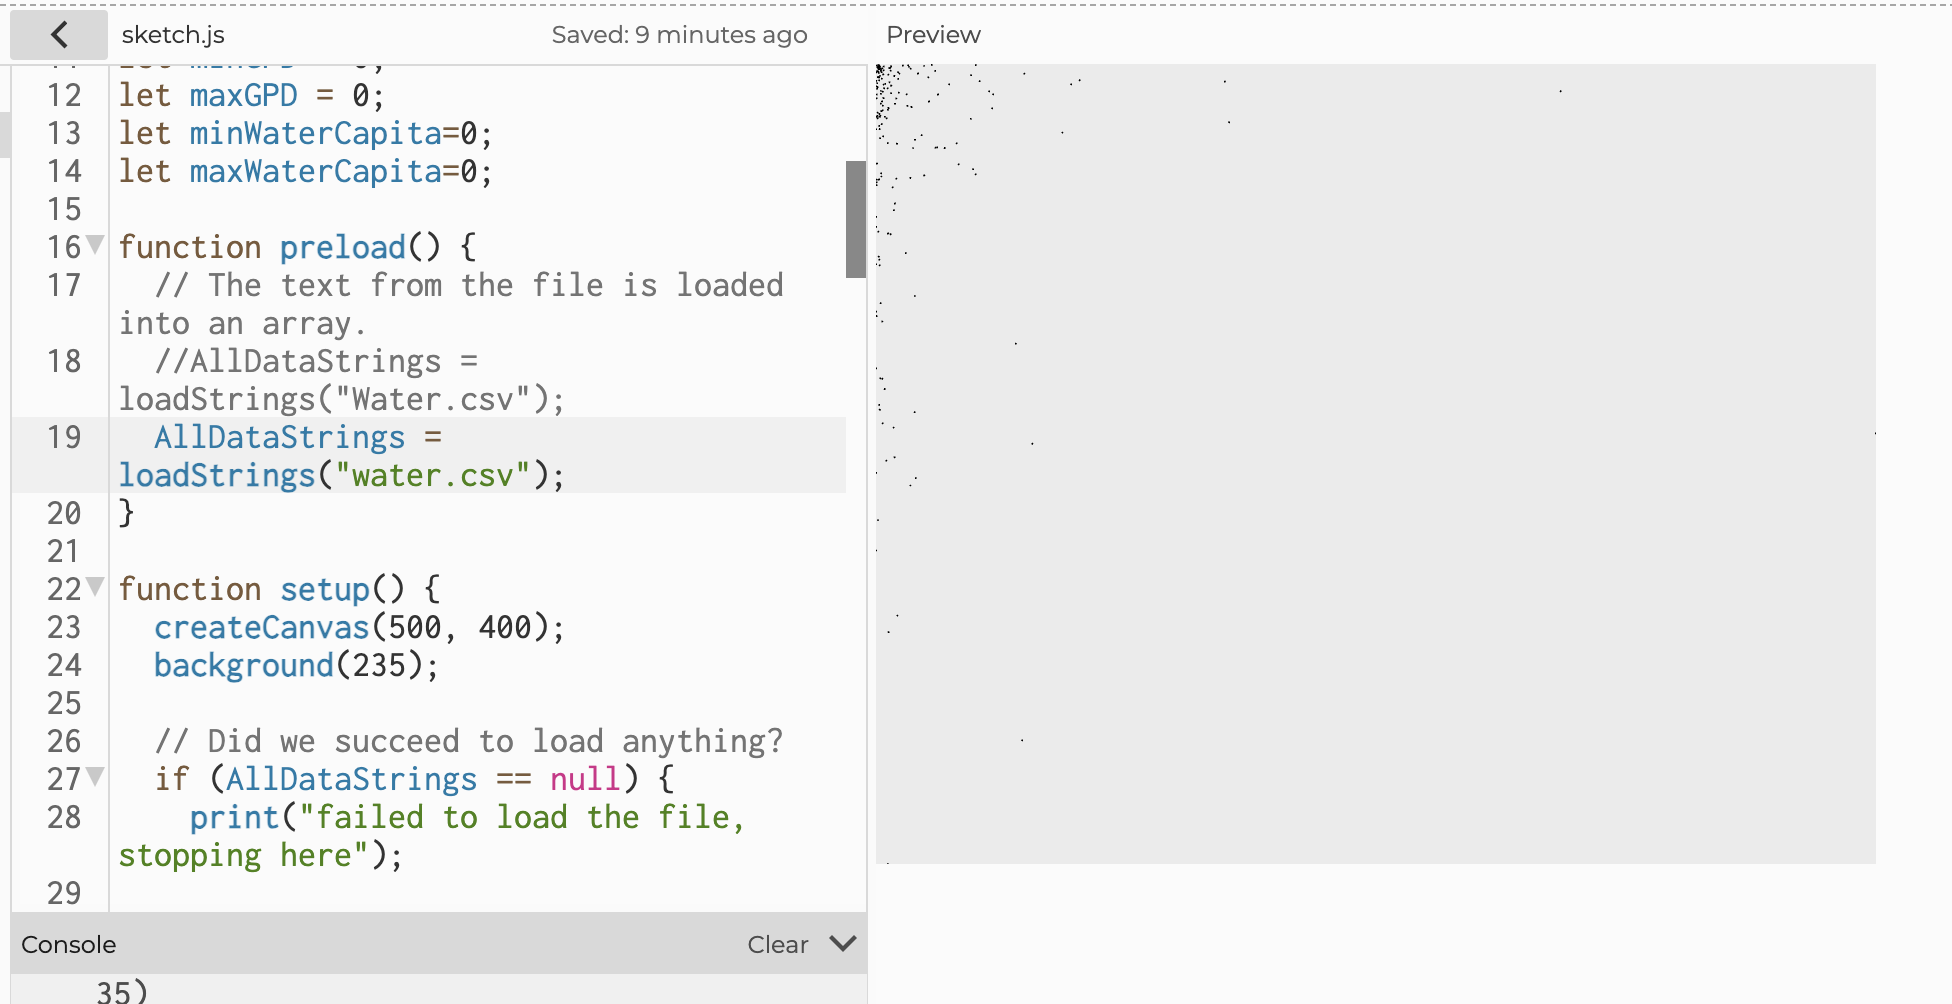
My journey began with the task of making the code functional, which needed a lot of time, focus, and dedication. I got a lot of errors at first and I had to deal with each one separately. First, the code was not reading the file properly because some names within the files had commas within them. I decided to remove the commas that were not necessary in the file. It is not the best solution though especially if the csv file is big. After that, I had to figure out how to get the minimum and maximum values of GPD and Water per Capita which took some time. Finally, I had to think of the aesthetics of it all. First, I added the results into a circle and mapped them into random positions within the circle constraints but that was not a good representation of the data because of the randomness. Consequently, I switched to a square format, mapping the data relative to the square’s dimensions while incorporating a central circle.
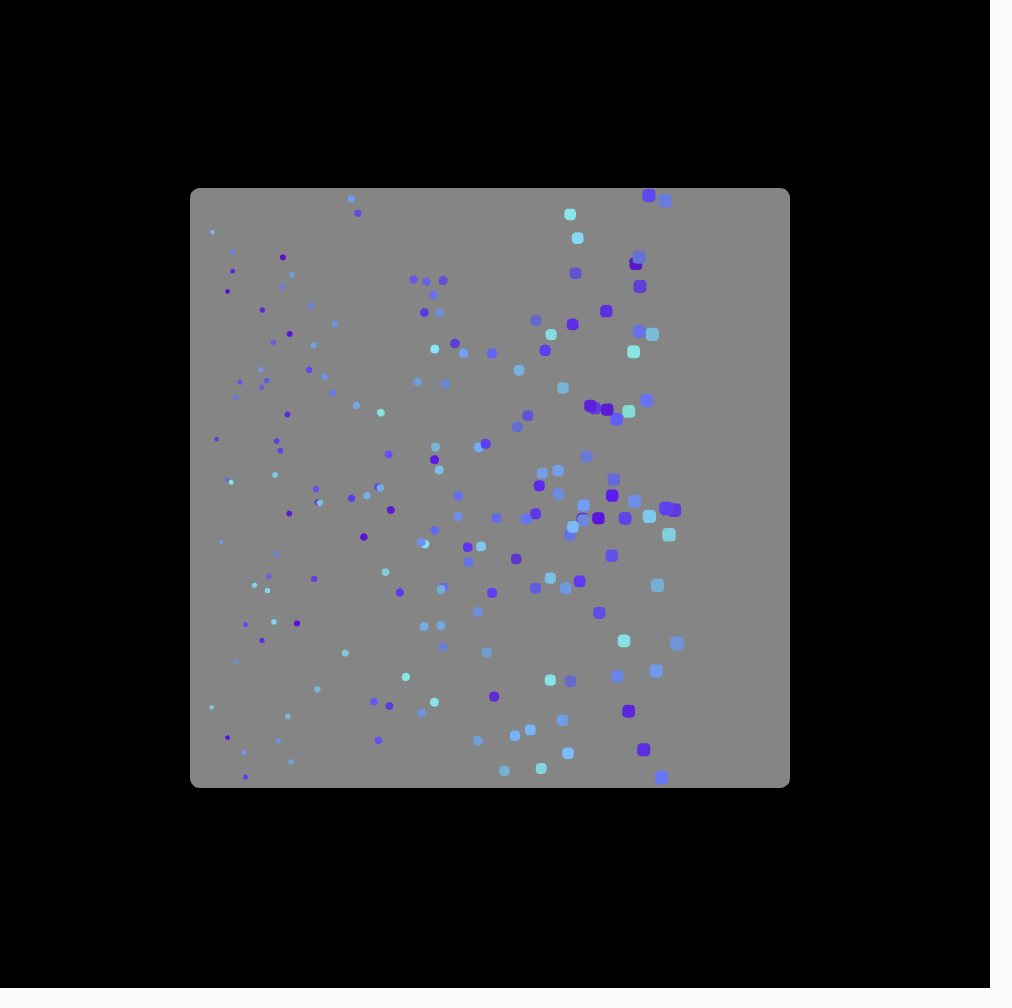
Throughout the experimentation process, I generated interesting results and different shapes and forms. Finally, I settled on the result below. Although I explored creative coding, gradients, and glitch shaders through video tutorials, these elements, while captivating, did not align with the minimalist vision I had in mind.
Reflection and Future Improvements:
For future improvements, I would want to think of other ways to use data in art without losing the representation of the data. I want to start working with 3D and maybe do something with the L-systems and Glitch Shader. I also want to start thinking of the interactivity of what I do and in which ways I want users to interact and feel when incorporating these interactive concepts.
Resources:
https://www.youtube.com/watch?v=r5YkU5Xu4_E
https://www.youtube.com/watch?v=rTqvf0BkTNE&list=PLyRZnpOSgMj3K8AV2I6UldnvTj6d_Zrf0