
Concept:
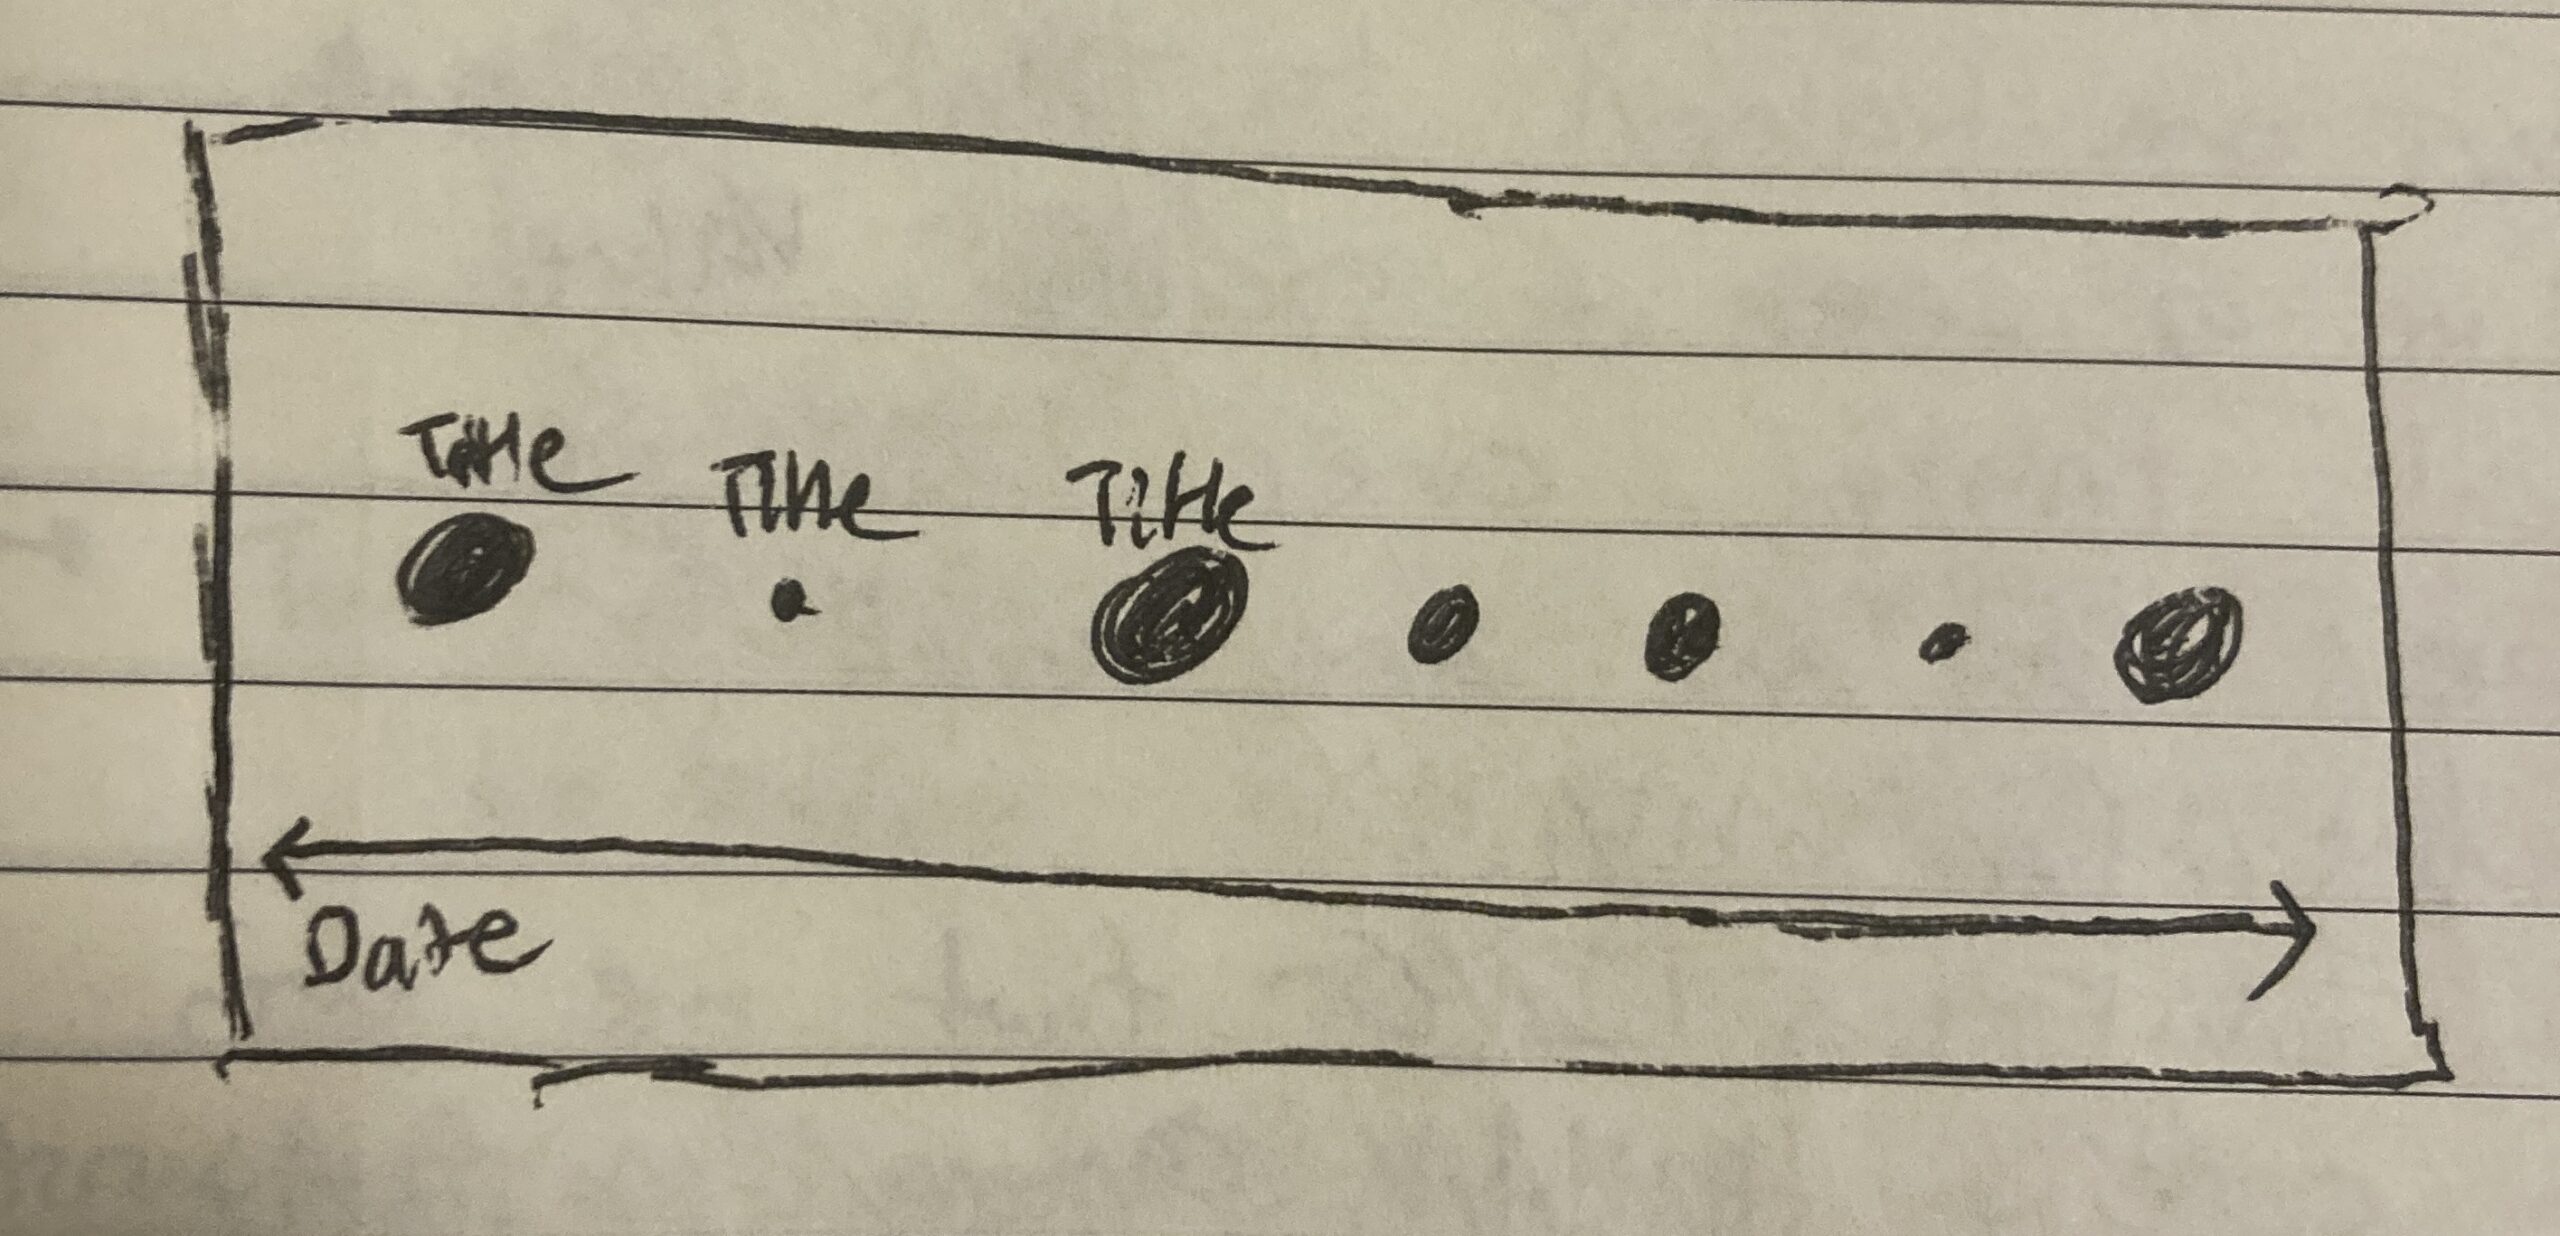
I wanted to use data that I generated myself for this data visualization, as I find it fascinating that, as time progresses, we are tracking more and more aspects of our lives — for example, # of steps walked, places visited, songs listened to, etc. One thing that I track is my reading data, on the app StoryGraph. I wanted to visualize my StoryGraph data on a timeline, where the size of the point corresponded to my rating.
Highlight:
I am proud of the sorting portion of my code, because data visualization has been the hardest unit for me to understand so far, and it required some time and an office hours visit for me to grasp the logic of sorting. In the end, I split the whole array twice, once on “,” to separate each row into its elements, and again on “/” to separate the dates into individual numbers. Then, I sorted according to the month.
function findMinMaxMonth() {
  //go through each row of bookData to sort by month
  let singleRow = [];

  for (let csvRowNumber = 1; csvRowNumber < bookData.length; csvRowNumber++) {
    singleRow = split(bookData[csvRowNumber], ",");

    //split date 2023/03/21 into 2023, 03, 21 on "/"
    let dateSplitted = split(singleRow[5], "/");
    // print(dateSplitted)

    dateReadMonth = int(dateSplitted[1]);
    // print(dateReadMonth)

    if (dateReadMonth < minMonth) {
      minMonth = dateReadMonth;
    }
    if (dateReadMonth > maxMonth) {
      maxMonth = dateReadMonth;
    }
  }
Reflection and ideas for future work or improvements:
I initially had many more data points in my CSV spanning multiple years, but due to time constraints and my skill level, I had to simplify the CSV to include only one book per month, read within one year (2023). If I could, I’d like to include the whole dataset, which would require first sorting by year, then by month, then by day. This would provide a much more interesting visualization. It would also be cool to vary the color of the book depending on the genre or the number of times I read it (darker shades = more times read).
Resources: