
Concept
For this assignment, my inspiration came from Khaleeqa Garrett’s captivating work on her third assignment, specifically FlowFields. I invested time in studying her code to comprehend her approach and remix it to create something unique. Upon reviewing the prompt, I was initially uncertain about which data to visualize and how to do it. Eventually, I settled on using statistics from the music industry, focusing on three of my favorite rappers: Kendrick Lamar, J. Cole, and Drake. I gathered data from Google Trends and utilized it as parameters for Khaleeqa Garrett’s code.
During my initial attempt, the output looked nothing like my envisioned result. I only observed small dots clustered in the upper left corner of the canvas. It dawned on me that the range of values for the number of searches was limited, prompting me to employ the map() function to expand the range and cover the entire canvas.
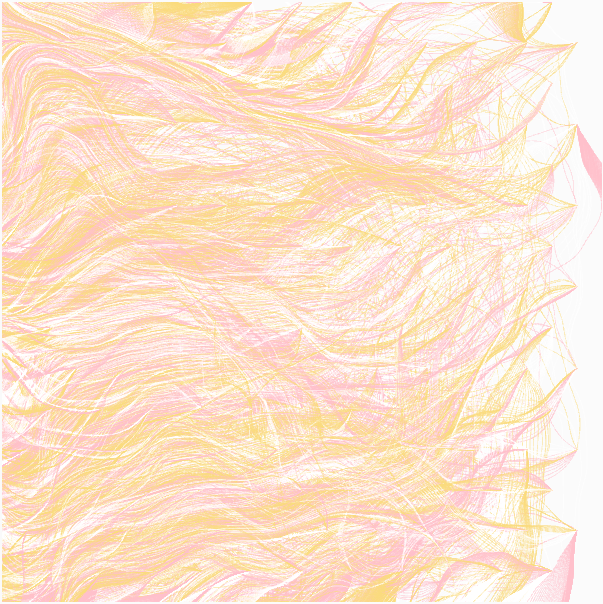
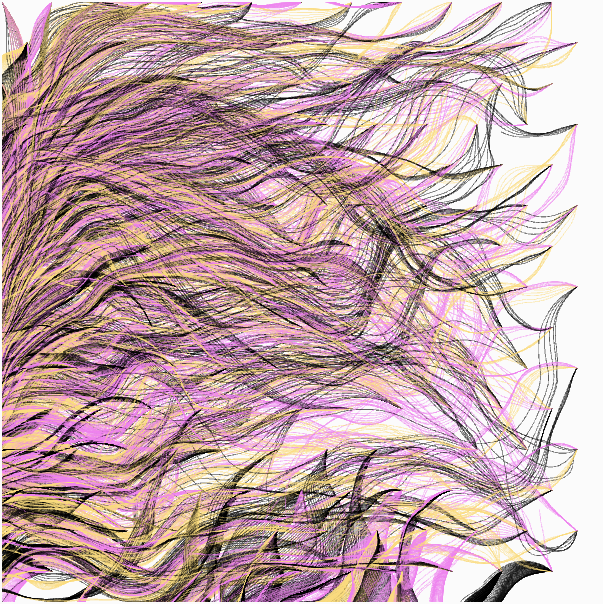
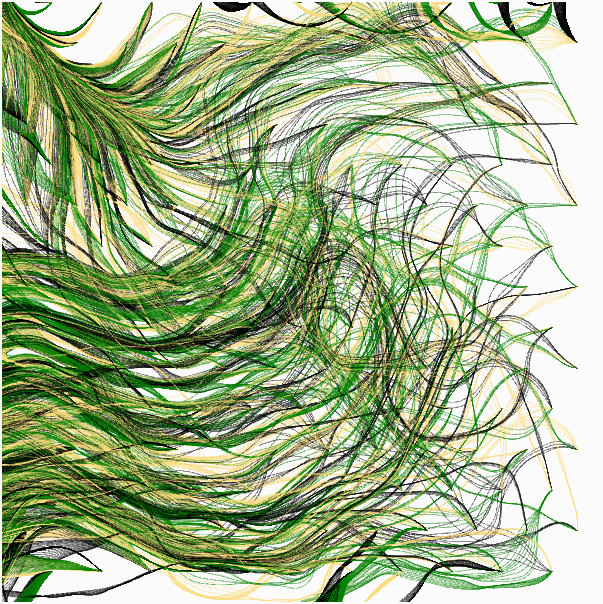
Below, you can see some of the pieces I created by adjusting the colors representing the different artists.
Highlight of Code
The central modification I made to the existing code involved parsing data from the CSV file and linking it to the Point class. I utilized the hour component of the time for the x-coordinate of the particles and the minute component for the y-coordinate. The numerical value at the time was employed to manipulate the noiseScale within the Point class.
// goes over all entries and uses hours as x coordinate, minutes as y coordinate,
  // and the number of searches as an argument for the noiseScale
  for (let i = 0; i < artistes.getRowCount(); i++) {

    // time is split into hour (mapped from 0 - 24 to 0 - width) and minute
    // (mapped from 0 - 59 to 0 - height)
    particles[0].push(new Point(map(split(time[i], ':')[0], 0, 24, 0 ,width),
                      map(split(time[i], ':')[1], 0, 59, 0, height), kendrick_lamar[i]));
    particles[1].push(new Point(map(split(time[i], ':')[0], 0, 24, 0 ,width),
                      map(split(time[i], ':')[1], 0, 59, 0, height), j_cole[i]));
    particles[2].push(new Point(map(split(time[i], ':')[0], 0, 24, 0 ,width),
                      map(split(time[i], ':')[1], 0, 59, 0, height), drake[i]));

  }
Additionally, I introduced a slider that influences how the particles move by adjusting the noiseScale within the Point class. This adds an extra layer of interactivity beyond mouse clicks.
// updating noiseScale based on value of slider
    this.noiseScale = slider.value()/map(sin(this.noiseScaleArg), -1, 1, 1, 2);
Reflection and Ideas for Future Work
I consider this piece one of my best creations in this course thus far. For future projects, I aim to enhance the interpretability of my work. Despite using data for this piece, I find it challenging to establish a direct relationship between the numbers and the data inputted into the program.