
The Concept
This piece is to provide a data visualization of all the countries that have won the FIFA world cup since the start of the tournament in 1930. I used a pre existing map of the world in p5js, and added the data about the world cups from kaggle. By combining the two, I was able to have all the data I needed to create the visual representation.
The Sketch
Link for the full screen sketch: https://editor.p5js.org/mhh410/full/3e1QPs51S
<
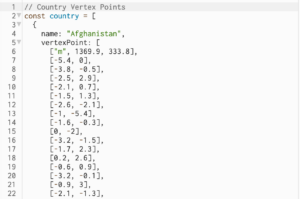
The design of the sketch itself is something I spent a lot of time on. I tried various combinations of world map lay outs, color combinations and even explored the Mappa library. At the end, the most practical thing to use was a preexisting p5js sketch [link: https://editor.p5js.org/Kumu-Paul/sketches/8awPJGZQ4] as the structure of my data visualization. The preexisting sketch gave me access to a complex array of vertices that layout the border of every single country in the world.
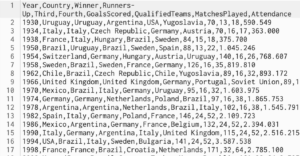
Now with the dataset for all the countries locations as vertices, I needed a dataset of all the Fifa World Cups that have taken place. I found a great resource of Kaggle, but it only went up to 2014, so I had to manually add the relevant data to make it up to date.
Then to combine everything, I first started by making the whole map black. I wanted to highlight the countries that won the world cup as gold, and the countries that were runner ups as silver, so adding any different color in the background didn’t seem to make sense aesthetically. I added a slider functionality to build on the interactivity of the sketch. The slider represents the date starting from 1930, when the first world cup was hosted, and the user can slide it all the way till 2022. As the world cup happens every 4 years, the slider has a step of 4.
![]()
The next step was to extract data from the World Cup csv about the date, the winner and the runner up. To do this, I iterated over the csv table and saved the winners and the runner ups in separate arrays. There was one issue here, which was what happens if a country already won the cup and then were runner ups in later years. If a country had won the world cup, but then became runner ups later on, I wanted them to stay with the gold color. To do this I had to make sure I create the winners array first and then cross check the winners array before pushing to the runner ups array.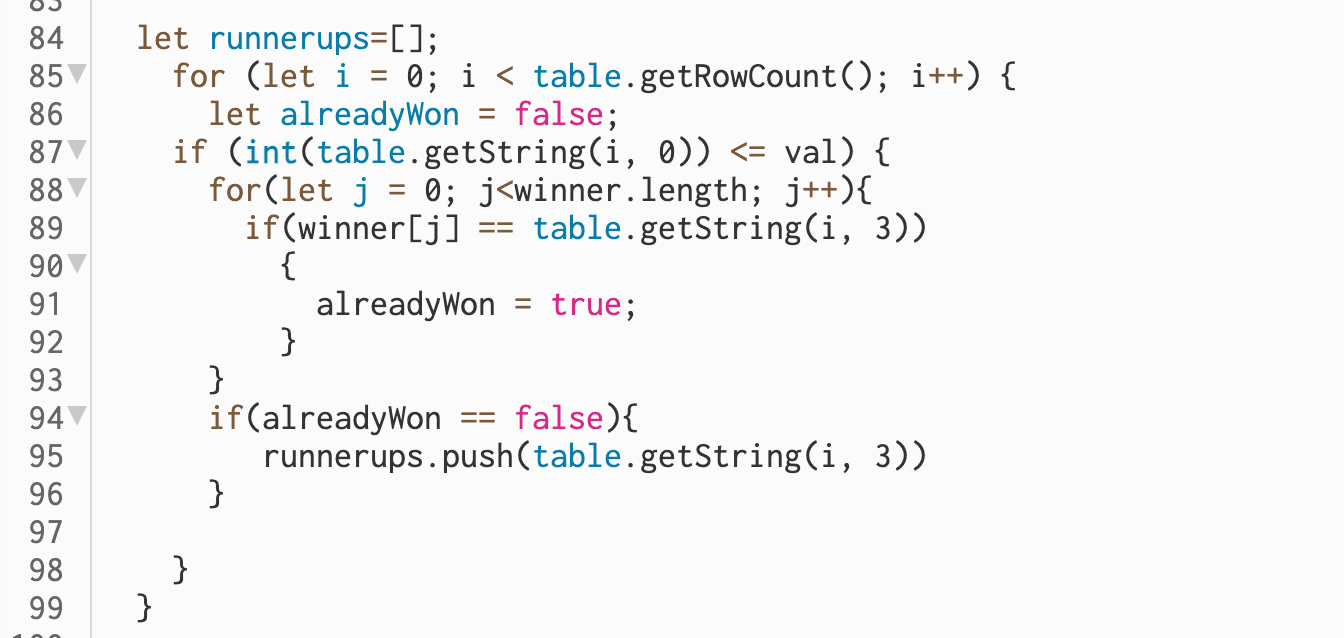
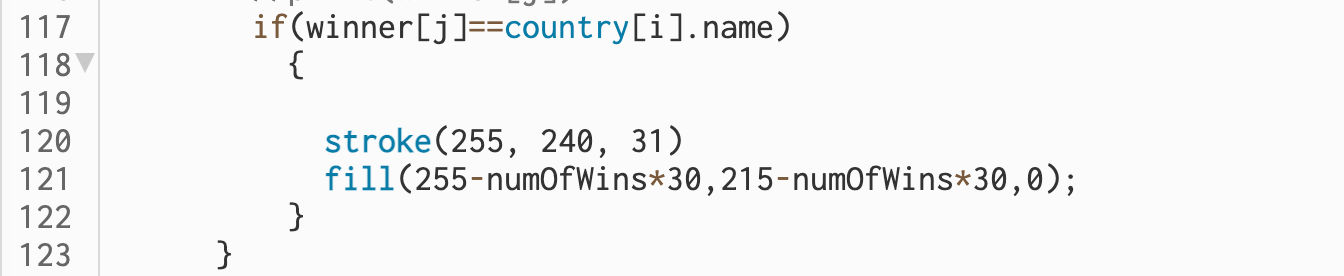
Finally, the last functionality I wanted to add is that if a country won the world cup several times, I wanted there to be some distinction when compared to the rest. Todo so, I added a variable which counted the number of wins, and then decreased the rgb value of the shade of gold by a factor of the number of wins. This allowed me to create a representation for the number of wins of each country, as the countries that had won more cups now were represented by a darker shade of gold
Improvements
I would have liked to change the color of the slider, but unfortunately I can’t do that on p5js