
This time, I had to think what kind of data I wanted to visualize. For some reason, I did not want to use the real-world data. Maybe I wanted to represent something more general. After thinking awhile, I decided to use a list of prime numbers. I got the numbers from here.
This time, I will show the results first.
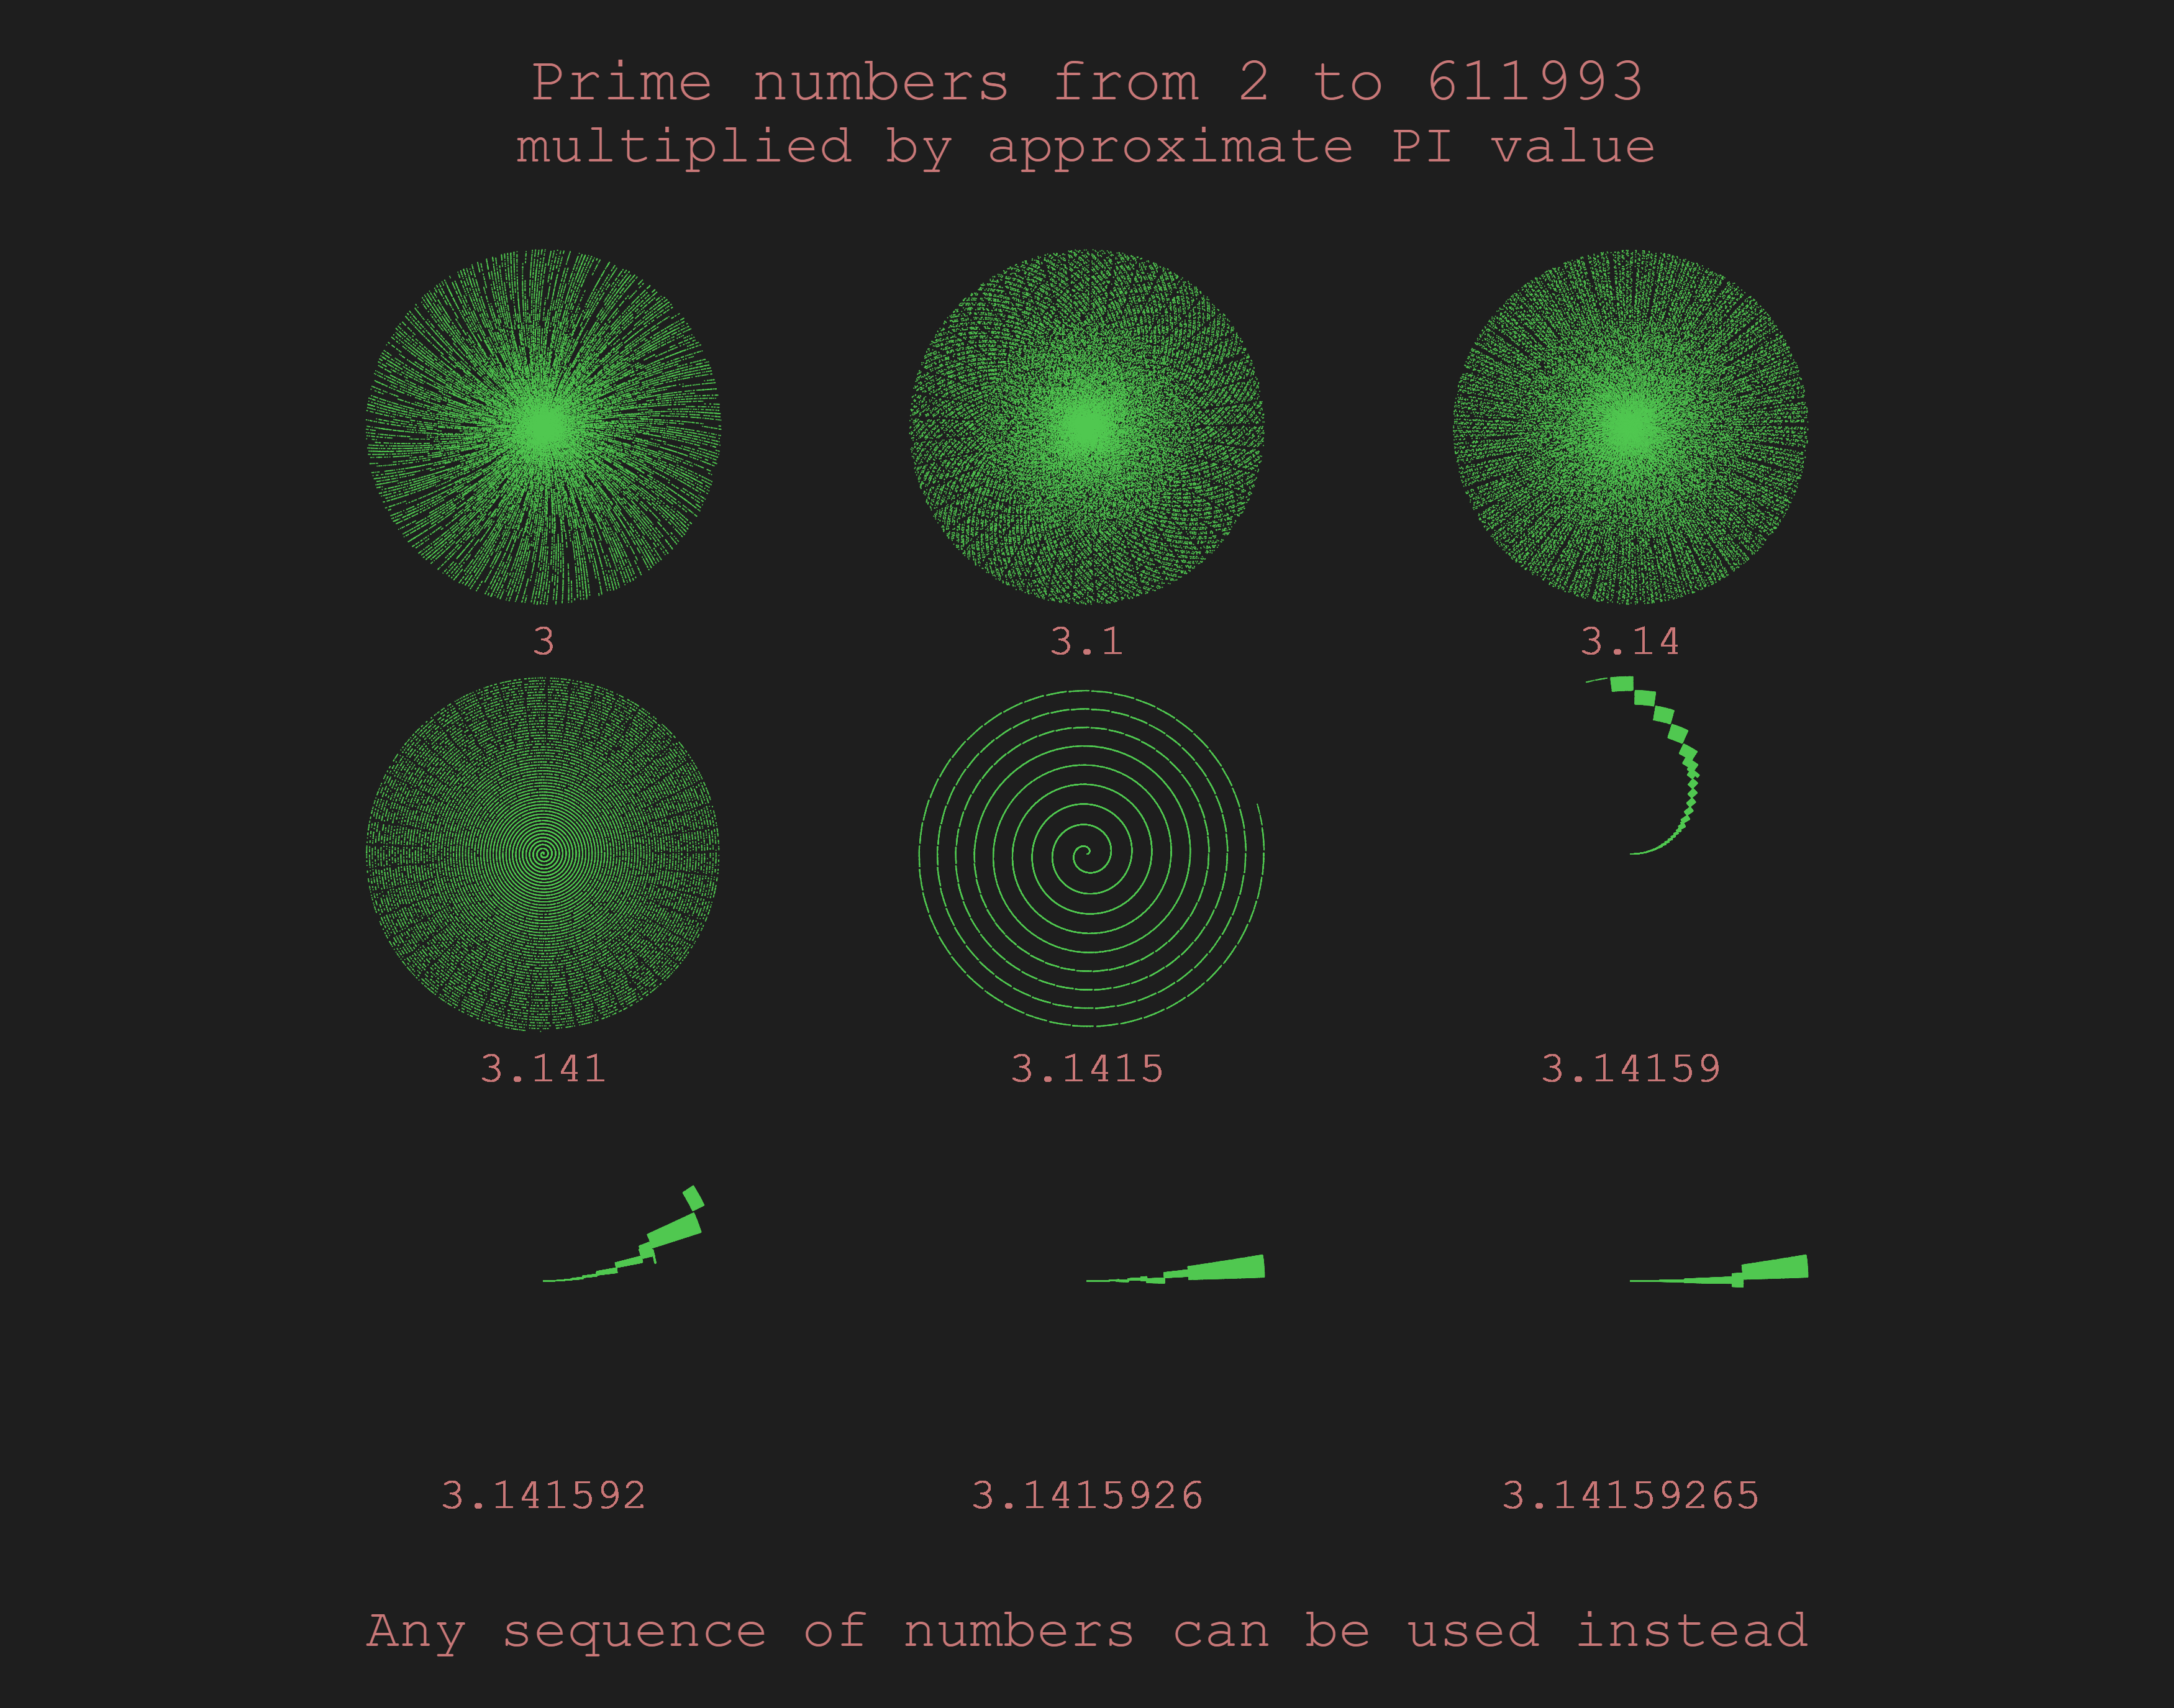 Click to view the full image – you can zoom in to see the details
Which is generated from the below:
It does not mean much as data, but it shows an interesting pattern. Roughly speaking, what I am doing here is that I am printing out 9 different results based on different approximations of PI, each starting from the center and incrementing the distance from the center for each point. The position of each points is determined by the distance from the center and an angle, which is determined by the value of prime numbers multiplied by an approximate PI value. Those are shown in the code below.
function plot(num,row,col) {
  push();
  translate(col*width/4,row*height/4);
  for (let i=(frameCount-1)*500;i<frameCount*500&&i<numbers.length/2;i++) {
    push();
    rotate(Number(numbers[i])*num);
    point((-i/350),0)
    pop();
  }
  noStroke();
  text(num,0,numbers.length/700+40);
  stroke(80,200,80);
  pop();
}
The for condition here is slightly modified so it is 500 times faster than associating the drawing 1:1 with frameCount. It still plots all the points I want.
Also, the visualization does not have to involve prime numbers. It could have been the incrementing number i, although it may have a bit different outcome.
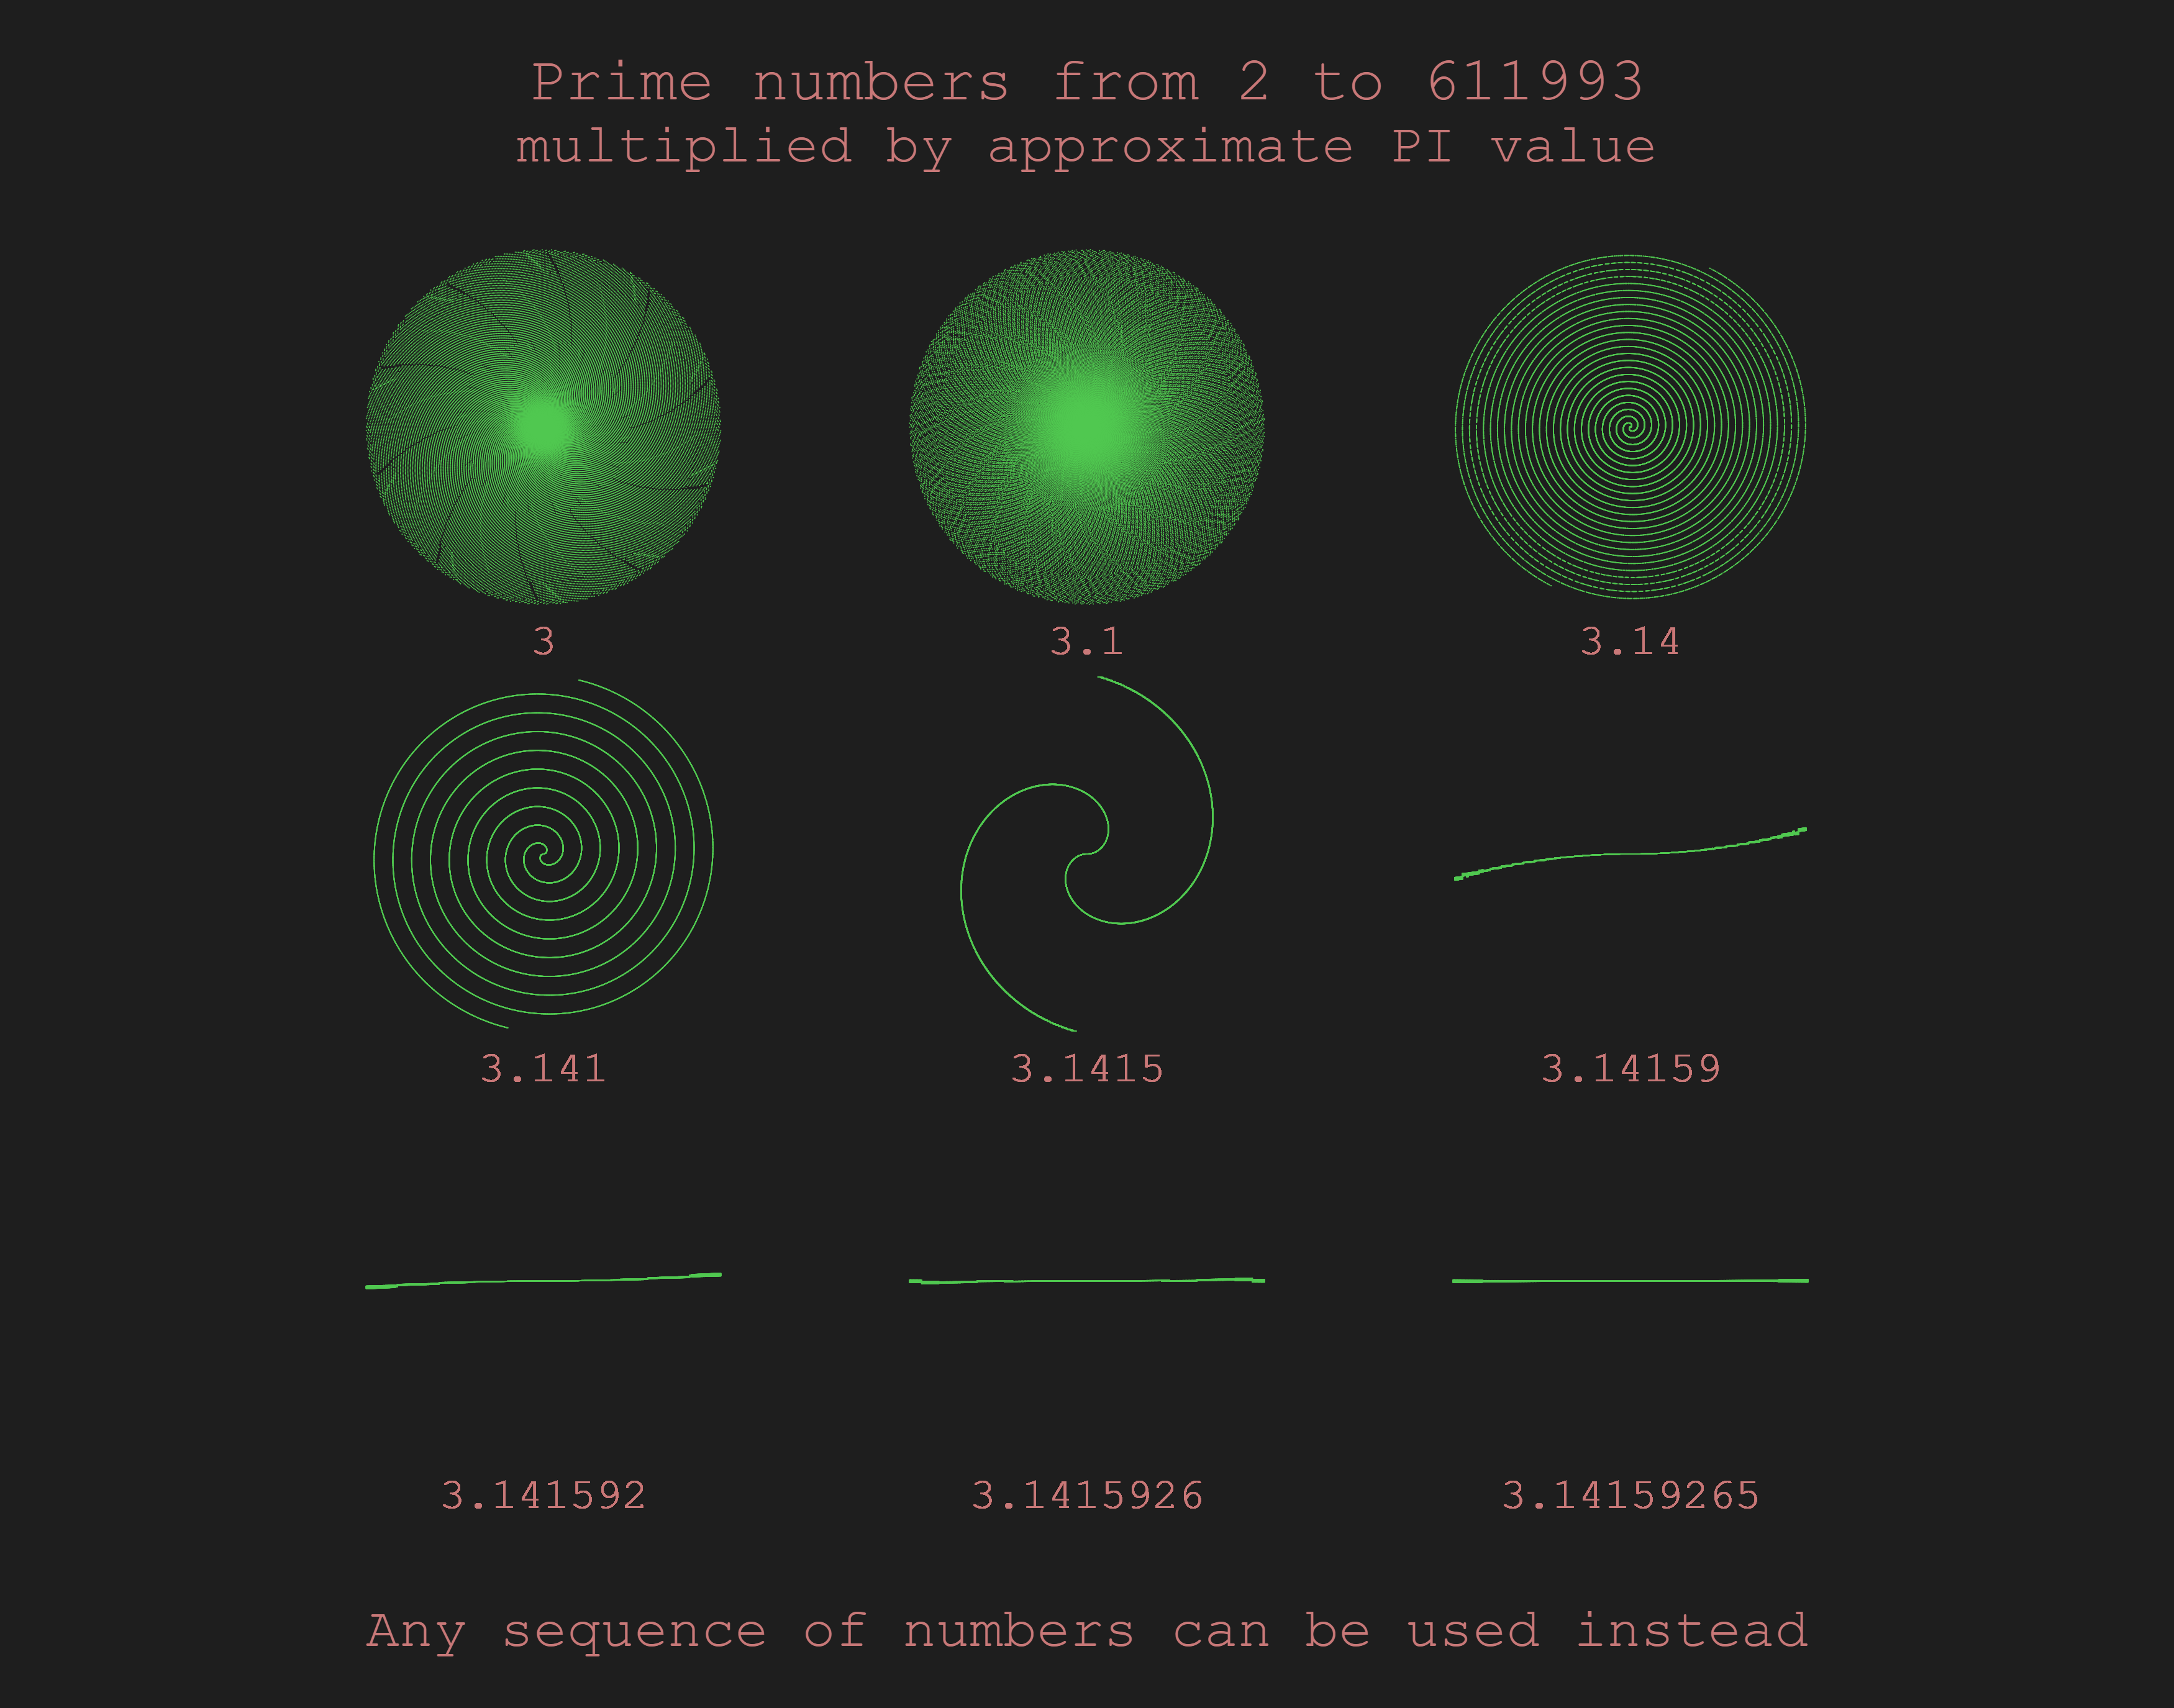 Click to view the full image – you can zoom in to see the details
The label here is wrong, but the results are still interesting. It appears as if a tangled ball of string is unfolding as we approximate more precisely.
For the next project, if feasible, I will try to reuse the modified for condition because it has a big advantage of processing every step while speeding up. There is no need for frame rate modification.