
I was very drawn to the ramen ratings dataset on Kaggle and initially thought of a lot of ambitious ideas for it, like making an interactive map of ramen distribution, a ratings chart linked to the actual images (pulled from Google Search?) of the ramen, and grouping ramen by brand or flavor.
However, upon closer analysis of the dataset, I realized that I didn’t have enough clean information to do those things, and therefore narrowed my focus to one question: what name words are most commonly used and loved in instant ramen? I assumed that these would be fancy Japanese words like “tonkotsu”, but was curious to see what the dataset would reveal.
With this in mind, I went through the CSV of the ramen ratings to split the names into their individual words. I then turned each of these into objects (checking first if they were repeated) so that I could store their name, rating, and other attributes like x and y position.
I ranked words more highly if they were used in more highly-rated ramen, but more generally gave them points as long as they were used in a name. I also only displayed words above a certain threshold of ratings; otherwise, the entire screen would be consumed by words.
I’m most proud of how I was able to split the words and sort them out so that there were no duplicates and ranks cumulatively added into ratings with each time a word was passed into the loop.
//if the word not yet in list, add it
for (let i=0; i<ramen.length; i++) { //for each word in name

  let inList = false;
  //check if it's in the list
  for (let k=0; k<ramenWords.length; k++) { //for each entry in list
    if (ramenWords[k].name==ramen[i]) {
      inList = true;
    }
  }

  //if it's not in the list, add it; if it is, update the rating
  if (inList == false) {
    let x = new ramenWord(); //new word
    x.name = ramen[i];
    x.rating = ramenRank;
    ramenWords.push(x)
  } else {
      for (let k=0; k<ramenWords.length; k++){
        if (ramen[i] == ramenWords[k].name) {
          ramenWords[k].rating += ramenRank; //add rank to rating
        }
      }
  }
}
I had the most trouble with presentation. I found a cool ramen-related font and knew I wanted to use it, which was the easy part. Then, I really wanted to present the words in a word cloud so that I could essentially show the data swimming in a soup bowl. However, I had a lot of trouble with presenting the data in that way, mostly because my data (a list of objects) prevented me from using many common solutions I found in p5.js examples and stack overflow (which often “deleted” overlapping values; I couldn’t do this because my values are unique rather than identical.) After a few hours of trying, I eventually decided to shelve the idea.
Instead, I ran with the more wild-city-signage look of the overlapping words, gave them background fills, and put a ramen picture in the back. While it wasn’t the vision I initially imagined, it has its own charm as a dataviz project that generates a new layout and color scheme each time it runs.
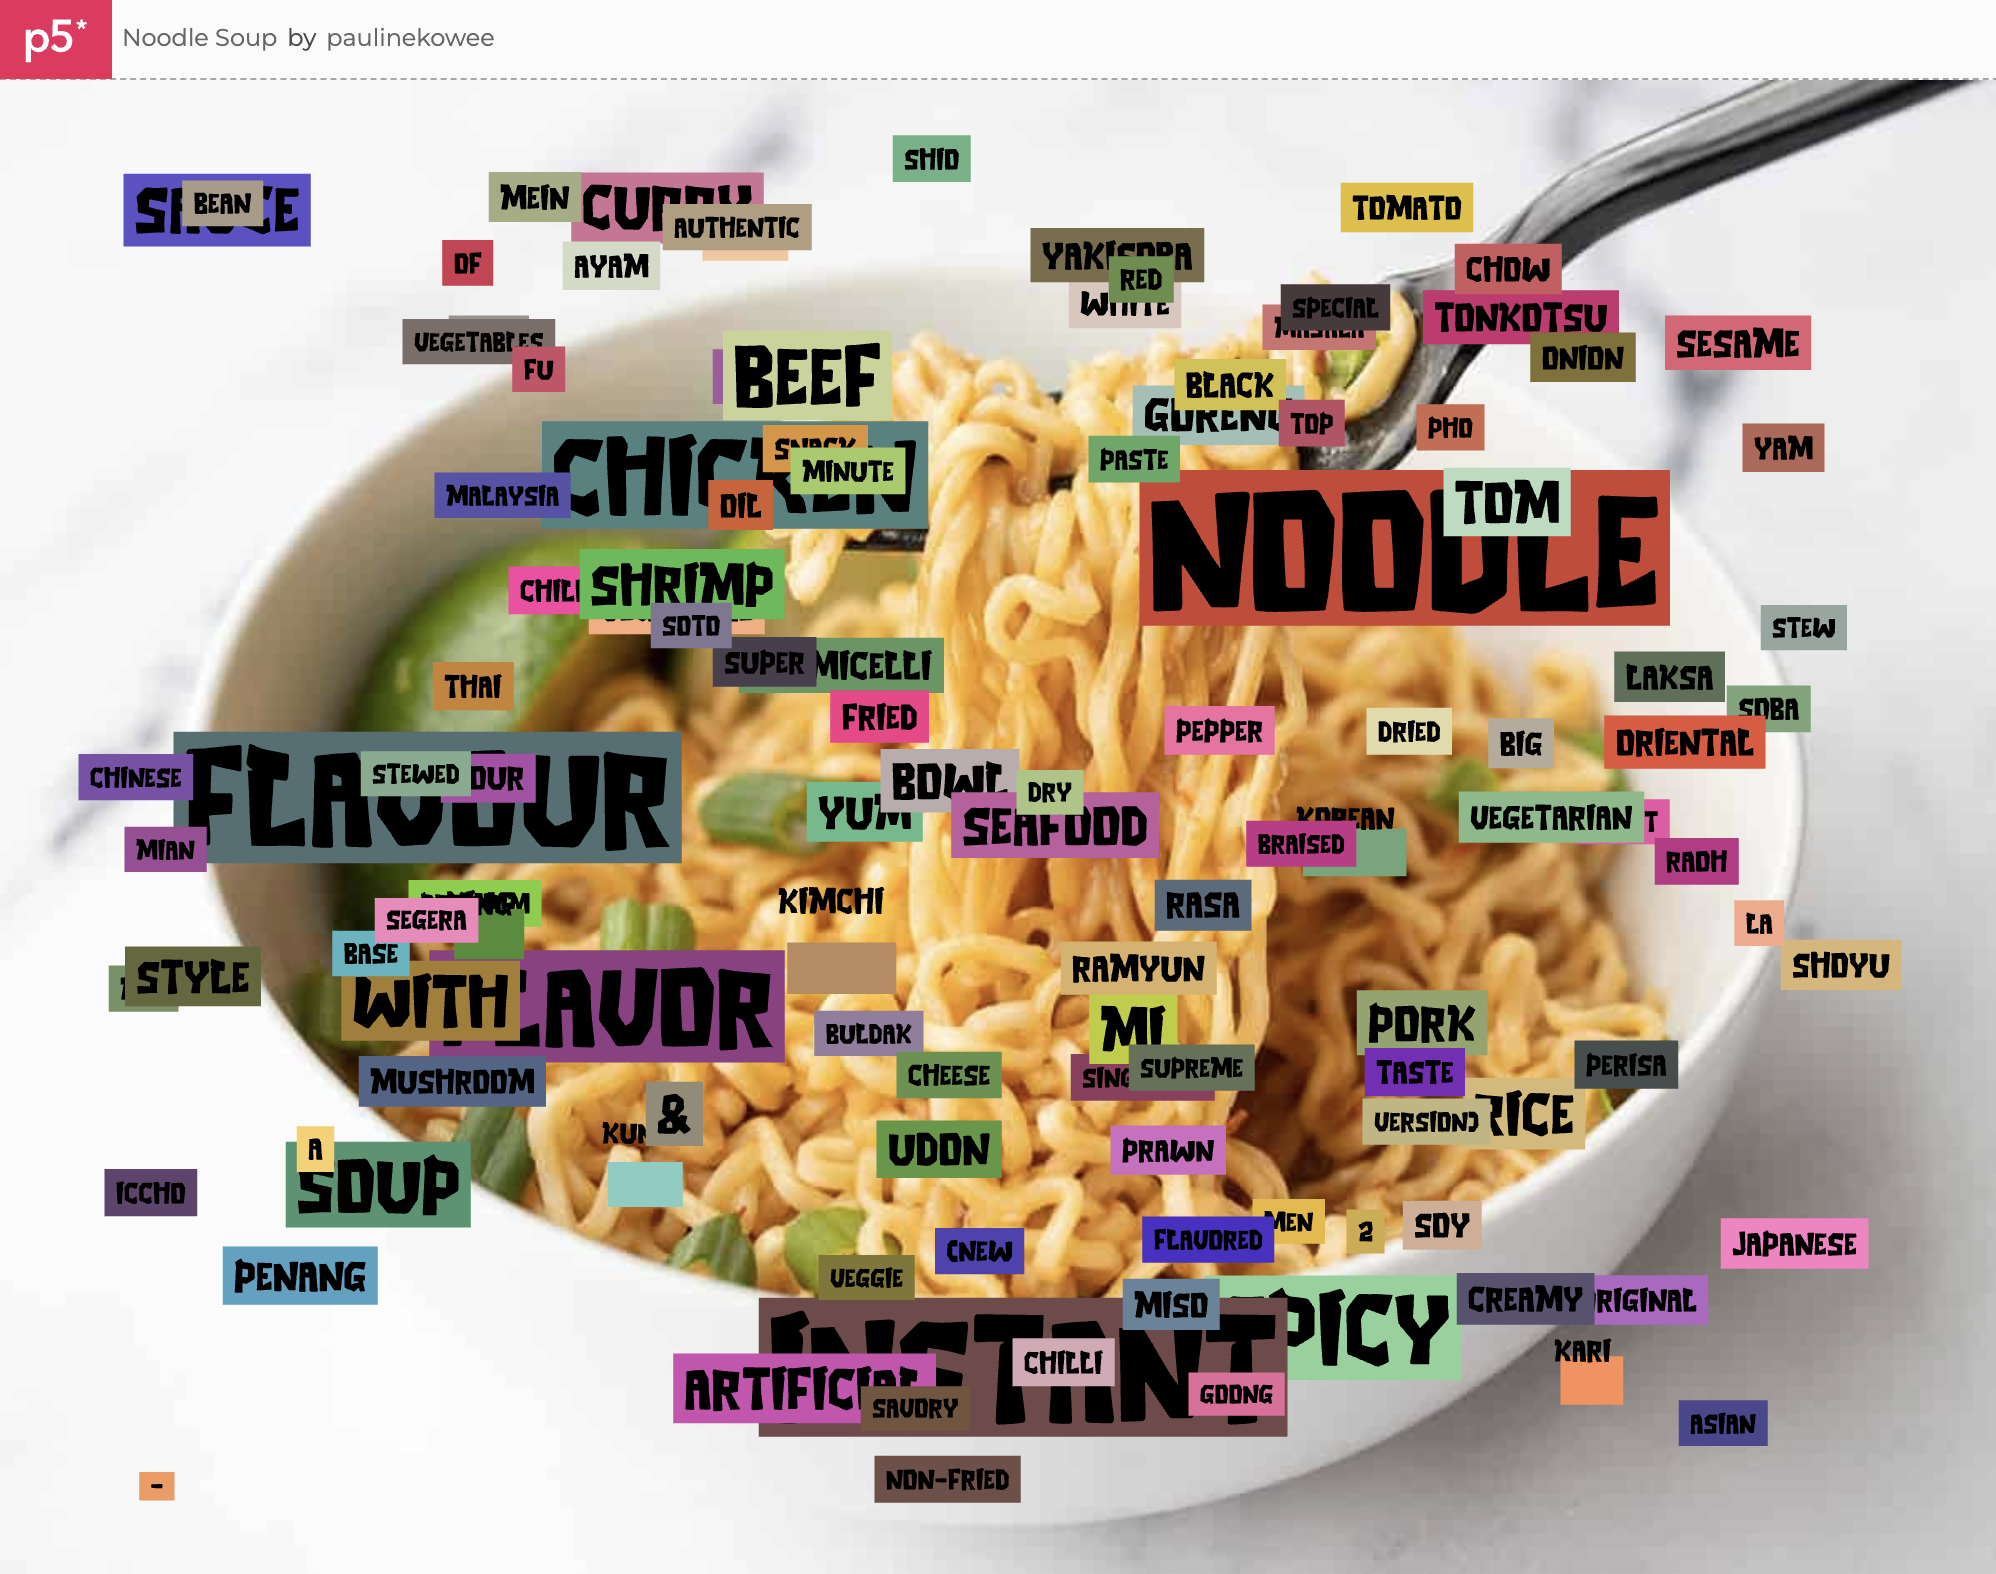
I’m pretty happy with the final work. I think the colors help make the entire piece look more interesting, and while the data isn’t perfect, it reveals some interesting insights: chicken seems to be the most popular (or at least more well-represented) as compared to beef, seafood, or fish, “flavour”/”flavor” is king, and “artificial” isn’t as big of a deterrent to good ramen as I thought it would be.
Some cool words that I wasn’t as familiar with also made it through the threshold, like Ayam, Rasa, and Goong. It made me realize that even though I’m a college student who’s quite often in the instant ramen aisle, I still don’t actually know much about the world of ramen, the various types that are out there, and what people actually like.
Final Sketch
View it in Fullscreen (A lot better since the image is so big)
In a future iteration of this project, I’d try to make my noodle word soup happen for real, probably by reworking my data structure or finding a smarter solution for all the crashing while loops I had to deal with. I’d also play with using sine waves for “noodles” or making the piece more interactive; right now it’s more of a generated work than an experience.
The typography is nice! You could think about how to make the “heavier” words more prominent. Maybe they could tend to be in front or more towards the middle. Also it’s a bit awkward when the words are cut off the edges of the screen – you could restrict the locations so you can always see the whole word and the piece would have more of a border around it. Nice work! I think in this case you could focus on making the layout really great before moving to interactivity.