
This week’s assignment was to either make a data visualization or generative text art. I decided to make a data visualization that involves text.
I went to Google Trends and found the most popular searches relating to anime, so I downloaded the csv file and added it to my sketch folder. I deleted the blank rows for my own convenience.
I made a for loop to display the searches in random places with random colors. It looked like this: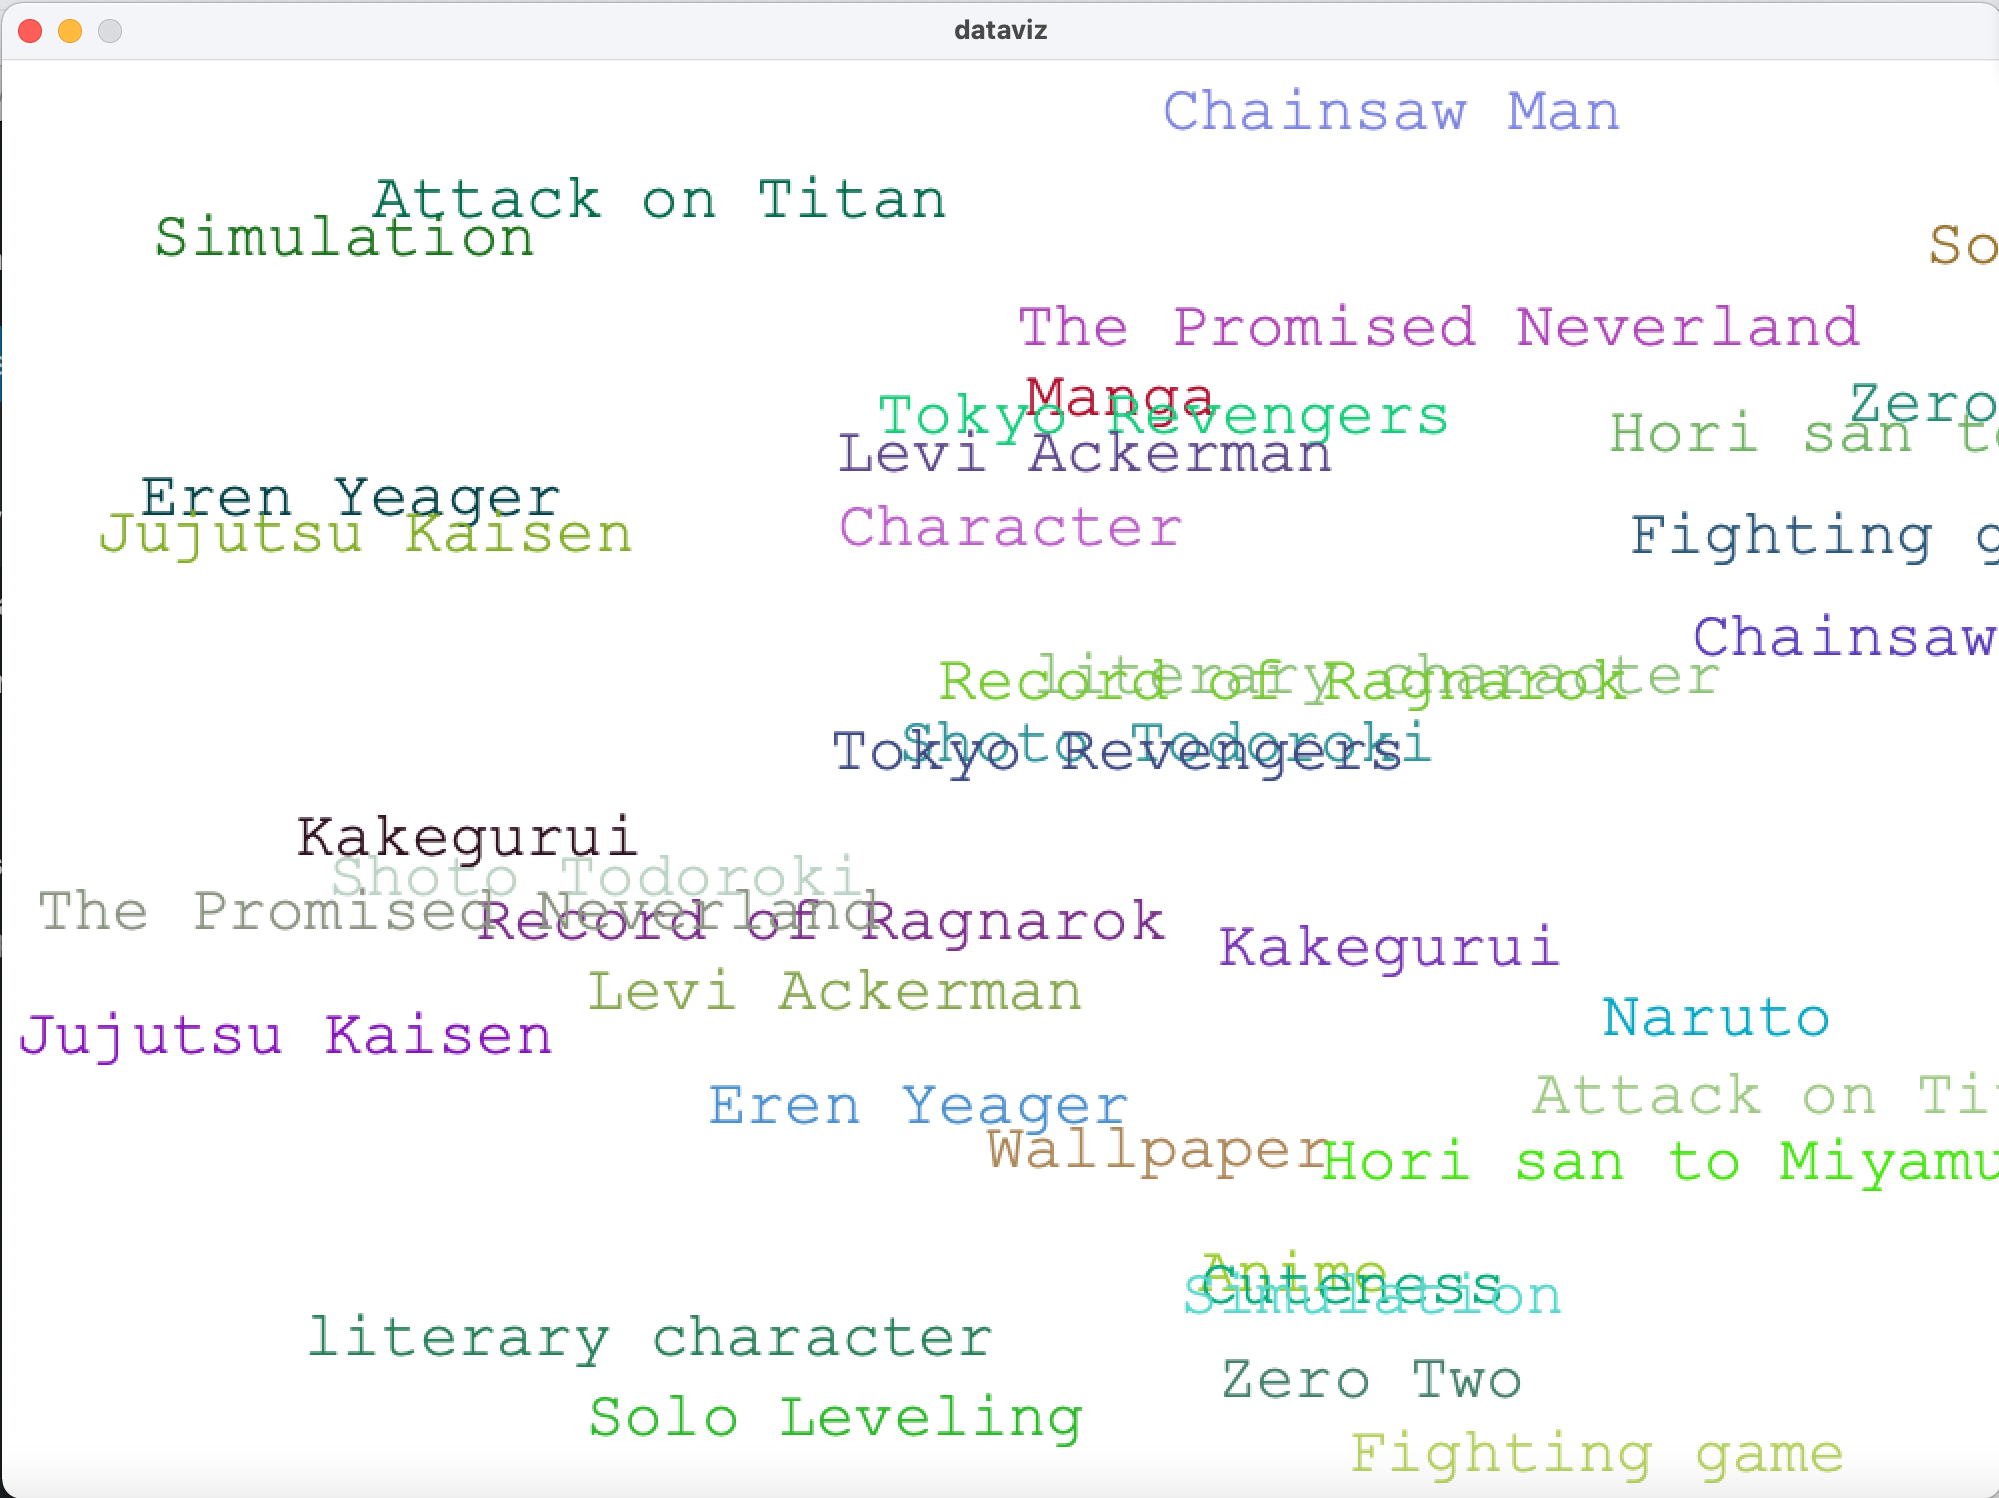
As you can see, the texts overlap and they continue on the right side outside of the sketch.
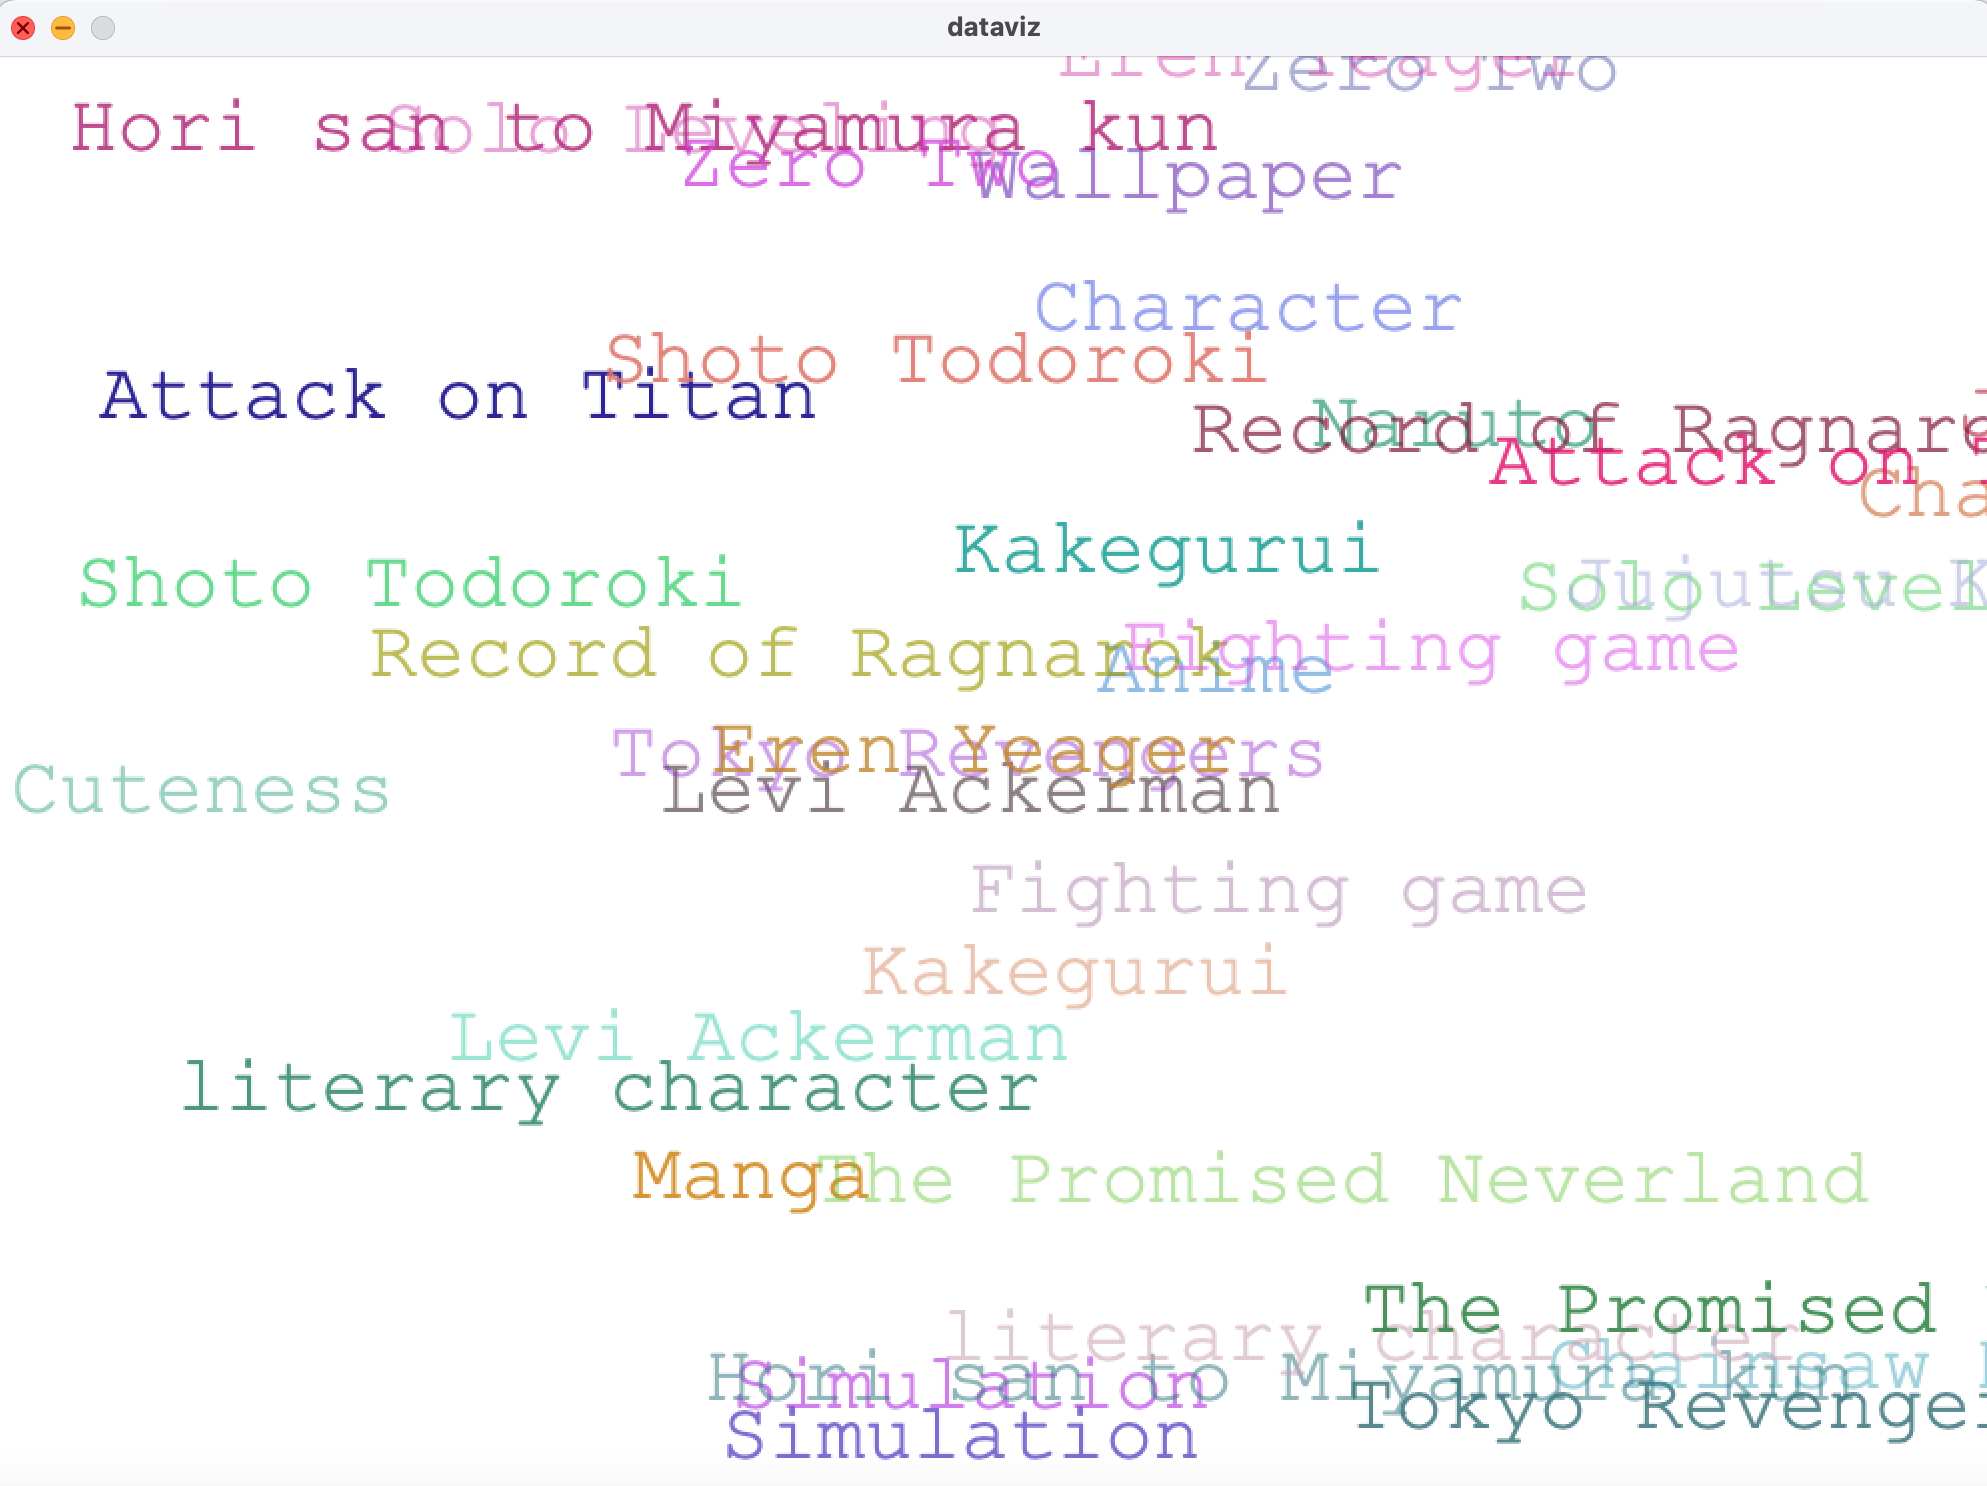
I wasn’t sure how to fix this from happening, so I just ended up adding transparency to the fill and it looks like this now: (I’d like to add that the positions are random so it changes every time you run it)
Here’s the code!
Table table;
float spacing;
PFont f;
String searches;
int tw;

void setup() {
  size(1000, 720);
  loadData();
  //f= createFont("Franklin Goth Ext Condensed.ttf", 75);
  // didnt work^
  f = createFont("Courier New", 32);
textFont(f);
textSize(40);
}

void loadData() {
  table = loadTable("anime.csv", "csv");
  spacing = float(width)/(table.getRowCount());

}

void draw() {
  background(255);
  frameRate(0); //so it doesnt keep changing
  for (int i = 0; i < table.getRowCount(); i++) {
    TableRow row = table.getRow(i);
    searches = row.getString(0);
    fill(random(230),random(230), random(230), random(100,240));
    text(searches, random(width), random(height));
  } //this for loop is going to loop through the table contents
}
Great job on putting this together Toomie. Something you can add is some spatial element that indicates the difference in popularity. Perhaps the size of the font is larger for more popular titles?