
Introduction:
In this assignment I am going to draw visualization graphs. Gives me opportunity to learn how to draw graphical representation of information and data. Human eye is trained on colors and patterns, and visualizing big scale data in terms of graphs and charts helps in understanding the data niches.
The idea for computer graphic:
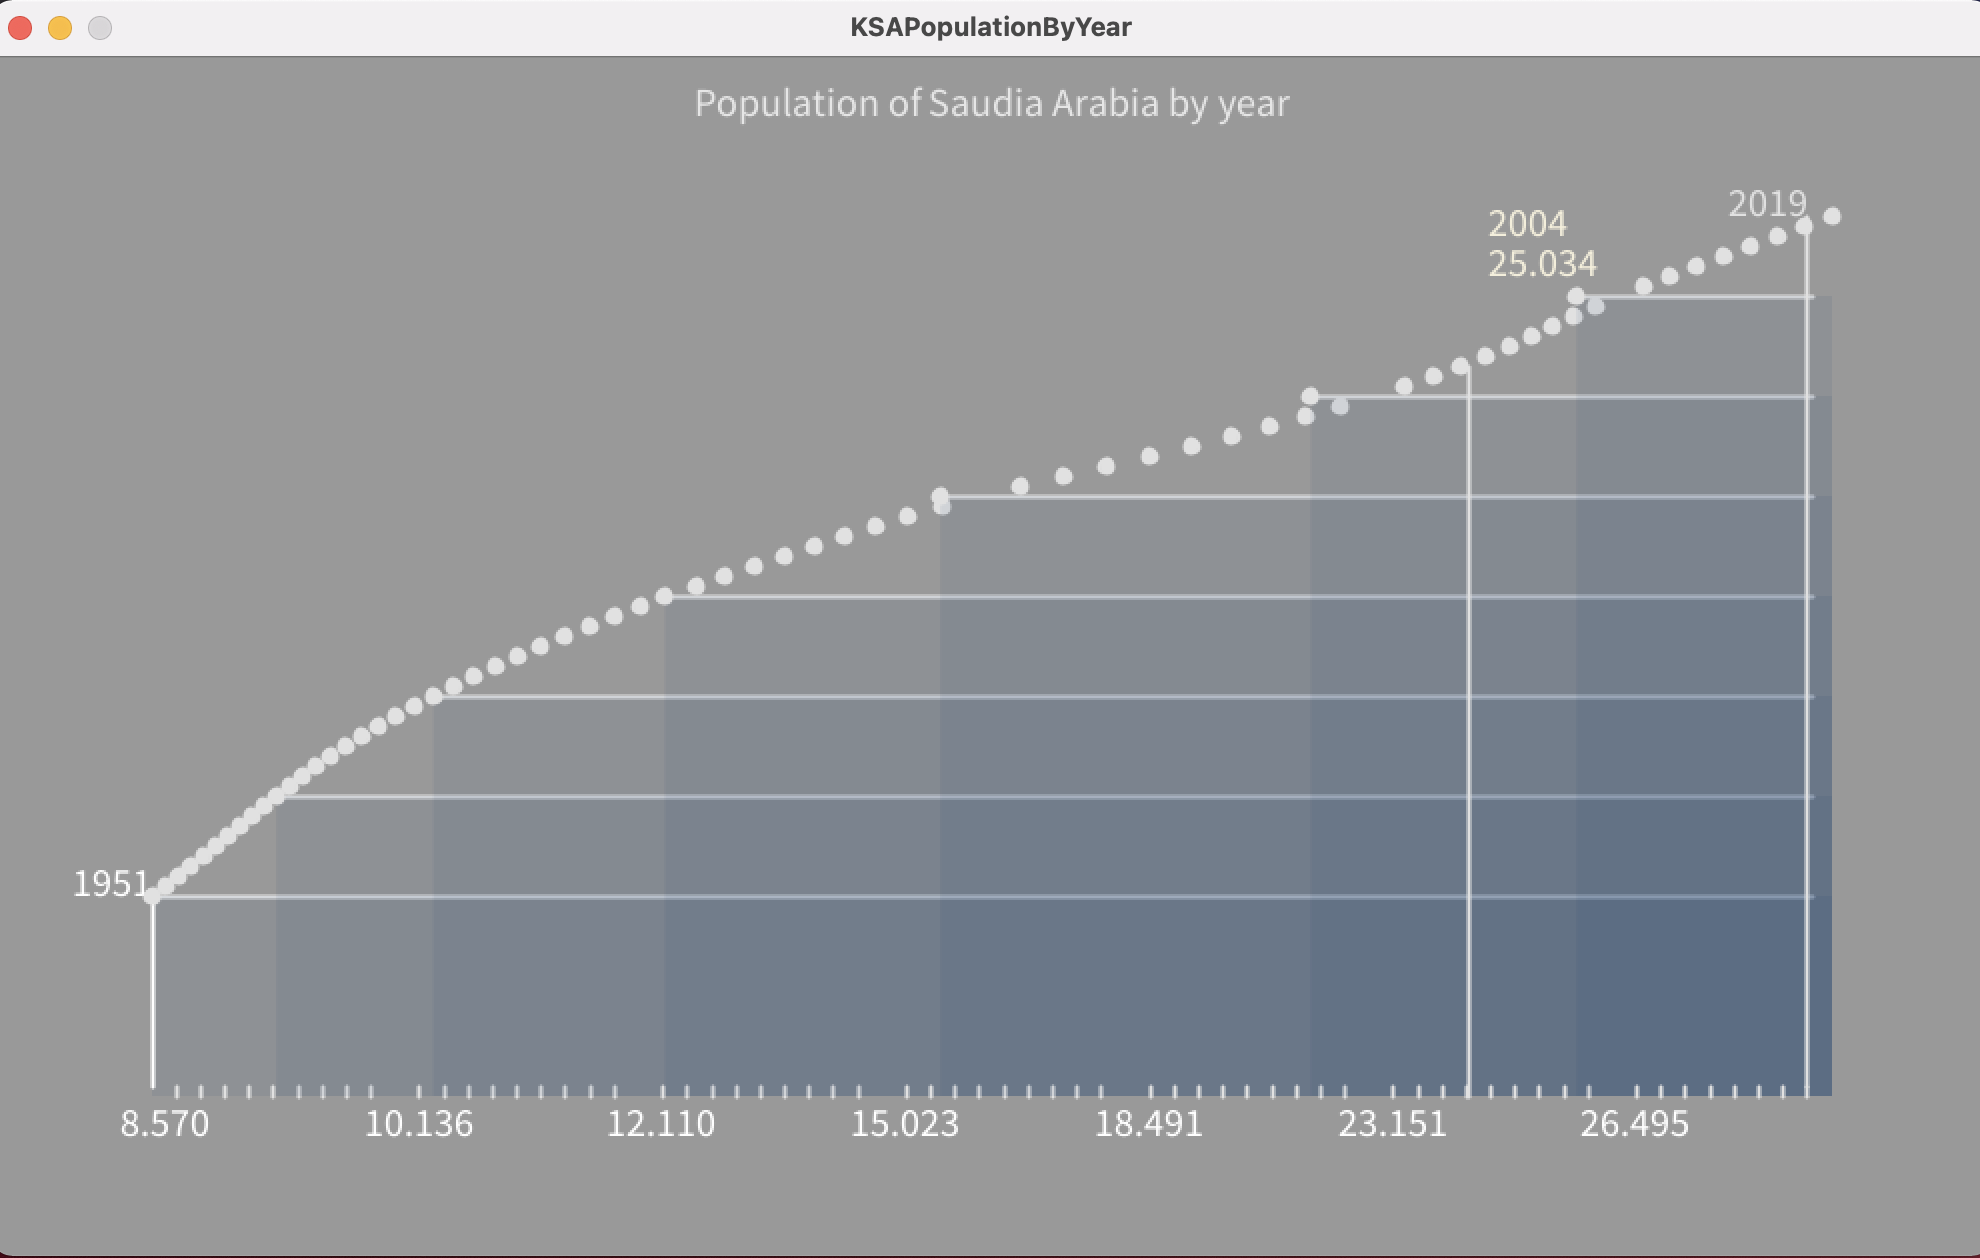
Every country economics depends upon the population and population of every country is increasing day by day. I got my idea of data visualization from the population of kingdom of Saudi Arabia. I collected data of KSA population from 1951 to 2019.
Challenges and Problems:
It was challenging for me to decide for the right graph to visualize population data. Plotting the points on x and y coordinates was also challenging because population is increasing for every next year. Reading of each year population value and storing in a 2D array was little challenging for me. Converting values to different data types in order fit in the graphs was challenging for me.
Procedure:
The very first thing I did is to create a class to manage important functions for converting data types and reading data from the external file. The data class constructor is retrieving data from the external file and then splitting the data based on splitter value. Each row contains year and population data and all rows are storing in a 2D array.
The data class contains functions which convert int values to float and float to int data types in order to fit in the graph. I override the functions with different parameter values for conversion from one type to another. I worked with indexing to get and return the right value from the 2D array.
Then I initialized a color array and fill up with color hex values. I initialized the data class object in the setup function and pass the external file name as parameter into it. I called the getRowCount function to get the number of rows which is year count.
In draw function, I am setting the background of the screen and setting the stroke weight to 230. Then I am aligning center and setting text for the graph title with text size 20. Then I initialized for loop in draw function which iterates till number of years ranges from 1951 to 2019. Then rounding the population value by 1000000 to get the value in float in order to represent on the graph. Then I worked on mouse movement on graph and prompting text which contains the population rounded value and year.
class Data
{

  int nrows;
  String[][] data;

  Data(String filename)
  {
    String[] rows = loadStrings(filename);
    data = new String[rows.length][];

    for (int i = 0; i < rows.length; i++)
    {
      // split the row on the tabs
      String[] datasplit = split(rows[i], TAB);
      // copy to the Data array
      data[nrows] = datasplit;
      nrows++;

    }
    // resize the 'data' array as necessary
    data = (String[][]) subset(data, 0, nrows);
  }


  int getRowCount()
  {
    return nrows;
  }


  // find a row by its name, returns -1 if no row found
  int getRowIndex(String name)
  {
    for (int i = 0; i < nrows; i++)
    {
      if (data[i][0].equals(name))
      {
        return i;
      }
    }
    return -1;
  }


  String getRowName(int row)
  {
    return getString(row, 0);
  }


  String getString(int rowIndex, int column)
  {
    return data[rowIndex][column];
  }


  String getString(String rowName, int column)
  {
    return getString(getRowIndex(rowName), column);
  }


  int getInt(String rowName, int column)
  {
    return parseInt(getString(rowName, column));
  }


  int getInt(int rowIndex, int column)
  {
    return parseInt(getString(rowIndex, column));
  }


  float getFloat(String rowName, int column)
  {
    return parseFloat(getString(rowName, column));
  }


  float getFloat(int rowIndex, int column)
  {
    return parseFloat(getString(rowIndex, column));
  }


  void setRowName(int row, String what)
  {
    data[row][0] = what;
  }


  void setString(int rowIndex, int column, String what)
  {
    data[rowIndex][column] = what;
  }


  void setString(String rowName, int column, String what)
  {
    int rowIndex = getRowIndex(rowName);
    data[rowIndex][column] = what;
  }


  void setInt(int rowIndex, int column, int what)
  {
    data[rowIndex][column] = str(what);
  }


  void setInt(String rowName, int column, int what)
  {
    int rowIndex = getRowIndex(rowName);
    data[rowIndex][column] = str(what);
  }


  void setFloat(int rowIndex, int column, float what)
  {
    data[rowIndex][column] = str(what);
  }


  void setFloat(String rowName, int column, float what)
  {
    int rowIndex = getRowIndex(rowName);
    data[rowIndex][column] = str(what);
  }

}

color[] palette = {#133463, #365FB7, #799AE0, #F4EFDC, #BA9B65};

Data populationData;
int nrows;
float mx = 79;
int opacity = 20;
int ellipseColor = 225;

void setup()
{
  size(1000, 600);
  populationData = new Data("KSAPopulation.tsv");
  nrows = populationData.getRowCount();
}

void draw()
{
  background(153);
  stroke(230);
  fill(230);
  textAlign(CENTER);
  textSize(20);
  text("Population of Saudia Arabia by year", width/2, 30);

  textAlign(LEFT);

  //read Data for population of each year:
  for(int row = 0; row < nrows; row++)
  {
    int years = populationData.getInt(row, 0);
    float populations = populationData.getFloat(row, 1);
    float x = map(populations, 8570449, 29709449, 80, width-80);
    float y = map(years, 2019, 1951, 80, height-180);
    float x2 = map(row, 0, 69, 80, width-80);

    float roundedPopulations = populations/1000000;

    if(years % 10 == 1)
    {
       line(x, y, width-90, y);
       fill(palette[0], opacity);
       noStroke();
       quad(x, y, width-80, y, width-80, height-80, x, height-80);
    }

    //X-axis label lines
    line(x2, height-80, x2, height-85);

    //X-axis text in difference of 10
    if((row % 10 == 0) || (row == 69))
    {
      stroke(255);
      fill(255);
      text(roundedPopulations, x2-20, height-60);
    }

    if((years == 1951) || (years == 2019))
    {
      text(years, x2-40, y);
      line(x2, y, x2, height-85);
    }

    //Information Line - with Interaction
    if((mx > 80) && (mx < width-80))
    {
      if(abs(mx - x) < 7)
      {
        strokeWeight(2);
        line(mx, y, mx, height-80);
        fill(palette[3]);
        text(years, mx+10, y-65);
        text(roundedPopulations, mx + 6, y-45);
      }
    }

     //Ellipse dot

     stroke(ellipseColor);
     int d = 7;
     fill(ellipseColor);
     ellipse(x, y, d, d);
    }

  }


void mouseMoved()
{
  mx = mouseX;
}
Final work:
Conclusion:
I learned how to draw a graph and represent numerical values on it. Gives me opportunity to work on 2D arrays. I learned how to convert one data type to another. I experienced text rendering on graphs. I learned ow to get and set 2D array indexes. Helps me to build my logic on data visualization. I learned how to override functions with same name but different parameters. I learned how to manipulate for loop iterations on a series of data and check for different conditions in order to represent data on graphs.
Great job Theyab, nice to have that interaction in there too.