
For this week’s assignment, I wanted to start working on something that was related to honeybees. Since we learned about typography in class, I had this concept of a bee moving in the shape of the word “BEE” leaving behind a trail usually shown in animations/pictures depicting bees.
Based on an example from the last class which used the geomerative library to make the word “circle” from circles, I made the word “BEE” with a bunch of points and had the points showing up in such a way that it looked like a bee-like object traced the word. I made a class for the bee and a function to display the bee moving. The bee was made from a circle and two triangles to make wings. Here’s how this turned out.
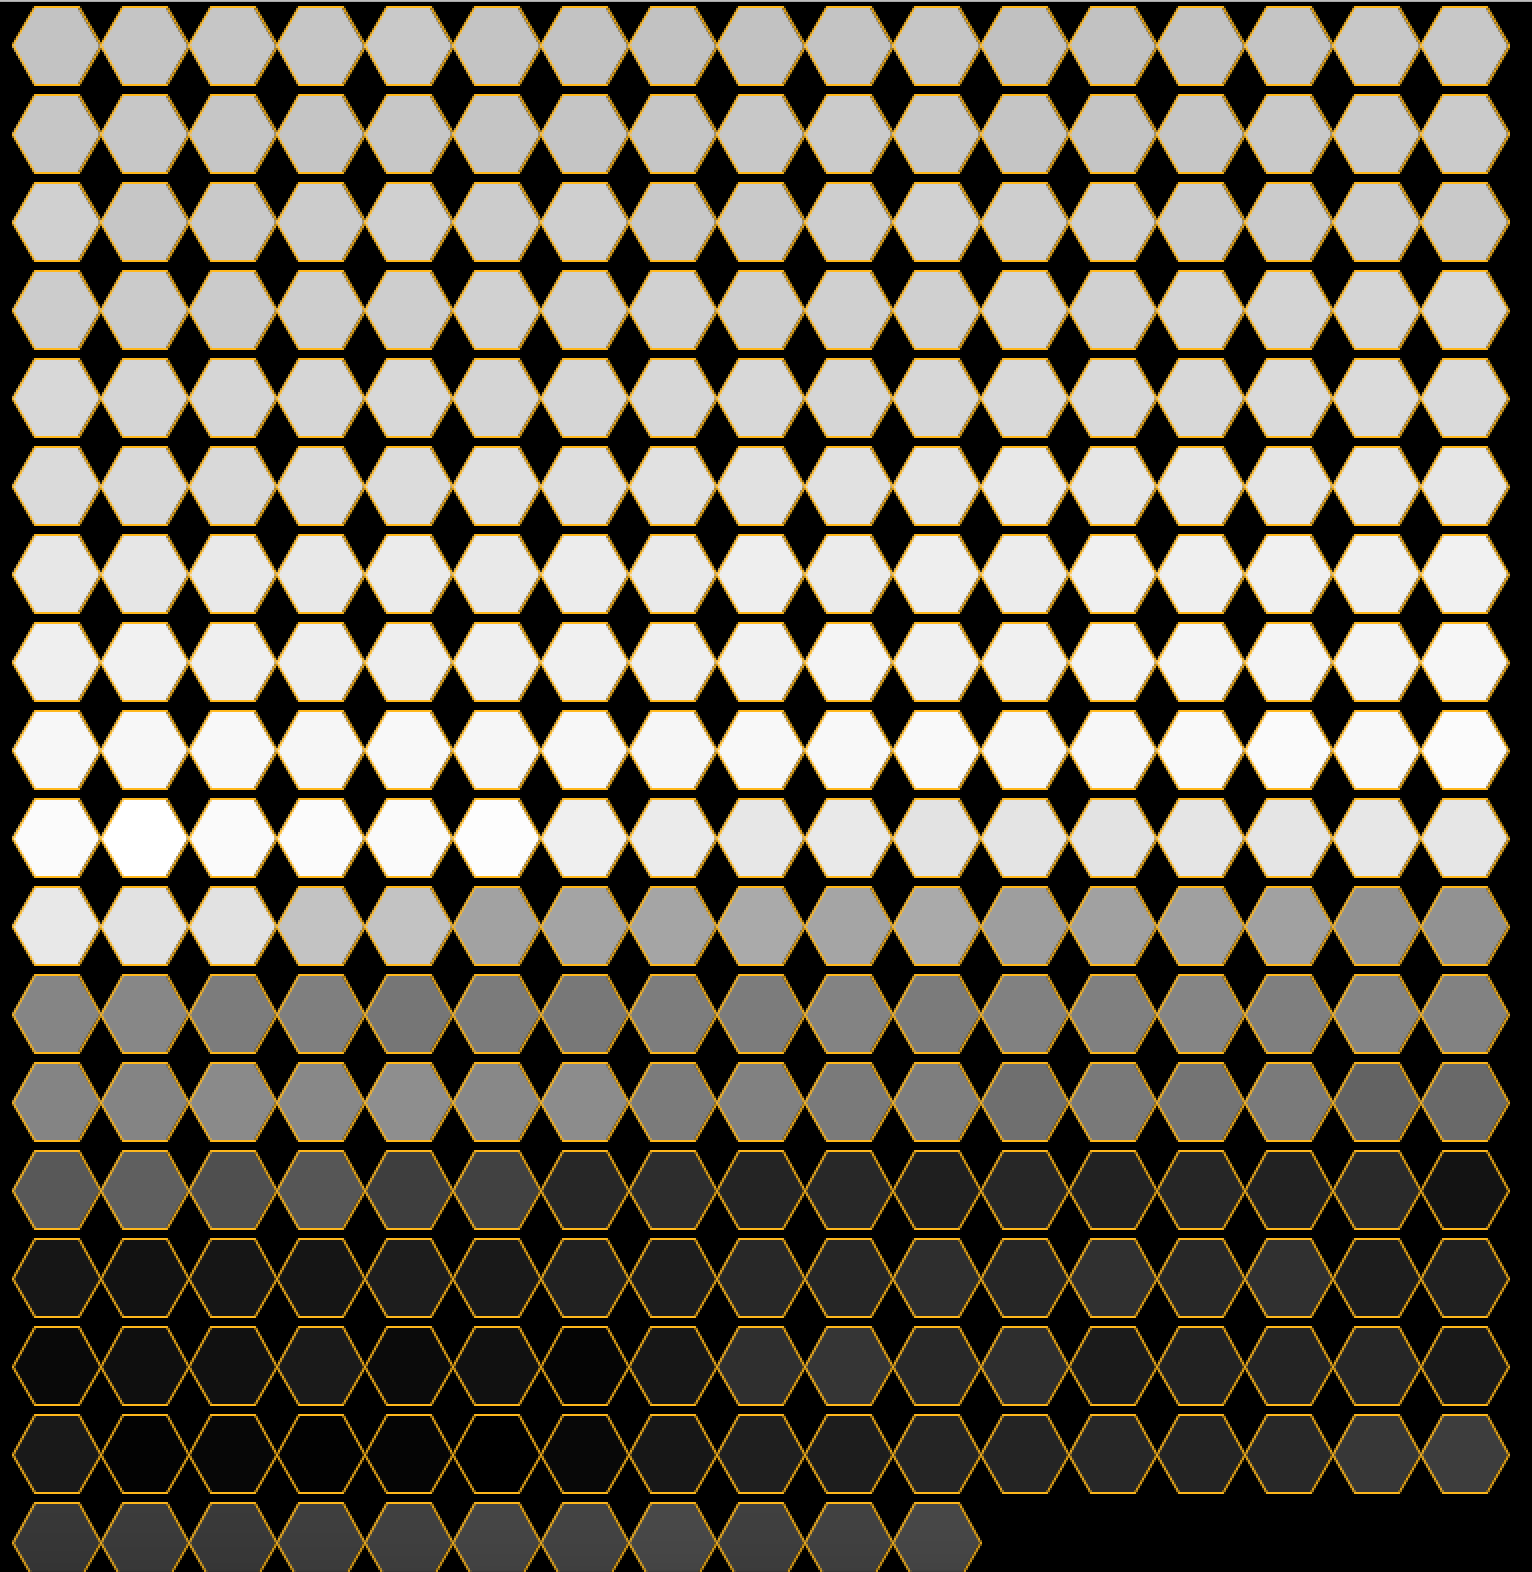
I wanted to add more things to this and so, I decided to look up some datasets related to honey and bees. That’s when I came across a Kaggle page with beehive metrics (https://www.kaggle.com/se18m502/bee-hive-metrics). I used the values from the CSV file from 2019 which measured the weight of a beehive named schwartau and I used the data over the first 5 months of 2019. I used hexagons to show the data to resemble a honeycomb. To achieve this shape, the processing documentation helped a lot. The code was kind of similar to the idea of translating polar to cartesian coordinates for a circle and so, I understood it after experimenting with it for some time. I looked at different ways of visualizing these hexagons in terms of sizes and colors and ended up with the following visual where the color represented how heavy the beehive was. I worked on this on a separate processing program.
Finally, I combined both the programs wherein the beehive weight visualization formed the background and the word “BEE” was written on the screen. I changed the color palette and transparency of the colors. The beehive visualization had shades of yellow representing honey and it looked really cool against a black background so, I decided to finalize that palette. But the problem was that the animation of the word “Bee” wasn’t clear on-screen and so I decided to change the shape that the bee traced from a point to another hexagon and gave it a very clear shade of honey. This made it stand out.
Since the data and the hexagons were not proportional to the size of the screen, there was some empty space below. So I decided to fill it with another word and I chose the word “Happee” (rhymes with bee, bee is happy that the beehive is heavy, “be happy”). And I put this when the bee is done writing the word “BEE” on screen.
Here’s the final output –
Here’s the code –
import geomerative.*;
RFont font;
String phrase = "BEE";

RPoint[] pnts;
PFont f;
String phrase_1="HAPPEEE";

float xOffset =0;
float yOffset = 150;

int endX; //ending points of hex visual - x coordinate
int endY; //ending points of hex visual - y coordinate
int rad =22; //radius of hexagons


void setup() {
  size(800, 800);
  background(0);

  f=createFont("Courier New",64); //for text "HAPPEEE"
  textSize(32);
  textFont(f);


  RG.init(this);
  font = new RFont("OpenSansCondensed-Light.ttf", 500, RFont.LEFT);

  //setting segment length according to radius of hexagon
  RCommand.setSegmentLength(8);
  RCommand.setSegmentator(RCommand.UNIFORMLENGTH);
  RGroup grp;
  grp = font.toGroup(phrase);
  grp = grp.toPolygonGroup();
  pnts = grp.getPoints();


  xOffset = width - grp.getBottomRight().x - grp.getBottomLeft().x;
  xOffset = xOffset/2;

  //beehive weight visualization
  beeVis();

  noFill();
  stroke(255, 0, 0, 75);
}


//beehive weight visualization
void beeVis()
{
  //beehive weight over 5 months in 2019
  Table table = loadTable("weight.csv","header");

  //minimum value from table of data
  float OldMin = 61188.87528 ;

  //initial height and width of hexagon - rad is added as it is centered, otherwise a half of the hexagon would be hidden
  int h=rad;
  int w=rad+10;


  // iterate over all the rows in a table
  for (int i = 0; i < table.getRowCount(); i++) {
    TableRow row = table.getRow(i);
    float Value = row.getFloat("x");

    //getting the x values to a new range and between 0 to 255 to use for colors
    float x= ((Value -OldMin ) * (255 - 0)) / (80000 - OldMin);

    //fill color is proportional to weight of honeycomb at a given time
    fill(255,255-x,0,100);
    //hexagon has stroke color of honey
    stroke(255,184,28);
    //hexagon
    polygon(w, h,rad);
    //update width
    w+=rad*2;


   //if width is out of range, update height and width
     if((w+rad)>=800)
    {
     h+=rad*2;
     w=rad+10;
    }

  }


 //final coordinates of w and h are recorded to put the phrase "happy"
 endX=w;
 endY=h;

}

void draw() {

  background(0);
  beeVis();
  Bee bee;

  if(frameCount<pnts.length)
  {
    //bee moving
    float x = pnts[frameCount%pnts.length].x + xOffset;
    float y=pnts[frameCount%pnts.length].y + height/2 + yOffset;
    PVector p = new PVector(x, y);
    bee = new Bee(p);
    bee.display();

 //bee leaving trails of hexagons
  for (int j=0; j<frameCount%pnts.length; j++)
  {
    float x_ = pnts[j].x+ xOffset;
    float y_ = pnts[j].y+ height/2+ yOffset;
    stroke(0);
    fill(255,184,28);
    polygon(x_, y_,8);
  }
}

//once "bee" is written, "happy" will be shown and the word "bee" has a swarm like effect
else
{
  fill(255,184,28);
  text(phrase_1,endX,endY+10);


  for (int i=0; i< pnts.length; i++) {
      float swarm = (noise(frameCount*.01+i*.02)-.5)*10;
      float x = pnts[i].x + swarm + xOffset;
      float y = pnts[i].y + swarm + height/2 + yOffset;
      stroke(0);
      polygon(x, y,8);
    }

  }
}


//polygon function to make hexagon
void polygon(float x, float y, float radius) {
  float angle = TWO_PI / 6;
  beginShape();
  for (float a = 0; a < TWO_PI; a += angle) {
    float sx = x + cos(a) * radius;
    float sy = y + sin(a) * radius;
    vertex(sx, sy);
  }
  endShape(CLOSE);
}
Here’s the bee class –
//bee class

class Bee {
  PVector position;

  Bee(PVector p) {
    position = p;
  }

  void display() {
    stroke(255);
    triangle(position.x-10, position.y-5 ,position.x+5, position.y+3, position.x-10, position.y-10);
    triangle(position.x-10, position.y-15 ,position.x+5, position.y+3, position.x-10, position.y-10);
    fill(255);
    circle(position.x, position.y, 10);
  }
}
References
https://processing.org/examples/regularpolygon.html
https://www.kaggle.com/se18m502/bee-hive-metrics
Great job Gopika! Now you know how to use images you could use a bee image flying around, that might be nice.