DataViz : NYUAD 10th anniversary

Inspiration

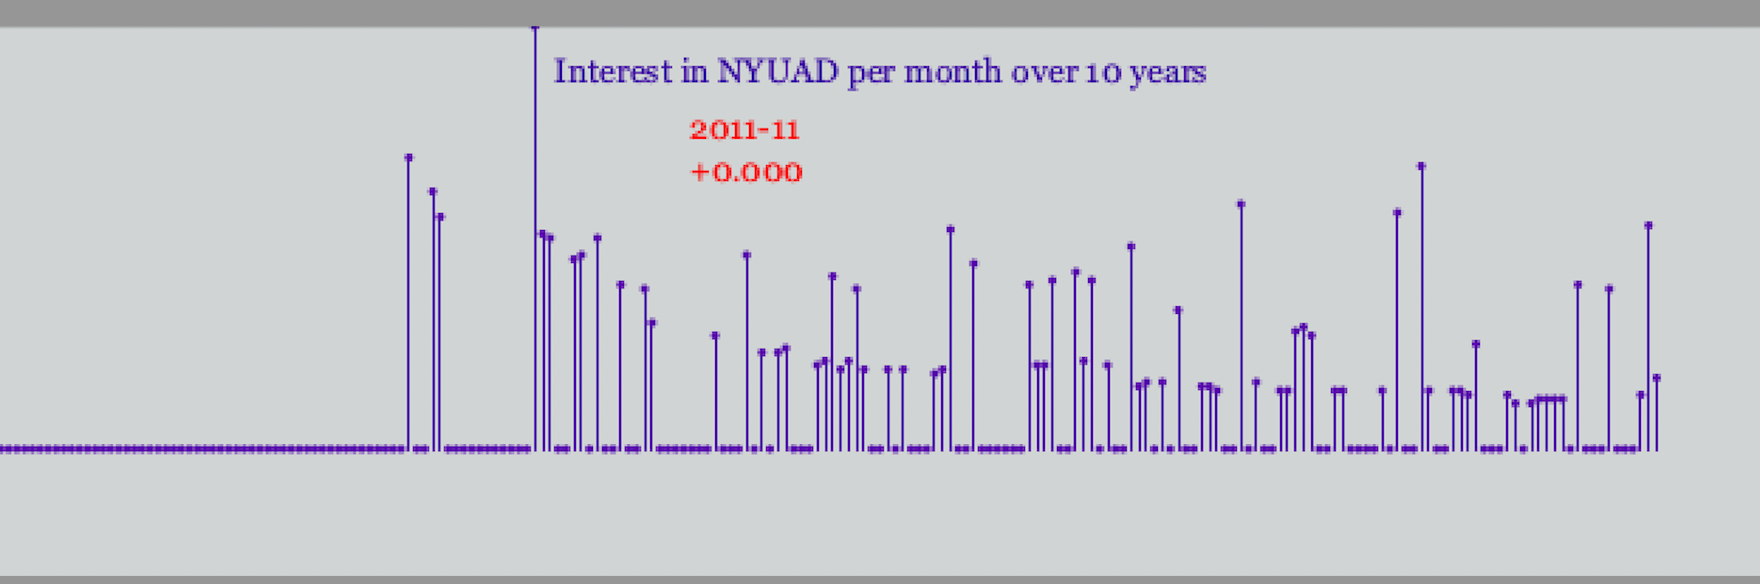
This data visualization was done in celebration of NYU Abu Dhabi’s 10th anniversary. What has been the interest in NYU Abu Dhabi overtime for the past ten years based on google searches?

Process

Using Google Trends, I got the data of searches for NYUAD from 2004 to the present grouped by months.

After loading the data, I went through each column mapping the rows to a wider range of values. For the second column, I mapped from 150 to 0 as opposed to the other way round to avoid drawing the lines upside-down.

After cleaning my data through the map function, I drew lines with a little circle on top. The little circle on top was drawn using ellipses with small diameters. I used smooth() to draw lines with anti-aliased edges.

To make things more interesting, I added a new line with red color that shows the date and increment in searches when the mouse pointer is moved. I achieved this using the nfp () function which formats a number to a string and shows ” + ” when positive and ” – ” when negative.

Final Work

DataViz

Video

Challenges

Cleaning the data was the biggest challenge. Did a lot of trial and error to find the right scale for mapping. I had trouble making the lines a bit bigger. I wanted to deepen the line representing the start of each year but it looked horrible. I wanted to add labels below the line graph but it appeared to be clustered.

Code
Plain text
Copy to clipboard
Open code in new window
EnlighterJS 3 Syntax Highlighter
// Line plot of NYUAD search per month
color [] Pride = { #ffffff, #560BAD , #480CA8,#3A0CA3, #FF0000};
color [] palette = Pride;
Table table;
PFont titleFont;
int mx = 30; // mouseX position
void setup() {
size(640, 200);
// set fonts
titleFont = createFont("Georgia", 12);
// load Data
table = loadTable("NYUADTimeline.csv", "header");
// draw with smooth anti-aliased edges
smooth(2);
}
void draw() {
background(palette[0]);
textFont(titleFont);
stroke(palette[4]);
fill(palette[3]);
textAlign(CENTER);
text("Interest in NYUAD per month over 10 years", width/2, 20);
for (int row = 0; row < table.getRowCount(); row++) {
String dates = table.getString(row, 0);
float searches = table.getFloat(row, 1);
float x = map(row, 0, 216, 0, 600);
float y = map(searches, 0, 100, 150, 0);
// SLIDER
if((mx > 30) && (mx < 640)) {
line(mx, 30, mx, 150);
if(abs(mx - x) < 2) {
fill(palette[4]);
// show the dates and search count
text(dates, mx + 6, 40);
// format numbers into strings with 1 decimal to left and 3 to right
text(nfp(searches, 1, 3), mx + 6, 55);
}
}
// DRAW Lines and dots on top
// thickness of each line
strokeWeight(1);
stroke(palette[1]);
line(x, y, x, 150);
noStroke();
fill(palette[1]);
int d = 3;
ellipse(x, y, d, d);
}
}
void mouseMoved() {
mx = mouseX;
}
// Line plot of NYUAD search per month color [] Pride = { #ffffff, #560BAD , #480CA8,#3A0CA3, #FF0000}; color [] palette = Pride; Table table; PFont titleFont; int mx = 30; // mouseX position void setup() { size(640, 200); // set fonts titleFont = createFont("Georgia", 12); // load Data table = loadTable("NYUADTimeline.csv", "header"); // draw with smooth anti-aliased edges smooth(2); } void draw() { background(palette[0]); textFont(titleFont); stroke(palette[4]); fill(palette[3]); textAlign(CENTER); text("Interest in NYUAD per month over 10 years", width/2, 20); for (int row = 0; row < table.getRowCount(); row++) { String dates = table.getString(row, 0); float searches = table.getFloat(row, 1); float x = map(row, 0, 216, 0, 600); float y = map(searches, 0, 100, 150, 0); // SLIDER if((mx > 30) && (mx < 640)) { line(mx, 30, mx, 150); if(abs(mx - x) < 2) { fill(palette[4]); // show the dates and search count text(dates, mx + 6, 40); // format numbers into strings with 1 decimal to left and 3 to right text(nfp(searches, 1, 3), mx + 6, 55); } } // DRAW Lines and dots on top // thickness of each line strokeWeight(1); stroke(palette[1]); line(x, y, x, 150); noStroke(); fill(palette[1]); int d = 3; ellipse(x, y, d, d); } } void mouseMoved() { mx = mouseX; }
// Line plot of NYUAD search per month

color [] Pride = {  #ffffff, #560BAD , #480CA8,#3A0CA3, #FF0000};
color [] palette = Pride;

Table table;

PFont titleFont;

int mx = 30; // mouseX position


void setup() {
 size(640, 200);
 
 // set fonts
 titleFont =  createFont("Georgia", 12);
 
 
 // load Data
 table = loadTable("NYUADTimeline.csv", "header");
 
 // draw with smooth anti-aliased edges
 smooth(2); 
 
}


void draw() {
  background(palette[0]);
  textFont(titleFont);
  stroke(palette[4]);
  fill(palette[3]);
  textAlign(CENTER);
  text("Interest in NYUAD per month over 10 years", width/2, 20);
  

  for (int row = 0; row < table.getRowCount(); row++) {
    
    String dates = table.getString(row, 0);
    float searches = table.getFloat(row, 1);
    float x = map(row, 0, 216, 0, 600);
    float y = map(searches, 0, 100, 150, 0);


    // SLIDER
    if((mx > 30) && (mx < 640)) {
      line(mx, 30, mx, 150);
      if(abs(mx - x) < 2) {
        fill(palette[4]);
       
       // show the dates and search count
        text(dates, mx + 6, 40);
        
        // format numbers into strings with 1 decimal to left and 3 to right
        text(nfp(searches, 1, 3), mx + 6, 55);
      }
    }  
    
   
    // DRAW Lines and dots on top
     
    // thickness of each line
    strokeWeight(1); 
    
    stroke(palette[1]);
    line(x, y, x, 150);
    noStroke();
    fill(palette[1]);
    int d = 3;
    ellipse(x, y, d, d);
   
  }
  
  
}


void mouseMoved() {
  mx = mouseX;
}


2 thoughts on “DataViz : NYUAD 10th anniversary”

Leave a Reply