
Inspiration:
I think that it is useful to know how to visualize data and generate text in Processing. That’s why this week I explored them both, not focusing only on one of them. To be honest, before this version I had many other attempts to make something creative (lyric video, for example). However, I gave up for now and decided to represent and compare the interest overtime for a few of my favorite TV-shows, Game of Thrones, Sherlock, and Grey’s Anatomy.
Process:
I took the data from Google Trends Explore and had 3 CSV files, which graphs you can see below. I also added text at the top of my work using the geomerative library. I played with sizes, figures, colors, and actually understood what the functions of this library mean using this resource.
I displayed 3 graphs under each other and added titles to them. I also had the timeline that shows which years are displayed. All titles are typewritten (kinda), so they appear letter by letter.
Problems:
This assignment was not as easy as I thought, so I spend hours understanding how things work here. The order of functions is extremely important because few times elements didn’t display only because I messed up the order.
Result: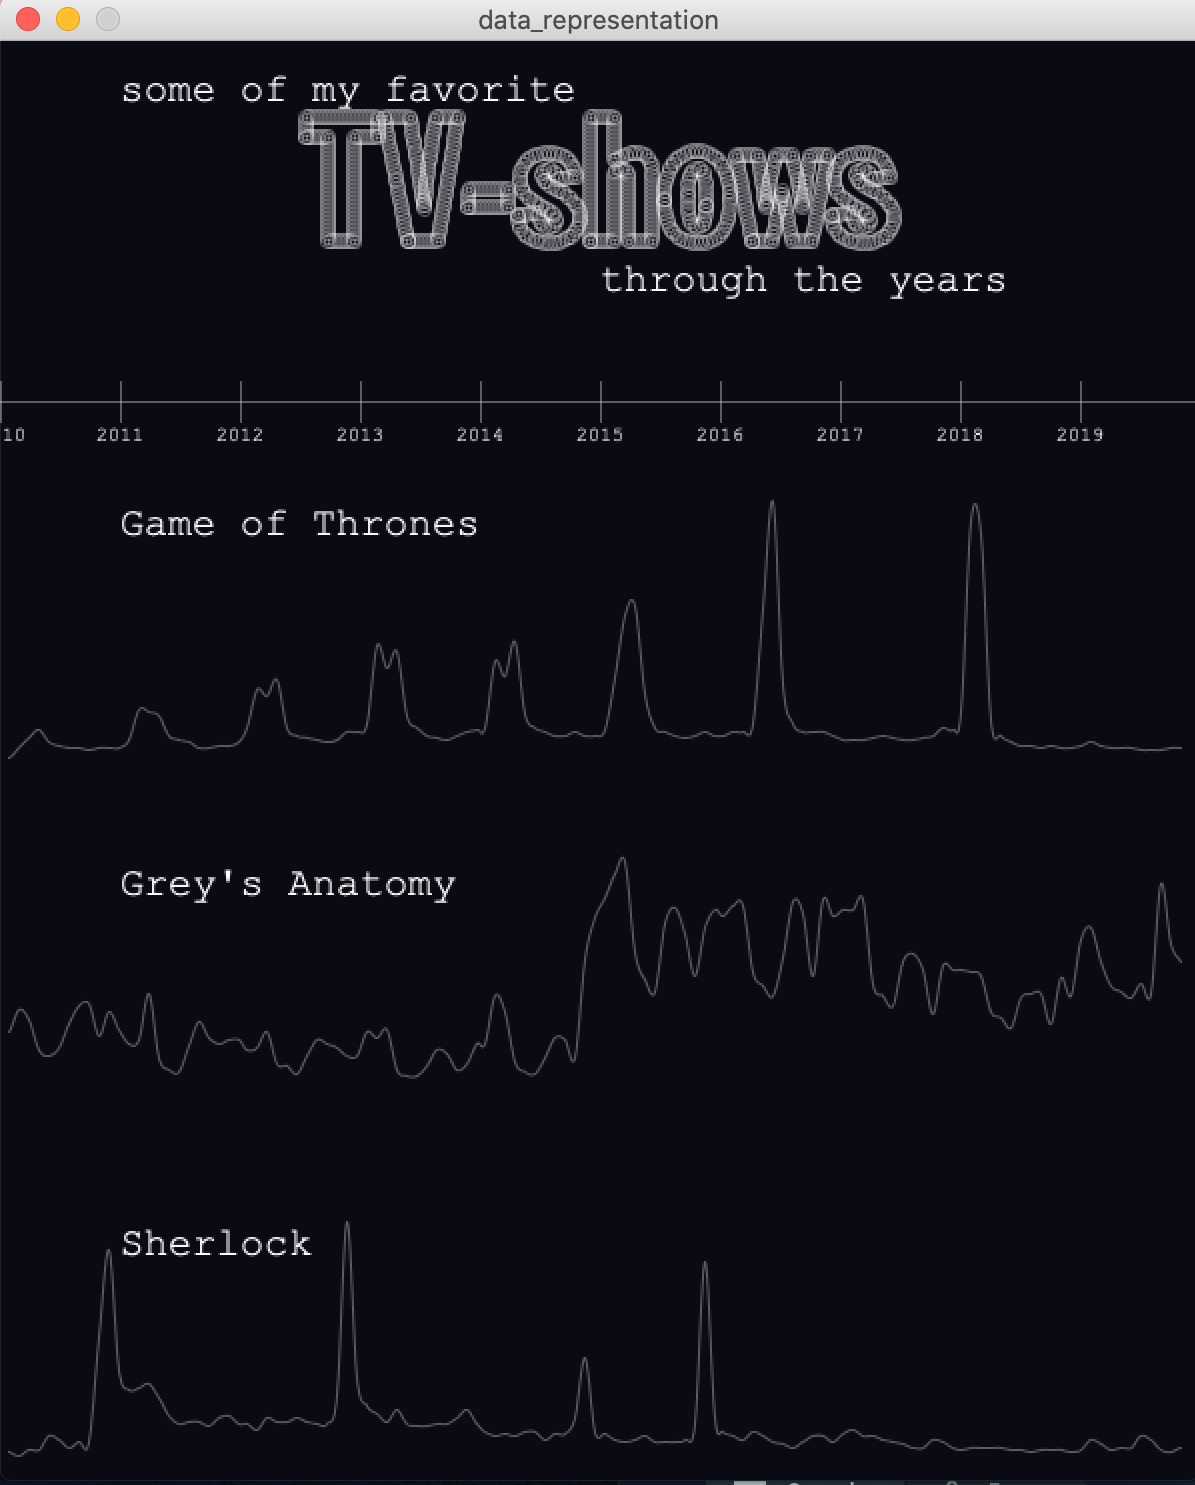
Code:
import geomerative.*;
RFont font;
RPoint[] pnts;
String phrase = "TV-shows";
String word1 = "Game of Thrones";
String word2 = "Grey's Anatomy ";
String word3 = "Sherlock       ";
float xOffset = 0;
Table table1, table2, table3;
float spacing;
PFont f;
int counter;

float[] intervals = new float[11];

void setup() {
  size(600, 720);
  loadData();
  stroke(255, 0, 0, 75);
  smooth();
  frameRate(5);

  f = createFont("Courier New", 10);
  textFont(f);

  RG.init(this);
  font = new RFont("Franklin Goth Ext Condensed.ttf", 85, RFont.LEFT);

  RCommand.setSegmentLength(2);
  RCommand.setSegmentator(RCommand.UNIFORMLENGTH);
  RGroup grp;
  grp = font.toGroup(phrase);
  grp = grp.toPolygonGroup();
  pnts = grp.getPoints();
  xOffset = width - grp.getBottomRight().x - grp.getBottomLeft().x;
  xOffset = xOffset/2;

  for (int i=0; i<10; i++) {
    intervals[i]=width/10*i;
  }

  noFill();
  stroke(255, 255, 255, 85);
}

void loadData() {

  // Load CSV file into a Table object
  // "header" option indicates the file has a header row
  table1 = loadTable("GameOfThrones.csv", "csv");
  spacing = float(width)/(table1.getRowCount()-3);
  println(table1.getRowCount()+" "+spacing);

  table2 = loadTable("GreysAnatomy.csv", "csv");
  spacing = float(width)/(table2.getRowCount()-3);
  println(table2.getRowCount()+" "+spacing);

  table3 = loadTable("Sherlock.csv", "csv");
  spacing = float(width)/(table3.getRowCount()-3);
  println(table3.getRowCount()+" "+spacing);
}

void draw() {
  background(10, 10, 20, 80);

  line(0, height/4, width, height/4);


  for (int i=0; i<10; i++) {
    line(intervals[i], height/4+10, intervals[i], height/4-10);
    fill(0, 102, 153, 204);
    textAlign(CENTER);
    textFont(f);
    fill(255);
    text("201"+i, intervals[i], height/4+20);
  }

  textAlign(LEFT);
  textSize(20);
  fill(255);
  typewriteText(word1,  width/10, height/4+50);

  typewriteText(word2, width/10, height/2+50);

  typewriteText(word3, width/10, height/4*3+50);

  text("some of my favorite", width/10, 30);
  text("through the years", width-width/2, height/4-55);

  noFill();

  beginShape();
  for (int i = 3; i < table1.getRowCount(); i++) {
    TableRow row0 = table1.getRow(i);
    float interest = row0.getFloat(1);
    float x = (i-3)*spacing ;
    float y = map(interest, 0, 100, height/2, height/4+50);
    curveVertex(x, y);
  }
  endShape();

   beginShape();
  for (int i = 3; i < table2.getRowCount(); i++) {
    TableRow row0 = table2.getRow(i);
    float interest = row0.getFloat(1);
    float x = (i-3)*spacing ;
    float y = map(interest, 0, 100, height*3/4, height/2+50);
    curveVertex(x, y);
  }
  endShape();

   beginShape();
  for (int i = 3; i < table3.getRowCount(); i++) {
    TableRow row0 = table3.getRow(i);
    float interest = row0.getFloat(1);
    float x = (i-3)*spacing ;
    float y = map(interest, 0, 100, height, height*3/4+50);
    curveVertex(x, y);
  }
  endShape();

  for (int i=0; i< pnts.length; i++) {
    float x = pnts[i].x + xOffset;
    float y = pnts[i].y + height/4-80;

    float diam = 7;
    ellipse(x, y, diam, diam);
  }
}

void typewriteText(String word, float start, float finish){

  if (counter < word.length())
    counter++;
  text(word.substring(0, counter), start, finish, width, height);
}
Great job Alima. It’s nicely designed, and also reveals interesting info. I would guess the spikes for GoT and Sherlock are when new episodes/seasons happen. And that the less pointed spikes of Grey’s indicates there are more reruns being watched?