For my midterm project, I want to create a philosophical experience disguised as a dungeon crawler game. I am taking inspiration from The Legend of Zelda, to the point that I plan to use their assets. The experience will consist of two parts:
- Start of the game, which looks like something you’d find in old retro games from the 90s. You’re shown that you can move around and attack, and there are monsters aroud, so you conclude that you should attack and kill them.
- Eventually, you have to be killed by the monsters (a scripted death). Then the tone (and possibly artwork, art style) completely changes. You’re presented with a ‘path’ to the afterlive and by walking the path you have to confront all the lives you took. I essentially want to subvert the expectations of what it means to be a character in a retro video game killing other live in the game.
From the start, I realized that one of the most difficult parts would be creating a good and efficient animation system, where I would be able to animate entities in the game using sprites/spritesheets. Therefore this is the first major thing I implemented. This actually consisted of two major things: 1) a mechanism for loading assets (images, sounds, etc.), and 2) a way to animate game entities.
Loading assets
I wanted to make my mechanism for loading assets easily configurable, so that I could easily change and configure images, spritesheets, and animations without going through several places in the code. I came up with the concept of having a file, such as assets.txt, which contains all my assets. Each line in the file would look like one of the following:
Texture [TextureName] [FilePath]
Animation [AnimationName] [TextureName] [FrameCount] [Speed]
(Note: I plan to add a way to define sounds too. And I will explain how animations work in a bit.)
I am essentially giving a name to all assets so I can reuse and easily find them later when creating the game entities. At the same place I am configuring them.
In practice, the concept of having a file that tells you which other files to load (i.e. images) seems difficult to implement in p5, even using the preload function. Therefore I had to define the ‘assets’ file as a list of strings, which is functionally the same, although looks a bit uglier. Still, it accomplished what I wanted.
Moving on. I created an Assets class which handles the loading of all asset files and creating all animations, and I do these things in the preload function of p5. In the assets class, I have two maps, which I populate using information from the file:
- textureName (a string) –> p5.Image (the thing created when using loadImage)
- animationName (a string) –> Animation (a class I created and will describe soon)
When loading assets, I had to make sure that all textures are loaded before all animations, because every animation object has a texture which is passed to its constructor and whose properties are used immediately. To accomplish this order of loading, I had to use callback functions, but everything turned out alright in the end.
Animations
I created an Animation class which contains its name, its spritesheet (texture, i.e. a p5.Image), how many frames the animation should have before ending or repeating, and its speed (how often it should update). For example, a texture I used is the following:
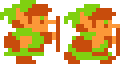
Then I create an animation that uses this texture (i.e. this texture is the animation’s spritesheet). The animation has a frameCount of 2 and a speed of 15, which means that it should change its state every 15 frames.
To draw animations I used p5’s feature to only draw sections of its spritesheet. I also store at which ‘cell’ I currently am in the animation in order to speed things up a bit.
Switching between animations based on state
I wanted my player character to use a different animation depending on whether they are standing, running, attacking, etc. To implement this I also store a state component in the player, which is just a string with one of these values: “stand”, “run”, or “attack”. I also store the direction the player is facing along each axis, which changes when they move. For example, if they are currently facing down, the facing would be a vector (0, 1). Facing up: (0, -1). Facing right: (1, 0). Facing left: (-1, 0). Using this, every frame, I update the animation to display.
The sketch
Future plans
With the asset and animation systems done, it is now very easy to add and use new textures and animations. I can now focus on creating the level, adding sounds/music, and most importantly creating the second component of the game.