Assignment 2 – Zentangle!

For this assignment of making an art piece using  Conditionals & Loops, I tried to combine the meditative aspects of Zen art with the precision of code, resulting in a unique and soothing digital art piece.

Concept

The concept of creating Zentangles is to relax, do art, appreciate the simplicity and be grateful for the opportunity and time to do the art! A Zentangle is usually drawing repetitive basic shapes & curves on a tile of paper or cardboard. For me, this tile was the p5.js canvas, the repetitive shapes – for loops I used and my code – the pencil!

The sketch(es)!

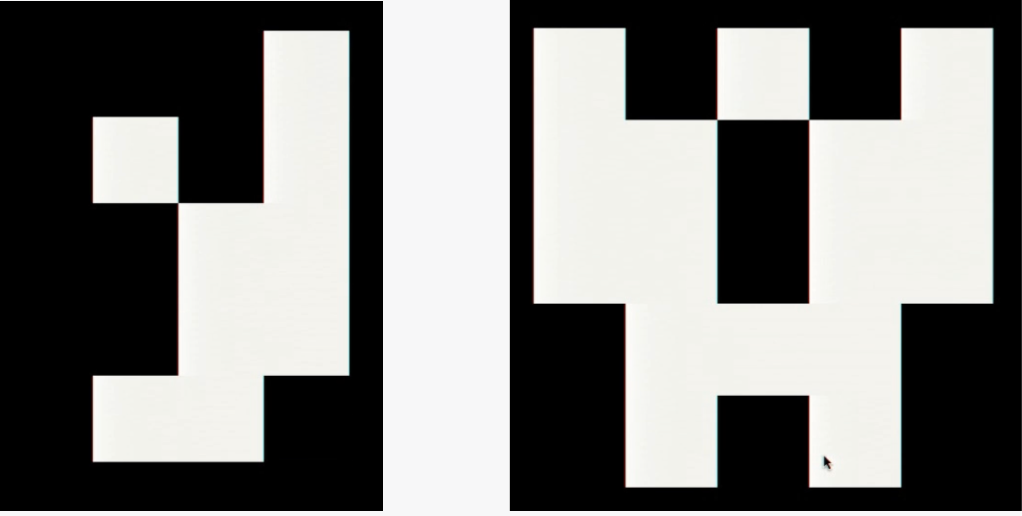
I began with a lot of thoughts and abstract ideas on how to go about doing this and made a countless number of edits, bigger or smaller shapes, darker or lighter mode,  time-based creation or mouse-interactive creation, corner positioned or center positioned, and I just couldn’t pick so I decided to give all of them to this blog post!

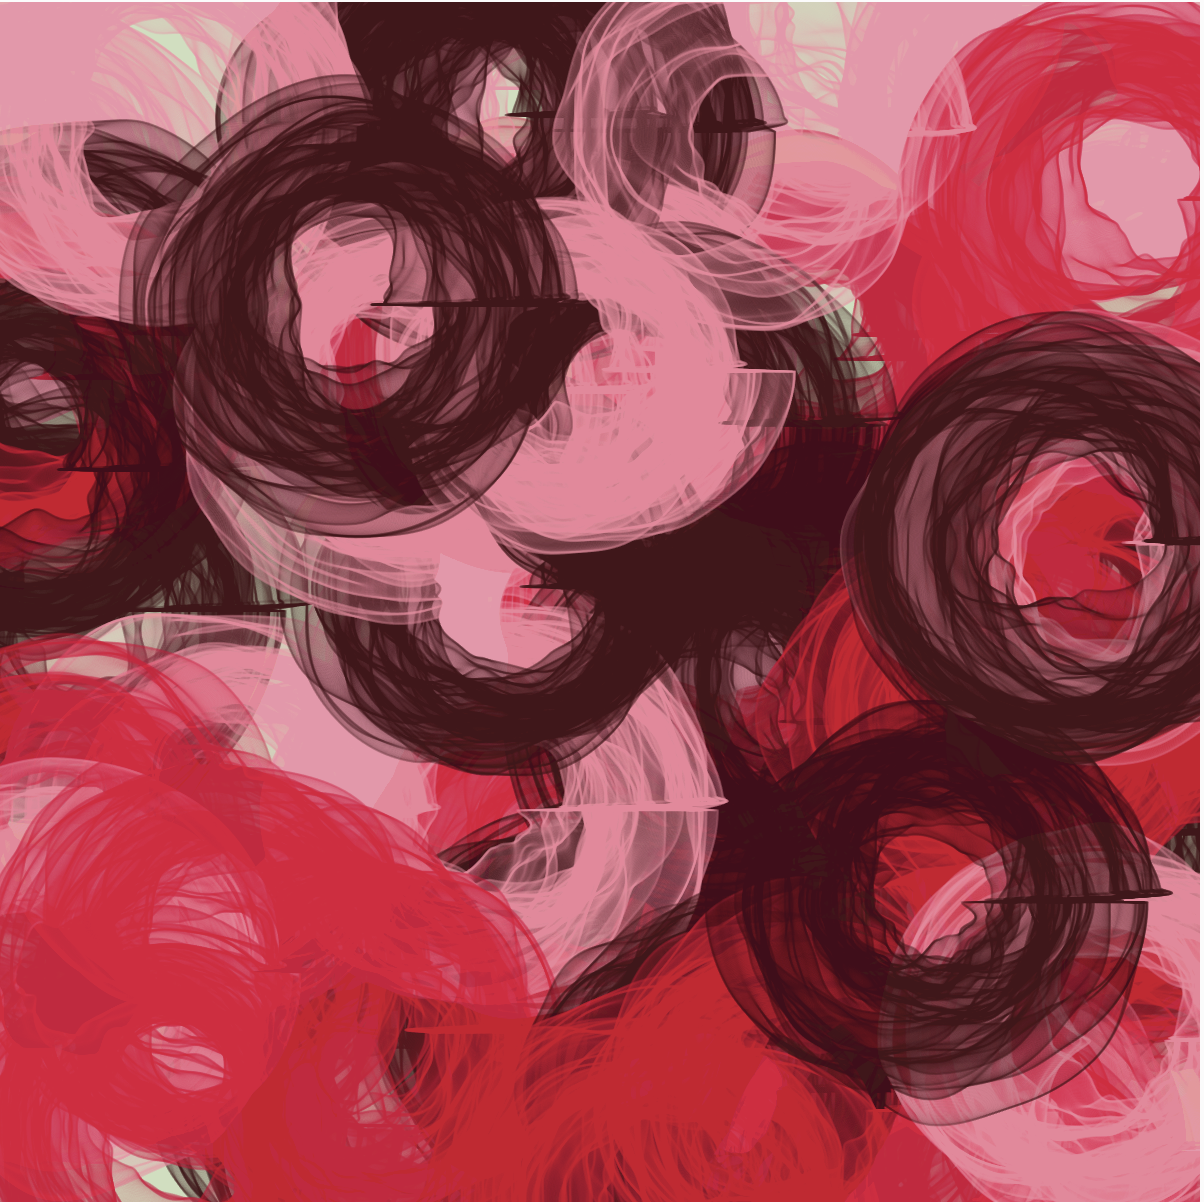
This one is the mouse-interactive one where, hovering over different positions on the Canvas enables different colors and shapes. To temporarily pause we can mouse click, keypress ‘s’ to stop or release mouse click to resume.

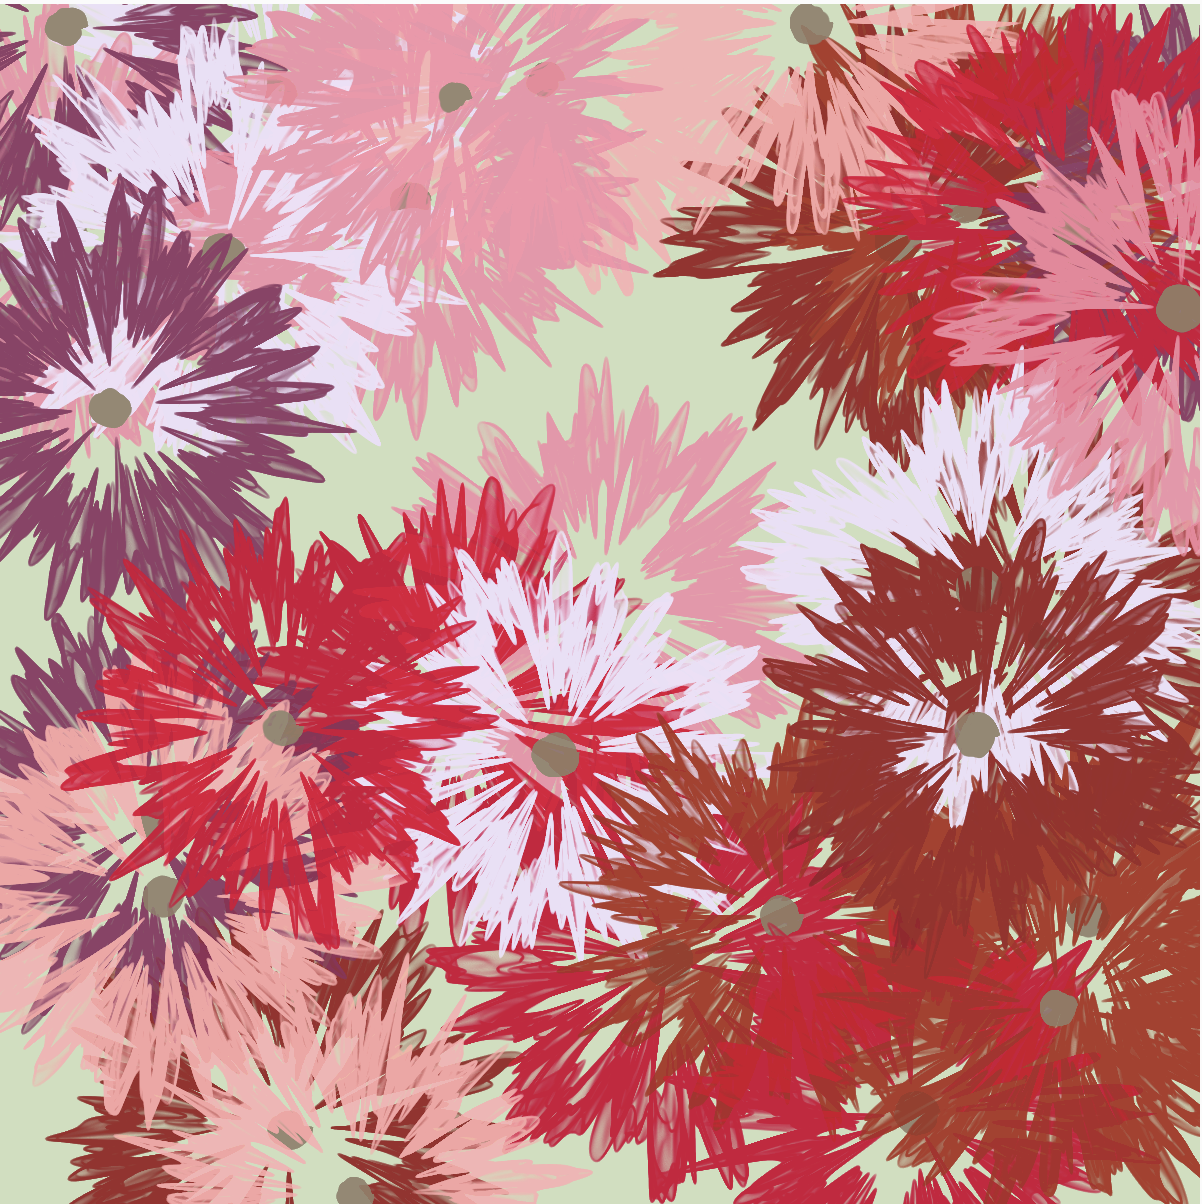
This one is time-based where it changes the color, radius and spacing based on a set time and frameRate. Mouse click pauses the loop by doing noLoop(), and releasing resumes the loop using loop().

.

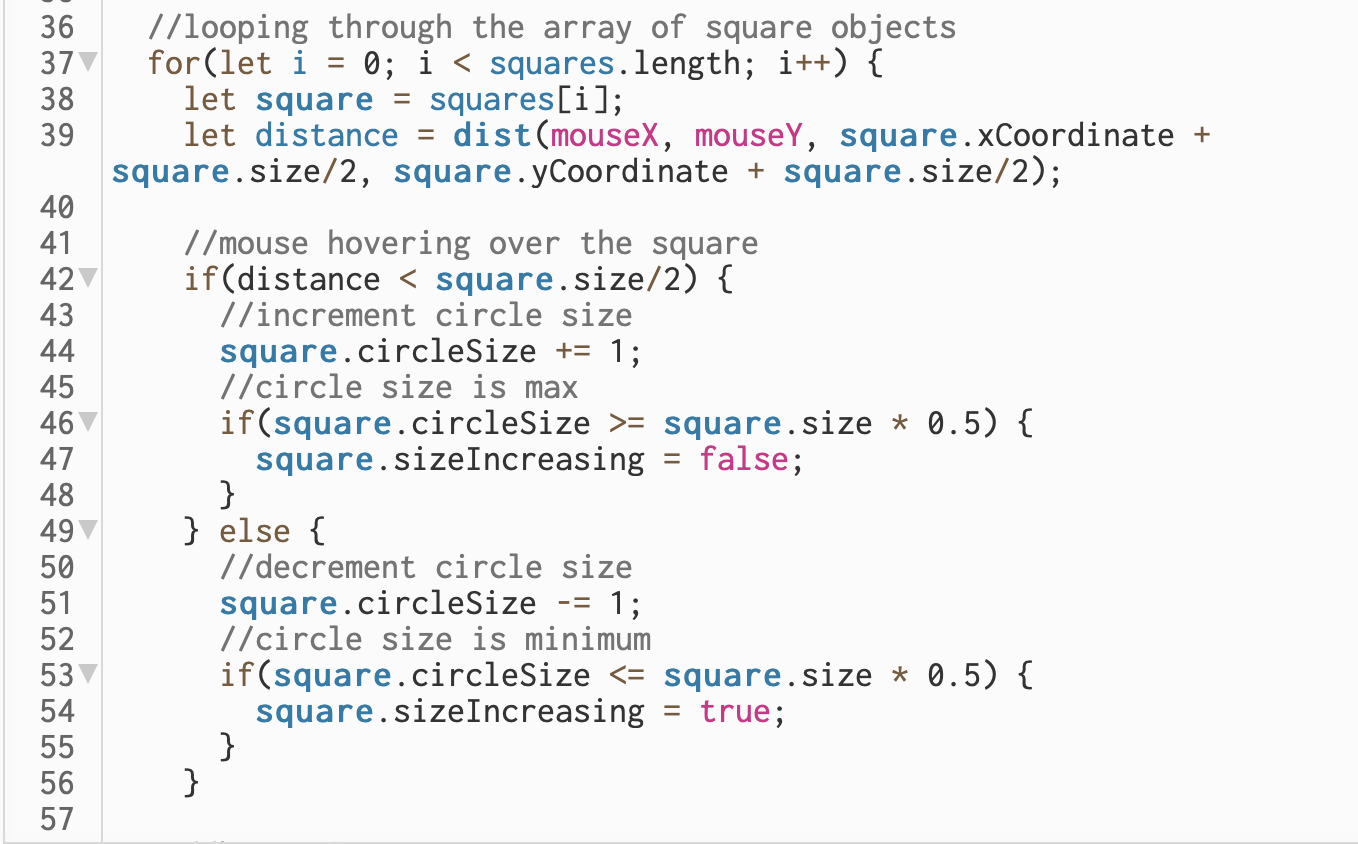
A part of the code that I’m happy about is the math and the logic that went into making the circles and squares rotate and move in a specific way. I used the map() function to re-map the range of values that the radius of the circle can take, translate() to modify the center, followed by creating a function to check the position of the cursor to adjust color and spacing. For the time based one, I just used the frameCount.

function makeArt(maxRadius,spacing,numCircles,minRadius)
  {
    translate(width / 2, height / 2);

  for (let i = 0; i < numCircles; i++) {
    let x = cos(angle) * spacing * i;
    let y = sin(angle) * spacing * i;
    let radius = map(i, 0, numCircles, minRadius, maxRadius);
    let outerRadius = maxRadius*1.25;
    rectMode(CENTER);
    rotate(angle);
    rect(0, 0, outerRadius * 1.5, outerRadius * 1.5);
    rect(outerRadius*1.5, outerRadius*1.5, 17, 17 );
    push();
    translate(x, y);
    rotate(-rectAngle);
    ellipse(0, 0, radius);
    pop();
  }

  angle += 0.01;
  rectAngle += 0.31;

Reflections 

I’m enjoying the assignments for this class and feel like I’m challenging myself to think more out of the box. This felt like the perfect first step towards balancing the ‘Order & Chaos’ like from the Casey Reas read! For improvements, I think I could add more shapes or curves and not just stick to the ones I did and maybe try to create a more complex mandala/zentangle!

Reading reflection – Week #2

Casey Reas opens his speech illustrating how it’s been largely the role of artists to maintain order in the face of nature. However, as he continues further showcasing his own and other artists’ works, I started to doubt this idea of his.

The work that captured my attention the most was “Signals”, created in collaboration with American designer Ben Fry in 2011. This artwork showcases protein communication within a cancer cell, where each graphical cluster represents signals between networked proteins in a cancer cell as they change over time. Individual arcs represent signals from one protein to another; arc size corresponds to signal magnitude. Professor Michael Yaffe’s laboratory provided the data. Here is the artwork in question:


Reas’ approach to data visualization as a creative expression presents important questions regarding how data representation through art affects different viewpoints. “Signals” may convey a feeling of the complicated conflicts taking place within cancer patients’ bodies, perhaps demystifying a difficult biological process and establishing a connection to their own health journey. This type of visualization can also be a significant tool for scientists and researchers in acquiring insights and developing ideas on cellular behavior.

However, when ordinary people without a scientific background are considered, the possibility for bias and misinterpretation emerges. Such simulations’ aesthetic appeal may unintentionally romanticize or oversimplify the complicated realities of diseases like cancer. It is critical to recognize that, while art can improve our understanding, it can also distort it.

To conclude, it is critical to investigate the various perspectives on this junction of art and science. How do patients, scientists, and members of the general public react to data-driven art? What are the ethical and educational consequences of visually representing complicated scientific concepts? These issues emphasize the diversity of data visualization in art, as well as the importance of taking a balanced approach when understanding and appreciating these creative interpretations of knowledge.

Reading Reflections – Week 2!

Randomness, Random numbers, Coin flipping – math class? The only time I’d hear this combination of words was in a math class. Now, adding Art to it, I’ve always heard that you should let your art flow instead of binding it until it ends up creating something satisfying and my perspective broadened significantly after watching Casey Reas’s talk on Chance operations.

However, What intrigues me more than the thought that goes into making random generative art or the experimentation involved in it, is the viewer’s experience and its subjective nature.Art, by its very essence, is subjective, and everyone brings their unique perspective to the act of viewing it. When randomness is introduced into the equation, this subjectivity intensifies. During the talk, I found myself having different interpretations for each demo piece he presented.

Taking, for example, the ‘Fractal Invader.’ While the idea of creating art based on a coin flip is amusing in itself, what truly fascinated me was how my mind suddenly began to perceive people, faces, and complete figures within the artwork. Like this one that looks like a man represented by these black and white squares.

It made me wonder why our minds often deceive us into thinking something is incomplete, and yet, duplication somehow makes it appear whole. Why do we read into it when it’s duplicated? I like that recurring appearances of elements & patterns can create a sense of rhythm and harmony within a particular piece of art.

Introspecting on Reas’s discussion of randomness in isolation, particularly his mention of “the space between order and chaos,” I realized that even this concept is subjective. It left me curious on a slightly different front. How can we determine, to what extent randomness conveys which specific emotion? because just one visual is enough for our minds to start an endless stream of thoughts related to it. I’m interested in exploring further on two aspects: understanding the balance between order and chaos and finding effective ways to express emotions through randomness in the viewer’s experience of generative art.

Coding assignment – Week #2

For this week’s assignment, I wanted to experiment with two-dimensional arrays. Here is the outcome of my experiment:

I achieved the two-dimensional array structure by using nested loops (a loop within a loop) to arrange the ellipses in an organized manner. The outer loop, controlled by the variable ‘x’, is responsible for iterating through the columns of the grid. It starts with an initial value ‘spacing/2’ and increments by the value of ‘spacing’ in each iteration. This ensures that each column is spaced evenly from the previous one. Inside the outer loop, there’s an inner loop controlled by the variable ‘y’. This inner loop iterates through the rows of the grid, just like the outer loop does for columns. It also starts with an initial value ‘spacing/2’ and increments by ‘spacing’ in each iteration, ensuring that each row is spaced evenly from the previous one.

// creating a 2D array to achieve a board like structure
  // iterating through columns. setting the initial x position from spacing/2 and y position from spcing/2 to make all the ellipses on the board appear full.
  for (let x = spacing/2; x < width; x += spacing) {
    // iterating through rows. 
    for (let y = spacing/2; y < height; y += spacing) {
      // generating a noise value n that depends on the position of the ellipse and changes over time due to t
      let n = noise(x,y,t);
      // mapping the noise value from the range [0,1] to the radius value in the range [0, 25]
      let radius = map(n, 0, 1, 0, 25)
      noFill()
      // adding additional animation that makes the ellipses with radius <10 to fill
      if (radius < 10){
        fill(255)
        ellipse(x, y, radius)
      }
      else{
        stroke(255)
        ellipse(x, y, radius)}
    }
  }
}

Besides the 2D array, another key element of my sketch was the Perlin noise. Perlin noise, named after its creator Ken Perlin, utilizes an algorithm that generates a sequence of pseudo-random numbers in a way that maintains a natural sense of order. In this sequence, each successive number is closely related in value to the one preceding it. This approach results in a “smooth” transition between these numbers, giving rise to a more organic and less chaotic visual effect compared to pure randomness. In my case, Perlin noise generates variations in the ellipse sizes, making the transitions between the different sizes appear smooth and organic. The Perlin noise value is calculated based on the position of each ellipse on a 2D grid (x and y coordinates) and changes over time due to the ‘t’ parameter.

// generating a noise value n that depends on the position of the ellipse and changes over time due to t
      let n = noise(x,y,t);

After looking at the sketch for a while, I realized that it reminded me of microalgae. The visual output of the sketch sort of resembles the view of microalgae under a microscope. It also captures the organic growth pattern due to the Perlin noise, mimicking the natural variation seen in these microorganisms. While my sketch is rather abstract, I believe it conveys the idea of a living system evolving and changing over time, which happened to be a nice accident.

CSIRO ScienceImage 10697 Microalgae.jpg
By CSIRO, CC BY 3.0, Link


week 2 – reading reflection

My favorite aspect of Casey Reas’ talk was the way he seamlessly wove together the overarching themes of order, chance, and symmetry within the realm of digital art. Right near the beginning, he piqued my curiosity with a thought-provoking statement about the creation of art that is ‘artificial but possesses an organic quality.’ He displayed some of his initial pieces – the first in which he relinquished These pieces, born from a collaboration between his artistic intent and the unpredictability of chance, seemed to possess a unique and mesmerizing sense of nature.  Later on, towards the end, he displayed some art pieces which were created with the intention of as much order and symmetry as possible, saying that they had been criticized as ‘having no humanity’. These contrasting statements made me think of nature and the world we live in, which is neither entirely organized nor thoroughly chaotic. Nature is a sort of organized chaos, where natural elements – from the orbit of the sun to the migration of birds – follow a sort of fixed geometry, but there’s enough distortion so that it doesn’t appear eerie.  I think this is why interactive media art, particularly geometric and generative art appeals to me incredibly: it captures the very essence of nature, the one that is capable of locking in one’s gaze for a long moment.


Casey Reas

Reas’ comments about chance in art also struck me greatly. The calculated randomness gives the illusion of unexpected art that keeps becoming itself, belying the computational nature it has underneath.  As Reas explained, the incorporation of chance doesn’t diminish the artist’s role but rather extends it into a realm where the boundaries between intention and serendipity blur. It’s akin to setting up the conditions for creativity to flourish, allowing the elements to interact and shape the final composition organically. In this way, the artist becomes a collaborator with the forces of randomness, enabling art to unfold with a vitality that mirrors the dynamic nature of life itself. This concept challenges conventional notions of authorship and control in art. It suggests that, in the digital age, artists are not just creators but also curators of algorithms and data, fostering a dialogue between human imagination and the machine’s computational abilities.

Assignment 2 – Loops

I thought Mondrian art was pretty fun to look at, and I liked the geometric simplicity of it, and so I thought of making a simple p5.js program with loops to try to mimic the look. However, I somehow also thought of sliding puzzles, where there’s a grid of squares and there’s one empty cell that other pieces can be slid into. I thought it might be fun to combine the two of them, and I ended up creating a little animated piece that runs on its own randomly.

    • A highlight of some code that you’re particularly proud ofI came across a problem where I wanted to randomly select 3 indexes in an array without any duplications, and it was something that I had to stop to think about as just randomly selecting elements sequentially could run the risk of the same index being selected twice. My code removes the selected index from the array before randomly selecting again.
      // make sure that there are always 3 colors, and we dont select same index for two colors
      let redBoxIndex = random(listOfNums);
      let index = listOfNums.indexOf(redBoxIndex);
      listOfNums.splice(index, 1);
      
      let blueBoxIndex = random(listOfNums);
      index = listOfNums.indexOf(blueBoxIndex);
      listOfNums.splice(index, 1);
      
      let yellowBoxIndex = random(listOfNums);
      index = listOfNums.indexOf(yellowBoxIndex);
      listOfNums.splice(index, 1);
    • Embedded sketch

  • Reflection and ideas for future work or improvements

    I feel that this piece did not meet my own expectations compared to my Hello Kitty self-portrait I did for last week, but I thought it was my idea that was weak rather than the execution. It’s satisfying to watch the pieces move, especially when a coloured square moves, but I’m not too sure what the entire point behind this project is.

assignment 2: loops

I tried recreating The Strokes’s “Is This It” album cover for this project. Here’s the reference picture:

The album originally had a different cover, but some time after the first batch of vinyls had already been pressed, frontman Julian Casablanca called his product manager saying he found “something even cooler.” The record label obliged, and later productions of the album appeared with a picture from CERN’s Big Bang experiments in the 70s. This new image shows tracks left by subatomic particles in a bubble chamber. As each charged particle moves through superheated liquid hydrogen, it leaves a trail of “bubbles” as the liquid boils in its wake. The trajectory of their paths can then be analyzed to identify the particles. For example, two particles with opposite charges would travel in opposite directions, because of how they interact with the magnetic field in the chamber.

This is how I approached the problem of animating these particles: I use a for loop to generate some sets of random values (within defined limits) for initial coordinates, radii, angles, and stroke weights. Each set determines the initial frame for each particle. A heavier particle, such as an alpha particle, would have a smaller radius than a smaller particle, such as an electron, because the heavier particle moves slower, which is why each track needs to have a different radius. They can also curve in one direction or the other as they travel, depending on the charge they carry. So the angle needed to be randomized between negative and positive values.

// array to store trail "head" information
for (let i = 0; i < 20; i++) {
  let x = random(width);
  let y = random(height);
  let weight = int(random(1, 5));
  let angle = random(-TWO_PI, TWO_PI);
  let radius = random(1, 10);
  particleArray.push({ x, y, weight, angle, radius });
}

Every time the draw() function is called, I offset the values in each set by a little, to define the new position for a particle, and then draw a line joining these two coordinates. The for loop in this function goes over each “particle” in the array and gives it a new position to be at. When the frame refreshes, this happens all over again.

There’s a lot more that’s going on in the album cover, and I’m trying to make my artwork something more than just lines on a yellow background. So far I’ve only added some grain to the canvas. I can also make out some drop shadow in the original picture, but it’s a little complicated to achieve that effect with code. Since the arcs are comprised of infinite small lines, I don’t have the shape of the full arc at any point in time, so I can’t add drop shadow to the whole arc. But if I add shadows to each little line, the shadow falls not just on the background but on neighboring lines too, and that makes the arc look disjointed. I just added some noise to the coordinate calculation so that the arc look just slightly more realistic and not completely smooth.

I think the trickiest part was figuring out the logic for how to connect each coordinate. At first, I was trying to use ellipses instead of lines, and wrote some more complicated logic to connect them in an arc, but I did something wrong so it would connect points of different arcs, shown below. It looks cool in its own right, but it just wasn’t what I was trying to do.

reading reflection: week 2

Casey Reas opens with a traditional understanding of order and chaos. “Chaos is what existed before the creation, and order is what was brought by a God or gods into the world.” More generally, then, chaos is the natural state of things, and it is the hand of a higher being that brings order to chaos. But I struggled to meet Reas at his point of departure: is a higher order of being inherently correlated with higher capacity for order? God might have set the planets into motion, but their orbits remain subject to the unbound randomness of the universe. A meteor could very well strike Pluto today and move it off course by a few degrees. Would that still be God’s doing? I think that if the order brought on by even a God is not impervious to the seemingly ubiquitous and natural chaos of the universe, then even the little order we observe is only an isolated fragment of the bigger piece in chaos, meaning there is always net chaos in the universe.

Reas’s whole premise of incorporating randomness in art is to me an expression of the general human conceit. We like to think of ourselves as beings capable of creating and maintaining order. But then in the face of the infinite chaos of the world we live in, we go on and generate artificial randomness, in art and what not, as if by adding just a bit of chaos into the grand sum, we can rise to the ranks of the forces behind the universe. Take Keith Tyson’s sculptures for example, as discussed in the talk, and which reminded me of Mondrian’s paintings. Tyson tried his best to arrive at pure chaos, by allowing the shape and form of his sculptures to be dictated by dice rolls. But then Reas mentions that “he sent an algorithm to a gallery, which was then fabricated.” By incorporating an algorithm, basically a set of rules, in the manufacturing process, Tyson succumbs to his mortal fate, that of a creature of order, but still below the highest power in the universe, chaos.

Week 2: A Simple Work of Art

Concept:

Initially, I began with an uncertain direction for my generative art piece, starting with a simple sketch that lacked a clear vision.

And then I added some texts.

As I experimented with shapes and transitions, I stumbled upon the idea of creating an inspiring quote for myself. At the time, only three weeks into the semester, I was juggling numerous responsibilities and wanted this artwork to serve as a motivational reminder to persevere during moments of overwhelm.

Highlighted Code:

I am proud of my implementation of a dynamic gradient background. It was a challenging task to control color transitions at specific interpolation points to ensure a smooth shift between soft and soothing colors.

// A function to draw the background
function drawBackground() {
   // initialize the colors of the gradience
  begin = color("#FFC3A0"); 
  finish = color("#A4C3E1"); 
  
  // adjust the colors
  let r = map(sin(angle0), -1, 1, 180, 255); 
  let g = map(cos(angle0), -1, 1, 180, 255); 
  let b = map(sin(angle0 * 2), -1, 1, 180, 255); 
  begin = color(r, g, b);
  
  angle0 += 0.05;

  // loop through the canvas height from top to bottom
  for (let i = 0; i < height; i++) {
    // calculate the constant range of change based on the current vertical position
    let change = map(i, 0, height, 0, 1);
    
    // to make a smooth color change, interpolate between the starting and the ending colors
    let color = lerpColor(begin, finish, change);
    stroke(color);           // set the color for the current row
    
    line(0, i, width, i);     // draw a horizontal line with given color stroke
  }
}

Also, I’m satisfied with the overall code structure, which incorporates the use of global and local variables, functions, and an object-oriented programming design.

Embedded Sketch:

Reflection and Ideas for Future Work:

For the next projects, I would aim to enhance the visual appeal of my artwork by planning the design more meticulously before diving into implementation. This thoughtful approach will likely result in a more meaningful and aesthetically pleasing final product. Also, I want to introduce more interactivity to make the artwork more engaging and fun for the audience.

Week 1 HW) Self-Portrait

For me, while it may sound funny, getting the ‘artistic part’ of the project right was the biggest challenge. I had the picture of myself in my head, but I lack the ability of expressing that artistically (both by hand-drawing or code). Accepting the self I am, I decided to try to draw as many things in the portrait so that it would be good practice for me to try drawing different things.

The concept was to show how the sun in Abu Dhabi gives all of us a tan as time goes by. I wanted to make it interactive, so I made the skin colour change depending on the position of the user’s mouse.

//Outside (red part)
beginShape();
noStroke();
vertex(p1.x, p1.y);
bezierVertex(p1.x, p1.y, 310, 36, p2.x, p2.y);
bezierVertex(p2.x, p2.y, 345, 76, p3.x, p3.y);
bezierVertex(p3.x, p3.y, 360, 100, p4.x, p4.y);
bezierVertex(p4.x, p4.y, 320, 134, p5.x, p5.y);
bezierVertex(p5.x, p5.y, 295, 145, p6.x, p6.y);
bezierVertex(p6.x, p6.y, 245, 70, p7.x - 10, p7.y);
bezierVertex(p7.x, p7.y, 235, 80, p8.x, p8.y);
bezierVertex(p8.x, p8.y, 275, 50, p1.x, p1.y);
fill(250, 95, 85);
endShape();

As for the code, I want to highlight more on the trouble I had as there’s nothing too complicated in my project. The outside layer of the sun is drawn by bezierVertex()- I had to put in multiple different coordinates until it seemed okay. I personally thought this was a very inefficient way of doing it. Also, it was hard to exactly get it drawn how I wanted it to be. I spent quite a lot of time looking for different methods, but wasn’t able to find one. I would love to see if anybody has suggestions regarding this.

I think for my future projects, I would try to draw a grid by hand and figure out the aesthetics first. I saw a few people’s blog posts and saw how the image they wanted to draw was set first and the code specifically followed how each elements were drawn (the angles, the coordinates, etc). I think maybe if I take that step, the aesthetics could be better.