Assignment 4: Data Visualization of World Cities

Inspiration/ Concept

For this assignment, I opted for data visualization. During the pre-coding phase, I stumbled upon a GitHub repository consisting of numerous datasets. The data has been scraped from Aneki World Cities site and comprises information on 10, 567 unique cities (a total of 170 countries). Thus, I cloned the repository and used its CSV file as my primary data source. Using the CSV file, I have displayed a simple world map and plotted all the cities and their information on the map; furthermore, inspired by last week’s reading, the project intends to provide a level of user interaction to receive additional information on each city.


Code

The project was relatively simple in nature. Before I started writing code, I divided the project into three primary sections, where each functionality depends on one or more than one functions. 

  1. Data Processing
  2. Data Representation
  3. User Interactions

Data Processing

This is the building block of the entire project. In this section, using the inbuilt preload() function of p5.js, the dataset is loaded into the system (in a variable named ‘table’), and using one single for loop (thus, the time complexity is maintained on a linear scale), data are extracted from each row and stored in their respective arrays. For instance, when the program goes through line one, names of countries and cities are stored in country_arr[] and city_arr[] arrays respectively, whereas latitude, longitude and elevation data are stored in lat_arr[], long_arr[] and elevation[] arrays respectively. 

Then, the findMinMaxVal() function is used to find the minimum and the maximum values for each numerical element (longitude, latitude and elevation). 

function findMinMaxVal()
{
  for (let r = 0 ; r < num_rows; r++)
  {
    // If latitude information in the current row is greater than the value stored in max_lat, update max_lat
    // Similary for longitude and elevation
    if (table.getNum(r, lat_col) > max_lat)
      max_lat = table.getNum(r, lat_col);
    
    // If latitude information in the current row is lower than the value stored in min_lat, update min_lat
    // Similary for longitude and elevation
    if (table.getNum(r, lat_col) < min_lat)
      min_lat = table.getNum(r, lat_col);
    
    if (table.getNum(r, long_col) > max_lat)
      max_long = table.getNum(r, long_col);
    
    if (table.getNum(r, long_col) < min_long)
      min_long = table.getNum(r, long_col);
    
    if (table.getNum(r, elevation_col) > max_elevation)
      max_elevation = table.getNum(r, elevation_col);
    
    if (table.getNum(r, elevation_col) < min_elevation)
      min_elevation = table.getNum(r, elevation_col);
  }
}


As seen in the code, the program loops through individual arrays mentioned above and use if-conditions to determine if the values being read are greater or less than the values stored in the variables — if the condition is true, the variable is updated and the program continues to the next iteration. For example, in the first conditional, the program checks if the latitude currently being read is greater than the maximum latitude recorded so far; if there is a new maximum (i.e. the condition evaluates to true), max_lat is updated. In the same way, the function checks for minimum and maximum values for longitude, latitude and elevation data. 

After going through the entire CSV file, the global variables (max_lat, min_lat, max_long, min_long, max_elevation and min_elevation) represent the maximum and the minimum values of their own types. 

Finally, using an additional for-loop, the program iterates through each array, maps the value onto a new range (such that it is representable on the canvas of size height by width) and stores them in new arrays. For instance, elevation is mapped to a new range from 0 to 100 and the modified value is stored in the elevation_arr_mapped[] array, longitude is mapped onto a new range of 10 to width divided by 1.2 and so forth. 

Data Representation and User Interactivity 

All the data processed in the first step is used here to graphically represent the data. I included all the code for this step in the draw() function. Although it makes the overall program more processing-intensive, it assists in the next step (which is user interaction). Thus, each line of code in this step is refreshed a certain number of times every second. 

At first, the program checks if the elevation is higher than 80% or not – thus dividing the entire dataset into two halves. Then, different fill() colors are selected for each half — red color is used for the former and green for the latter. 

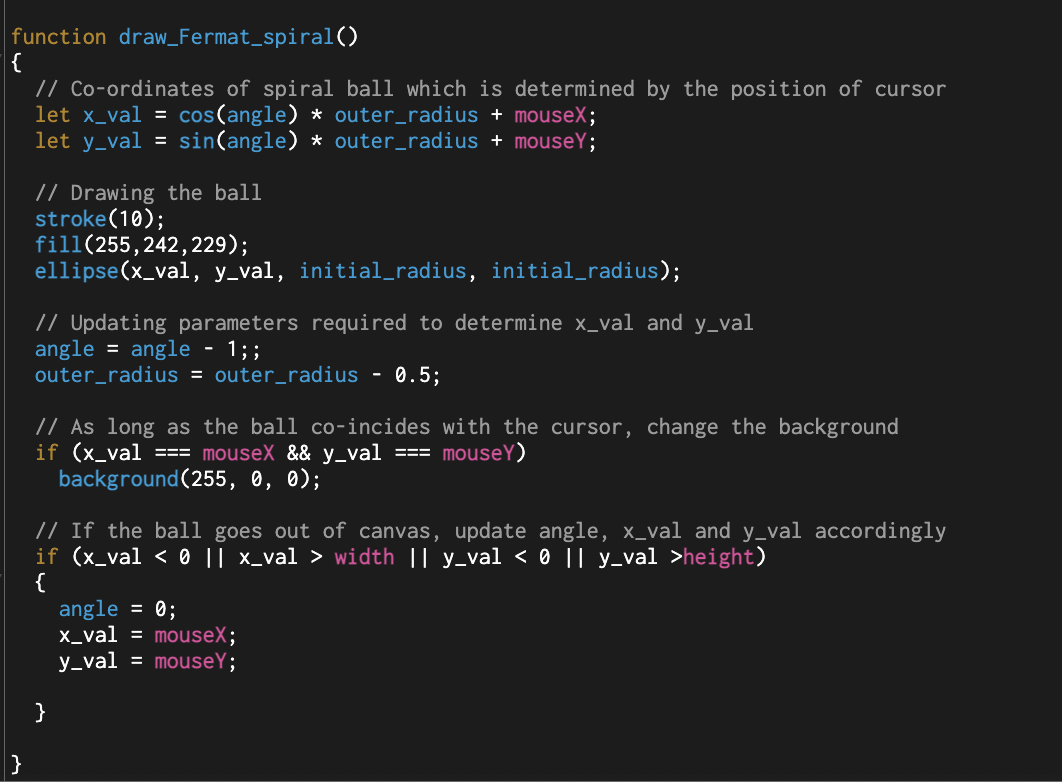
Then, the program checks if the cursor is close to any x and y positions of cities (x position is analogous to longitude and y position to latitude). If the distance between them is less than 0.5 pixels, the radius of the circle is increased to 20 and the fill color is changed to purple; otherwise, the radius is kept at 5 and the fill color is either green or red. 

// Store x and y position for each city using mapped arrays, where longitude = x and latitude = y
let point_x = long_arr_mapped[i];
let point_y = lat_arr_mapped[i];
let circle_radius;


// HOVER EFFECT
// find the distance between cursor and each city
let distance = dist(mouseX, mouseY, point_x, point_y);

// If the distance is less than 0.5, call hover_info() function, increase circle radisu and use different fill color
// Otherwise, lower the circle radius and use green as fill color
if (distance < 0.5)
{
  fill("purple");
  circle_radius = 10;
  circle(long_arr_mapped[i], lat_arr_mapped[i], circle_radius);
  
  hover_info(i);
}
else
{
  circle_radius = 5;
  circle(long_arr_mapped[i], lat_arr_mapped[i], circle_radius);
}


Afterward, the inbuilt circle() function is called using the aforementioned parameters and a map of the world, with city information, is displayed on the canvas. 

The user-interactivity involves a hovering feature on the canvas. If the user wants to receive more information about a city, the cursor can be moved above a particular city and as soon as it is close to the desired location, the dot pops up (i.e. its radius increases as described earlier) and a text box appears displaying its name, location and elevation. The functionality is implemented using a function titled ‘hover_info()’ which is called inside the draw() function. It takes the index of a city as a parameter and the said index is used to locate values (city name, country name and elevation data) located at the position “index” in city_arr_mapped[], country_arr_mapped[] and elevation_arr_mapped[] arrays respectively. 

function hover_info(index)
{
  // Text Settings
  textSize(20);
  textAlign(LEFT);
  textFont(myFont);
  fill("white");
  stroke(2);
  
  let text_box_pos_x;
  let text_box_pos_y;
  
  // Conditionals to ensure text stays within the canvas. 
  // If cursor is to the extreme right, reset x and y positions for text accordingly
  if (mouseX < (w/2))
  {
    text_box_pos_x = (150);
  }
  else
  {
    text_box_pos_x = (w - 350);
   
  }
  text_box_pos_y = (40);
  

  // Call text() to display the required information
  // Displaying just the name of the country and its elevation
  text("Location: " + country_arr[index] + "\n" + "Elevation: " + elevation_arr[index] + " m", text_box_pos_x, text_box_pos_y, w/4);
    
}


Reflection

The project involved straightforward coding; however, the part that took a significant amount of time was finding an appropriate dataset. Since the dataset found either lacked longitude-latitude information or elevation data, research took a noticeable amount of time. I was initially planning to plot information on at least 30,000 cities, but finding enough data was another nuisance, as a result, I had to settle for 16,000 rows (approximately). Thus, one improvement could be finding a fresh dataset that covers more cities. 

Similarly, the dataset seems to be concentrated on a particular location. Consequently, while hovering over each location, different points overlap and the text being displayed seems buggy — along with the draw() function, the hover_info() is also called 24 times every second, thus removing this bug proved to be a task. In the future iteration of this project, an appropriate algorithm can be developed to either remodify the hover_info() function or to opt for other modes of interactivity such as data input using text input area and using it to display additional information on each city. For now, the cursor needs to be kept steady as each circle has a radius of 5 pixels to avoid clustering of points. With more investment of time, the project can be further polished.  

For better interactivity, zoom in to differentiate between points and use full-screen mode using this link here.


That said, this was an interesting project. I learned a lot of back-end things apart from the actual programming – whether it be going through countless dataset collections or refining my code to make it more interactive. Overall, I am happy with the final outcome, and I look forward to working on my research as well as my coding skills. 


Assignment 3: Object Oriented Generative Art

Inspiration

For this assignment, I have replicated the renowned particle physics experiment called ATLAS, the largest general-purpose particle physics experiment at the Large Hadron Collider (LHC) (at CERN in Switzerland). The scientists at LHC use the Higgs boson (an unstable particle that decays into stable particles) to search for dark photons. The image below (Image 1) is related to an experiment completed on May 18, 2012, where the ATLAS detector records a Higgs boson decay; the second image (Image 2) is also related to a similar experiment. Thus, in this project, I have created an animated simulation of the experiments mentioned above — it is an amalgamation of two images shown.

Image 1 – Higgs decay to four electrons recorded by ATLAS in 2012. Source: atlas.cern
Image 2 – Higgs boson decay. Source: atlas.cern

Code

In addition to p5.js’ two default functions (draw() and setup()), the project comprises of one additional function and four classes.

  1. OuterShell class
  2. Circle class
  3. Particle class
  4. Pattern class 
  5. Draw_beam function

OuterShell Class

I began writing code for the project by completing OuterShell class at first. It is a class that represents the outer rectangular-shaped structure of the lateral cross-section of the collider shown above. The class depends on five attributes and one display method that draws rectangle(s) using the information fed into its attributes. The display method makes use of two transformations — translation and rotation — in order to make the rectangles rotate around a fixed point (here, it is the center of the canvas). Thus, when objects are instantiated, stored and displayed using this class, it appears that a set of inclined rectangles are revolving around the core of the detector.

// Reset the canvas using push() and pop()

push();
translate(canvas_w / 2, canvas_h / 2);                // Move the origin to the middle of canvas
rotate(ANGLE);                                        // Angle of rotation                               
fill(random_r_val, random_g_val, random_b_val);       // Fill the shape
noStroke();
rect(this.x, this.y, this.length_, this.width_, this.roundness);         // The fifth parameter determines the roundness of edges
pop();

ANGLE += 3;

Circle Class

The Circle class is relatively a simple implementation, as it consists of three attributes and one display method. The primary challenge here was to implement fill() function on each circle individually. Even though I used multiple fill() functions, only the final color would cover the largest circle on the canvas, and since I planned on using different fill colors for different circles, the use of if-conditionals to manually specify RGB values helped me solve this problem. Here, I used radial measurement to determine which RGB values go with which circle.

Later, four concentric circles are instantiated in the setup function. In doing so, a list of radii is stored in a list and looped through using another for-loop to create and store circles in their corresponding list. Finally, in the draw function, using another for-loop, the display() method is called on each circle in the list and is displayed on the canvas.


Particle Class

This class is similar to the OuterClass class in terms of its display() method, yet a lengthy one. It depends on three attributes and two methods. The first method, titled display(), is used to create a set of red particles (ellipses) that revolve around the core, which has been done using a similar algorithm used in the OuterShell class, whereas the second method, titled disperse(), is related to free-flowing particles (ellipses) on the entire canvas. The idea for the disperse() method is such that there are particles around the detector, in reality, thus I implemented this method to represent the existence of different kinds of particles in and around the detector. Here, I update the x and y coordinates of free-flowing particles inside the disperse() method, which provided mobility to individual particles.

// METHOD 2

disperse() 
{
  stroke("white");
  ellipse(this.x, this.y, random(0, 0.5), random(0, 0.5));
  
  // Update x and y values simultaneously
  this.x += this.speed;
  this.y += this.speed;
}

Pattern Class

This is by far the most interesting and tedious section of the project. Initially, I was planning to draw either spiral or arc-related designs, but I went with a new pattern to differentiate this project from previous assignments.

The class depends on three attributes and consists of a single display() method. Here, I used one of the attributes (count) to determine the number of lines drawn. And, using a combination of for-loop and line() function, with some basic trigonometric calculations to determine two points of a line, a number of linear segments are drawn inside a circle of radius 80 (modifiable). Since its objects are instantiated and displayed inside the draw() function, which is called a certain number of times in a second, it appears as if the lines are mobile in nature.

display() 
  {
    let radius = 80;                              // Radius whichin which lines creation is confined
    
    push();
    translate(canvas_w / 2, canvas_h / 2);       // Move the origin to the middle of canvas

    // Loop execution determined by this.count attribute
    for (let i = 0; i < this.count; i++) {
      let ANGLE1 = random(0, 2 * PI);            // Angle value that determines x and y coordinate of Point 1
      let point_1_x = sin(ANGLE1) * radius;      // x-cordinate of Point 1
      let point_1_y = cos(ANGLE1) * radius;      // y-cordinate of Point 1

      let ANGLE2 = random(0, 2 * PI);            // Angle value that determines x and y coordinate of Point 1
      let point_2_x = sin(ANGLE2) * radius;      // x-cordinate of Point 2
      let point_2_y = cos(ANGLE2) * radius;      // y-cordinate of Point 2
  
      strokeWeight(0.4);
      stroke(234, 148, 14);
      
      // Drawing line from point 1 to point 2
      line(point_1_x, point_1_y, point_2_x, point_2_y);
    }

    pop();
  }


Draw_beam function

Finally, to add to the final effect and incorporate user interaction, this function is implemented so that a random number of lines (in a range of 3 to 7 inclusive) that lead to the core of the detector are drawn. These lines imitate the actual beam of light that is radiated inside a reactor when particles collide with each other. Thus, when the user clicks on the canvas, different colored lines are generated and displayed on the screen. The function makes use of if-conditional statements to pick a certain color for each line.

Here, the frameRate() function’s argument can be modified to control the speed of the canvas element. If a lower frameRate is used, the output may seem laggy. However, for this assignment, frameRate is set to be “5”.

Reflection

Overall, I am satisfied with the final output. I was prepared to start working on this project on Friday, but the brainstorming phase got an unforeseen amount of extension. Thus, I believe, I invested a good portion of time in planning. Also, since the project is divided into fixed classes and dependencies are handled separately, I am happy with the project.

  1. If I get to improve or re-work this particular project, I will focus on the following ideas and technicalities to further improve the final output:
    When the user clicks on the canvas, lines are drawn from random particles to the center of the core. However, with a little bit of work, it can be modified so that when the user clicks on a particular particle, a line will be drawn connecting it and the core of the reactor.
  2. Similarly, using 3D libraries, an extra dimension can be added as a result when the mouse is clicked, the canvas spans 360 degrees to give a thorough animation of the simulation.


Assignment 2: Generative Art using Loops

Concept

This assignment was inspired by the piece from ‘The Cubic Limit Series’ by Manfred Mohr. Coded in FORTRAN IV, the short film depicts a ‘catastrophe point’ when a rotating cube is dissolved into a set of abstract lines. Thus, I was awestruck by the idea of re-creating art that builds on abstract design but focuses on objects related to me. 

Just like Mr. Mohr found his Eureka moment in the form of a ‘cube’, I found mine to be ‘Pac-Man’ — a popular video game as well as the character of the game. Here, I focused on creating a range of shapes – including but not limited to circles, ellipses, arcs, rectangles, spirals and so on. For this, I divided the entire project into five parts:


Part 1: Grid Lines [function draw_grid()]

The first and foremost step was to create a grid. To do this, my initial plan was to use two nested loops and use a combination of the line() function, but it was non-uniform, more tedious and its dimensions were not adjustable dynamically. Instead, I opted for the rect() function to draw a single cell. 

Thus, the canvas size of 1000 pixels by 1000 pixels was divided into tiny square-shaped cells of 50 pixels (in length) each. Using two for loops (in the nested form), the aforementioned square cells were drawn on the canvas. As a final touch, random red, green and blue (RGB) values were picked for the stroke color. Since the draw() function is called recursively on p5.js, the stroke color changes after each frame.  


Part 2: Pac-Man [function fill_pacman(arguments)]

Pac-Man Theme – Courtesy of Pixabay [British Libary]
Now, the task was to create the shape of Pac-Man, which was relatively easy as it is basically a “circular sector”. However, making it dynamic (for analogy, compare it to the rotating cube from Mohr’s experiment) was time-consuming as the shape had to remain recognizable at all times. After a few rounds of experimentation, a changing, yet identifiable, Pac-Man was created using the ‘arc’ function of p5.js. The initial and the final angles of each arc were randomized that could range between 0 and 360, and with a re-adjusted frame rate, a non-static Pac-Man shape was drawn. Each Pac-Man was filled with random RGB values — for all R, G and B values, the random() function was employed that took a total of two parameters. Finally, all the Pacman’s are placed into their respective grid positions using nested “for” loops. 

The entire code was wrapped in the fill_pacman() function with its dependency on six arguments – which were the initial and the final value for random() function used to determine the R, G and B values. This function is called in two places — one in the draw function and the other in the draw_circles() function (which will be discussed later). 


Part 3: Snowfall like effect [function draw_background() and class fallingFlake()] 

I used to play the original Pac-Man game all the time, but during the winter break, it used to be intense. Thus, I wanted to add the snowfall effect to the background of the project. Also, the functionality is handled by the draw_background() function, which depends on the class ‘fallingFlake’. Based on my previous experience, the project becomes more manageable with the help of Object Oriented Programming, thus the use of a class. 

The class consists of four arguments taken as input while object instantiation (or creation): x and y coordinates of each snowball, its radius and speed (gravity) and three methods: constructor, update() and display(). The update() method simply updates the y-coordinate of each snowball, while the display() method displays each snow pellet in the form of a circle. 

Similarly, the draw_background() function creates and stores a list of randomly instantiated 100 (adjustable) snow pellets using a single “for” loop — in doing so, the x-position and the radius of each snowball are assigned randomly while the gravity is set to be 5. The count of snow pellets keeps on adding after each frame. Then, using another “for” loop, the program iterates through the list of snow pellets to display and update them consecutively. 


Part 4: Draw concentric circles [function draw_circles(argument)]

One of the ways to integrate user interaction in the project was by using mouse-click-functionality. Thus, when the mouse is not pressed, grid and Pac-Man are displayed, but as long as the mouse is pressed, a change of screen is visible (which is handled by Parts 4 and 5). 

Here, two sets of concentric circles (centered at the cursor’s position and increasing in radii) are created, and these circles change color as the frame is refreshed. The function takes frameRate from the draw() function as an argument, which in return determines the number of iterations of the “for” loop used to draw the circles. In addition, function fill_pacman() is called here, but with parameters such that the RGB value of the screen is different than that of the screen when the mouse is not clicked. 

Screen when the mouse is not pressed
Screen when the mouse is pressed

Part 5: Drawing a Fermat’s spiral [function draw_Fermat_spiral()]

The final part and the highlight of the project is creating a spiral. The basic idea was to create a Fermat’s spiral that traces its path as it moves along. 

But, to make the overall functionality more interesting as well as to preserve other background components of the project, the code has been modified so that just the leading point of the spiral is visible. The function itself is a short one, but it’s a highlight because of all the Mathematical brainstorming that went behind it. 

Determining the x and y coordinates of the leading point of the spiral and updating it while displaying the trace was a major task. After repeated trials, this was done with the help of two Mathematical values (angle of curvature and the main radius of curvature), while the inner_radius sets the radius of the leading circle. Initially, I was using lines to trace the path, but the use of an ellipse combined with two trigonometric ratios simplified the overall spiral creation. 

The video shows the pattern the code shown above generates on a plain background:

As mentioned earlier, for this project, the function has been modified so that the user can keep on clicking on the screen, and the spiral will build around the cursor; however, just the head of the spiral is visible to the user, which keeps revolving around the cursor. 


Reflection

In short, I am pleased with the final piece. As I spent more time brainstorming than coding, I was dubious about the project, but in retrospect, it proved to be interesting, entertaining as well as rewarding. 

There are a few things that I will work on in the future: 

  1. When the mouse is clicked, I originally intended to create a visual music effect. It has been partially done in terms of graphics. Now, adding sound files and maybe synchronizing the expansion of concentric circles with musical beats will be my next target. 
  2. The code is somewhat streamlined in terms of modularity. Nonetheless, it is laggy as the list that stores all the snowball objects keeps on growing in size. Thus, it can be cleared at the end of the program in future versions. 
  3. Incorporating more user interactions into the project. 

With these improvements, the code will be more responsive. Plus, the addition of a range of effects as deemed necessary will further enhance the project. 

Self-Portrait

Context/ Inspiration:

The primary reason I was drawn toward Mathematics, ultimately toward Computer Science, was symmetry — whether that be the pattern of infinity or the Kanizsa triangle. The habit persists; irrespective of the discipline I am currently involved in, I tend to experiment with said patterns. That’s why, for this assignment, I have chosen to implement Bézier curves as I create a self-portrait using pre-defined functions of p5.js.


Project Idea:

A Bézier curve is used to produce smooth curves with the help of two ‘anchor points’ (which determine the initial and the final points of the curve) and two ‘control/ handle points’ (which determine the pull of the curve). In other words, it can be understood as “a linear interpolation of a linear interpolation” of a curve.  I have incorporated the idea of the Bézier curve as a background of my self-portrait, which I consider to be the highlight of my project too. 

I started with a canvas of “900×900” pixels, and my first focus was on the creation of Bézier curves. The project is divided into numerous functions; one of which is ‘draw_background’ which produces Bézier curves. For the starting point, I initially used the random() function to generate unique values (almost!). However, I changed it to mouseX and mouseY so that the starting point of each curve is determined by the position of the cursor. Even if the cursor remains static, the initial point is set to be (0,0). Similarly, for the remaining points (final anchor point and control points), I combined noise() function to create Perlin noise, which essentially extends to infinite n-dimensional space unlike random() function, and randomly generated numbers with some algebraic manipulations. This YouTube video introduced me to the noise() function, while for more technical information, I relied on the reference page of p5.js. Thus, a series of Bézier curves are generated. The value of ‘counter’ is increased after each frame to produce a unique curve. In addition, the function includes two additional functionalities: (1) after 10,000 frames or (2) when the user clicks on the screen, whichever occurs first will reset the background to its predetermined stage. 

In addition to the default setup() and draw() functions, the actual self-portrait is categorized into twelve additional functions that are included in the draw() function in the order of positioning. Each of these functions utilizes the fundamental idea of primitive shapes taught in the lecture.

After implementing the background function, I moved to draw the face of the character. To pick the desired RGB value, I used a color-picker extension, fired up Google to open a real person’s image and copied the RGB value that I found appropriate; thus, I had the color of the character’s skin. Then, I used arc() function to create the upper and the lower section of the head while feeding the required parameters into the function. Similarly, the draw_eyes() function was implemented using the arc() and the circle() modules to create the outline of the eyes and pupil respectively, while draw_ears() required the use of arc() and ellipse() functions. This way, the remaining functions utilized a combination of existing functions like line(), rectangle(), arc() and ellipse() to draw an outline of different parts of the character’s body. 

Another unique function was draw_hair() function, which required the use of beginShape() and endShape() functionality. Using this combination, I was able to plot a number of vertices using curveVertex(), thus a curve was created and filled with RGB values to replicate the structure of human hair. The function itself is positioned such that it appears on the bottom of the draw_hat() function. 

This way, I kept on coding and the project is programmed to represent my self-portrait. 


Reflection:

Overall, I am satisfied with my project. But, there are a few things I could have definitely restructured to come up with an efficient final product:

  1. The canvas design is determined by two variables — w and h — set at the very beginning of the program: the target was to create a dynamic canvas size. However, with a number of shapes included, small tweaks (for instance: width/2 + some number) had to be implemented to position those shapes. Thus, changing the value of w and h create a chaotic design. 
  2. While implementing beginShape() and endShape() functions, the value of vertices had to be hard-coded, which felt quite limiting. Thus, proper pre-planning combined with object-oriented and reading from local file methods could have improved the project. 

In short, it was an interesting project — the project itself felt like a unique amalgamation of ‘generative’ art (in some ways) and elementary art. It was a fresh experience for me, and I look forward to completing such creative projects in the days to come. 

That said, what could be more interesting than integrating ‘randomness’ in fixed lines of computer code?